Downloaded 16 times
;
(iii) Price and demandof goods.](https://image.slidesharecdn.com/unit-5-150318053535-conversion-gate01/85/Unit-5-Correlation-2-320.jpg)
![Note:
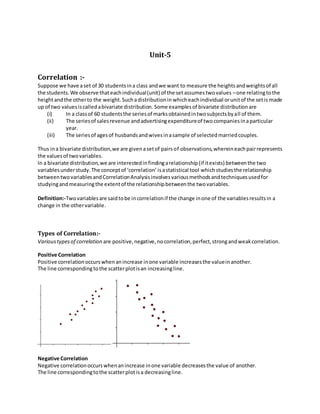
(i) If the pointsare veryclose to eachother,a fairlygoodamountof correlationcanbe
expectedbetweenthe twovariables.Onthe otherhandif theyare widelyscatteredapoor
correlationcanbe expectedbetweenthem.
(ii) If the pointsare scatteredandtheyreveal noupwardor downwardtrendas inthe case of
(d) thenwe say the variablesare uncorrelated.
(iv) If there is an upwardtrendrisingfromthe lowerlefthandcornerandgoingupwardto the
upperrighthand corner, the correlationobtainedfromthe graphissaidto be positive.Also,
if there isa downward trendfromthe upperlefthandcornerthe correlationobtainedissaid
to be negative.
(v) The graphs shownabove are generallytermedasscatterdiagrams.
The CoefficientofCorrelation (Karl Pearson’smethod)
The Karl Pearson’smethodispopularlyknownasPearson’sCoefficientof correlation.
One of the mostwidelyusedstatisticsisthe coefficientof correlation ‘𝑟’whichmeasuresthe degree of
association betweenthe twovaluesof relatedvariablesgiveninthe dataset.The coefficientof
correlation‘r’isgivenbythe formula
𝑟 =
∑ 𝑋𝑌
𝑛𝜎 𝑥 𝜎 𝑦
=
∑ 𝑋𝑌
√∑ 𝑥2 ∑ 𝑦2
[∵ 𝜎2
𝑥 =
∑ 𝑥2
𝑛
; 𝜎2
𝑦 =
∑ 𝑦2
𝑛
]
Here 𝑋 = ( 𝑥 − 𝑥̅); 𝑌 = ( 𝑦 − 𝑦̅)
𝜎 𝑥 =Standarddeviationof series 𝑥
𝜎 𝑦 =Standarddeviationof series 𝑦
𝑛 = Numberof pairsof observations
𝑟 = The (productmoment) correctioncoefficient
Thismethodisto be appliedonlywhere deviationsof itemsare takenfromactual meanandnot from
the assumedmean.
The valuesof coefficientof correlation ‘𝑟’obtainedfromthe above formulaalwayslies between ±1.
Whenr = +1 it meansthere isa perfectpositivecorrelationbetweenthe variables. Whenr= -1 it means
there isa perfectnegative correlationbetweenthe variables. Howeverif r= 0 there isno relationship
betweenthe variables.
Direct method:-
Substitutingthe valuesof 𝜎 𝑥 and 𝜎 𝑦 inthe above formula,we get
𝑟 =
∑ 𝑋𝑌
√∑ 𝑋2 ∑ 𝑌2
,
or
𝑛 ∑ 𝑋𝑌
√[ 𝑛 ∑ 𝑥2−(∑𝑥)2×{ 𝑛∑ 𝑦2−∑ 𝑥2}]
Example:- Making use of the data summarizedbelow,calculate the coefficientof correlation.
Case A B C D E F G H](https://image.slidesharecdn.com/unit-5-150318053535-conversion-gate01/85/Unit-5-Correlation-3-320.jpg)
![x 10 9 6 10 12 13 11 9
y 9 4 6 9 11 13 8 4
Solution:-
Case 𝑥 𝑥 − 10
= 𝑋
𝑋2 𝑦 𝑦 − 8
= 𝑌
𝑌2 𝑋𝑌
A 10 0 0 9 1 1 0
B 9 -4 16 4 -4 16 16
C 6 -1 1 6 -2 4 2
D 10 0 0 9 +1 1 0
E 12 +2 4 11 +3 9 6
F 13 +3 9 13 +5 25 15
G 11 +1 1 8 0 0 0
H 9 -1 1 4 -4 16 4
𝑛 = 8 ∑𝑥 = 80 ∑𝑋 = 0 ∑𝑋2 = 32 ∑𝑦 = 64 ∑𝑌 = 0 ∑𝑌2 = 72 ∑𝑋𝑌 = 43
𝑥̅ =
∑𝑥
𝑛
=
80
8
= 10 , 𝑦̅ =
∑𝑦
𝑛
=
64
8
= 8
𝑟 =
∑ 𝑋𝑌
√∑ 𝑋2 ∑ 𝑌2
=
43
√32 × 72
=
43
√2304
=
43
48
= +0.896
Directmethod:-
Substitutingthe valuesof 𝜎 𝑥 and 𝜎 𝑦 inthe above formula,we get
𝑟 =
∑ 𝑋𝑌
√∑ 𝑋2 ∑ 𝑌2
,
or
𝑛 ∑ 𝑋𝑌
√[ 𝑛 ∑ 𝑥2−(∑𝑥)2×{ 𝑛∑ 𝑦2−∑ 𝑥2}]
Regression
If two variablesare significantlycorrelated,andif there issome theoretical basisfordoingso,itis
possible topredict (estimate) valuesof one variable fromthe other.Thisobservationleadstoavery
importantconceptknownas ‘RegressionAnalysis’.
For example,if we knowthatthe advertisingandsalesare correlatedwe findoutexpectedamountof
salesfora givenadvertisingexpenditure forattainingagivenamountof sales.Similarlyif we knowthe
yieldof rice andrainfall are closelyrelatedwe mayfindoutthe amountof rainis requiredto achieve a
certainproductionfigure.
In general Regressionanalysis meansthe estimationorpredictionof the unknownvalue of one variable
fromthe knownvalue of the othervariable.Itisone of the most importantstatistical toolswhichis
extensivelyusedinalmost all sciences –Natural,Social andPhysical.Itis speciallyusedinbusinessand
economicstostudythe relationshipbetween twoormore variablesthatare relatedcausallyandforthe
estimationof demandandsupplygraphs,costfunctions,productionand consumption functionsandso
on.
Predictionorestimationisone of the majorproblemsinalmostall the spheresof humanactivity.The
estimationorpredictionof future production, consumption,prices,investments,sales,profits,income
etc.are of verygreatimportance tobusinessprofessionals.Similarly,populationestimatesand](https://image.slidesharecdn.com/unit-5-150318053535-conversion-gate01/85/Unit-5-Correlation-4-320.jpg)


The document discusses bivariate distribution and correlation. It defines bivariate distribution as a distribution where each individual or unit of a set assumes two values, relating to two different variables. Correlation analyzes the relationship between two variables in a bivariate distribution. There are different types of correlation like positive, negative, no correlation, perfect correlation and weak/strong correlation. The coefficient of correlation, calculated using Pearson's method, measures the degree of association between two related variables. Regression analysis involves predicting the value of one variable based on the known value of another variable if they are significantly correlated.