Download to read offline


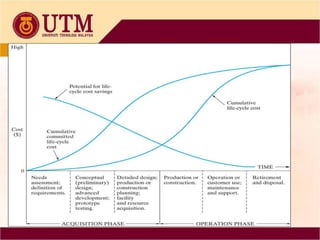

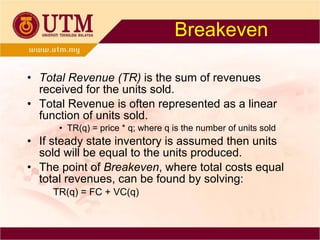
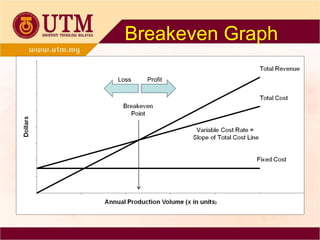

Cost estimating is used to determine project costs, profitability, and productivity improvements. The top-down approach uses historical data from similar projects, while the bottom-up approach breaks costs down into small units. Costs can be categorized as fixed, variable, incremental, direct, indirect, standard, opportunity, life-cycle, cash, book, and sunk. Breakeven analysis determines the production level where total revenue equals total costs.


![Getting Started with Apache Spark: Big Data Made Simple [Free Meetup]](https://cdn.slidesharecdn.com/ss_thumbnails/apachesparkgettingstarted-260203175547-8361bcc3-thumbnail.jpg?width=640&height=640&fit=bounds)


