Downloaded 338 times
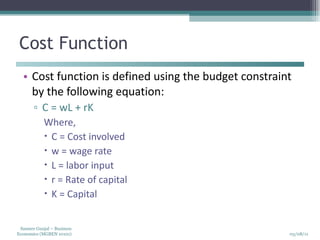
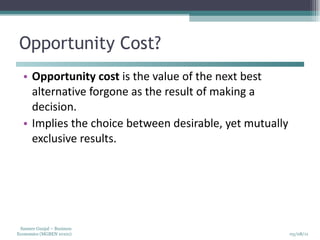
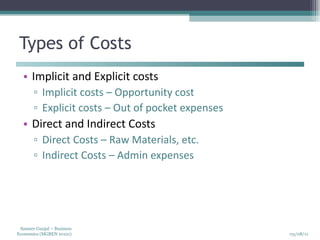
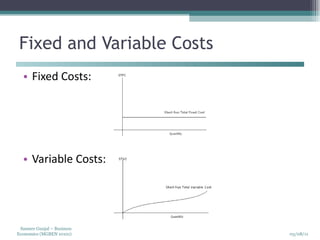
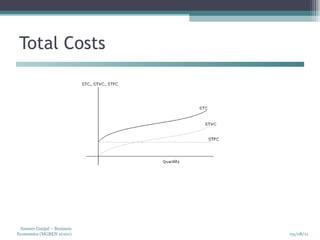
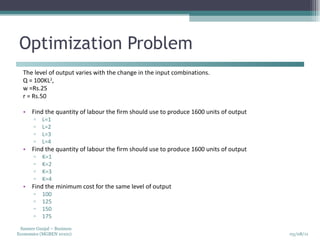
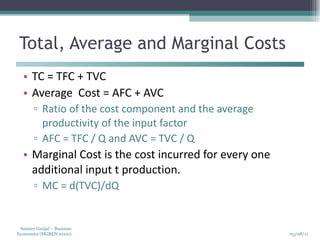
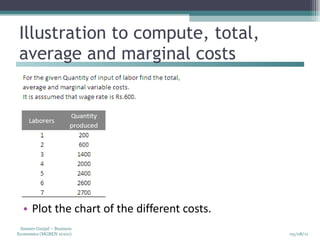
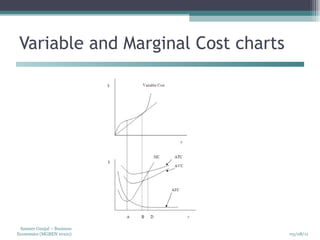
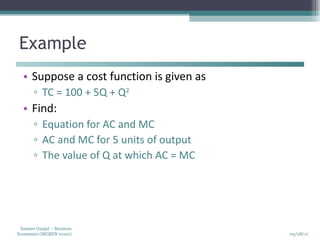
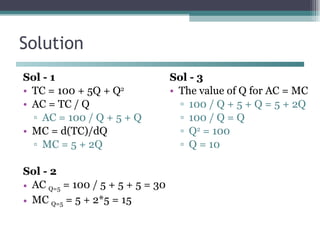
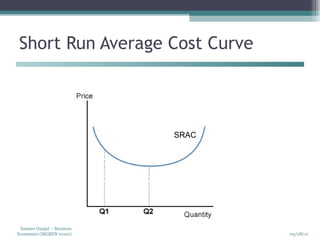
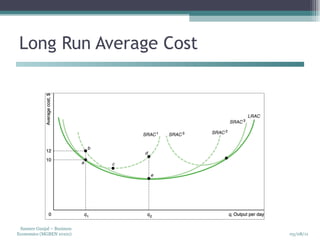
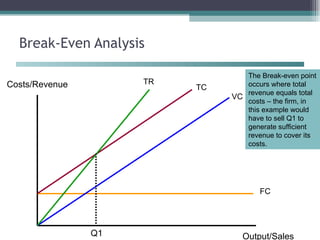
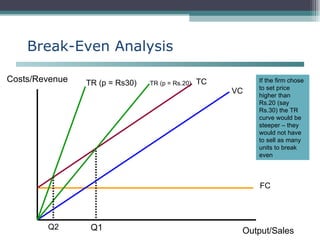
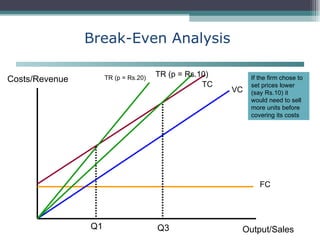
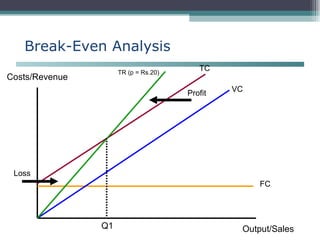
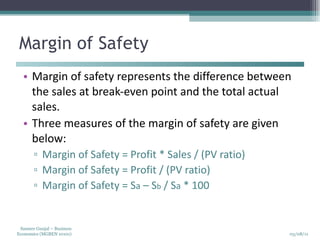
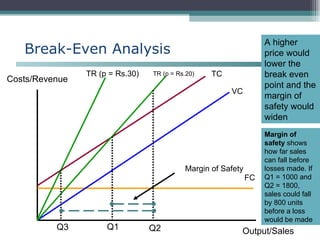
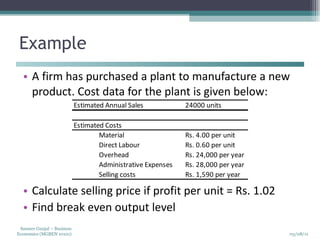
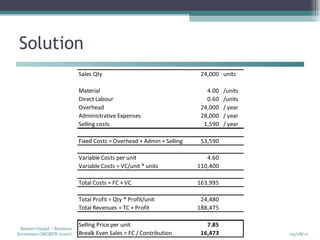


The document discusses various cost concepts in business economics including cost functions, opportunity costs, types of costs, fixed and variable costs, total costs, average costs, marginal costs, break-even analysis, contribution margin, and profit-volume ratio. It provides definitions and formulas for these concepts and illustrates their calculation and application in decision making.


