Downloaded 100 times


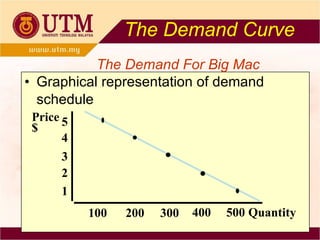

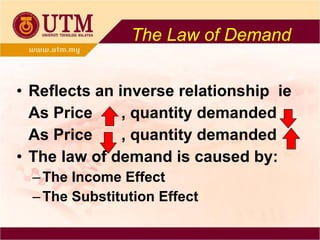


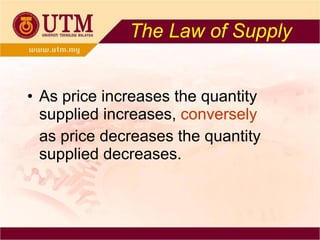
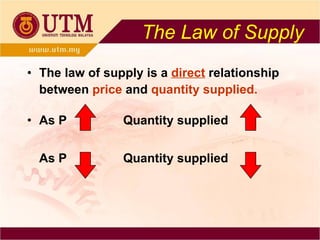

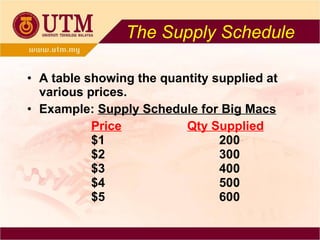

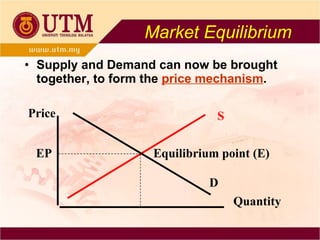


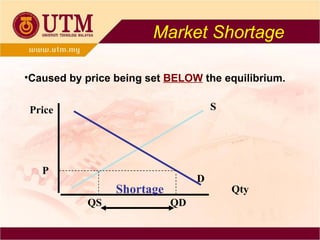
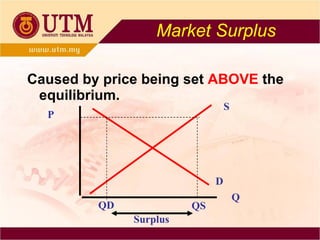

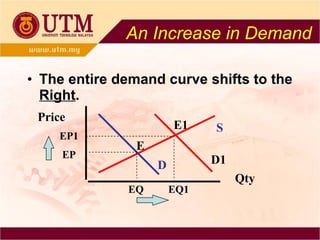
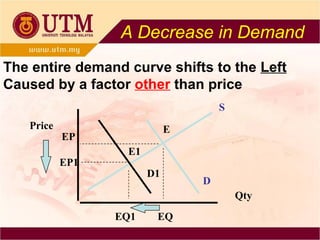


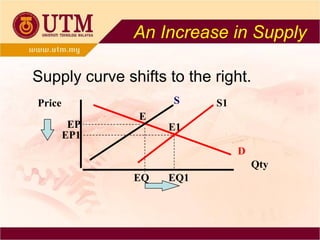
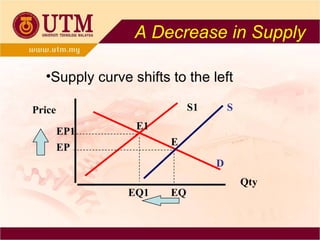


1. The document discusses demand, supply, and equilibrium in markets. It defines demand as the quantity of a product consumers will purchase at various prices, and supply as the quantity producers will provide. 2. The law of demand and supply state that demand is inversely related to price, while supply is directly related. Equilibrium occurs where quantity demanded equals quantity supplied. 3. Changes in demand or supply curves can shift them, disrupting equilibrium and causing shortages or surpluses until a new equilibrium is reached. Factors like income, tastes, and input costs influence demand and supply conditions.