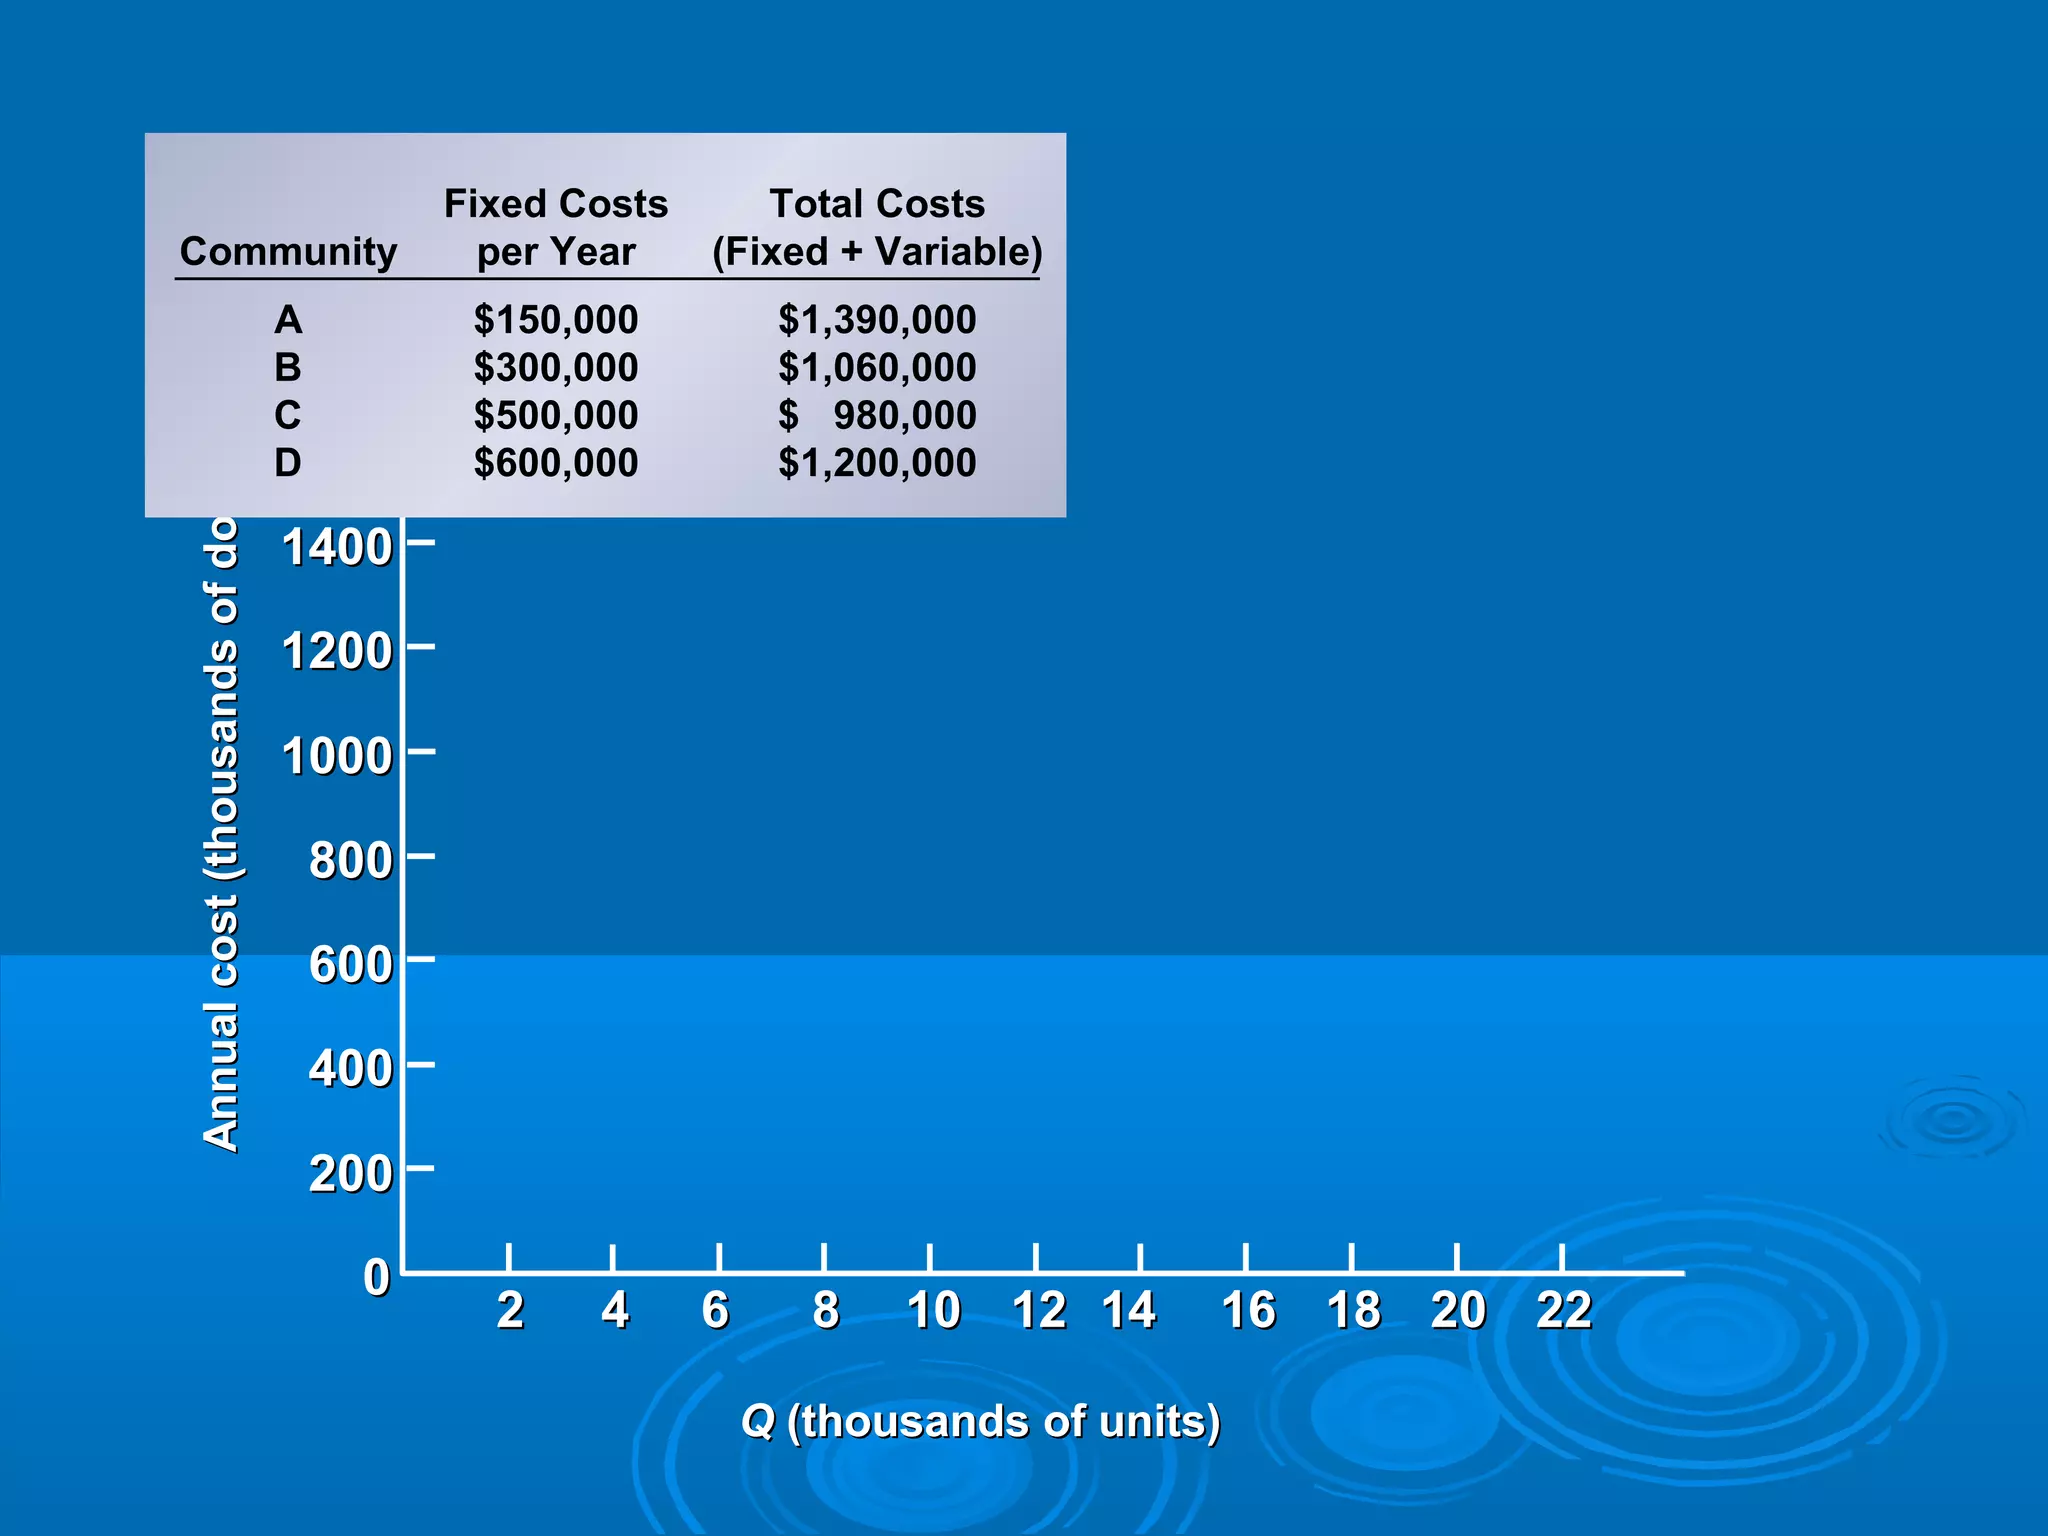
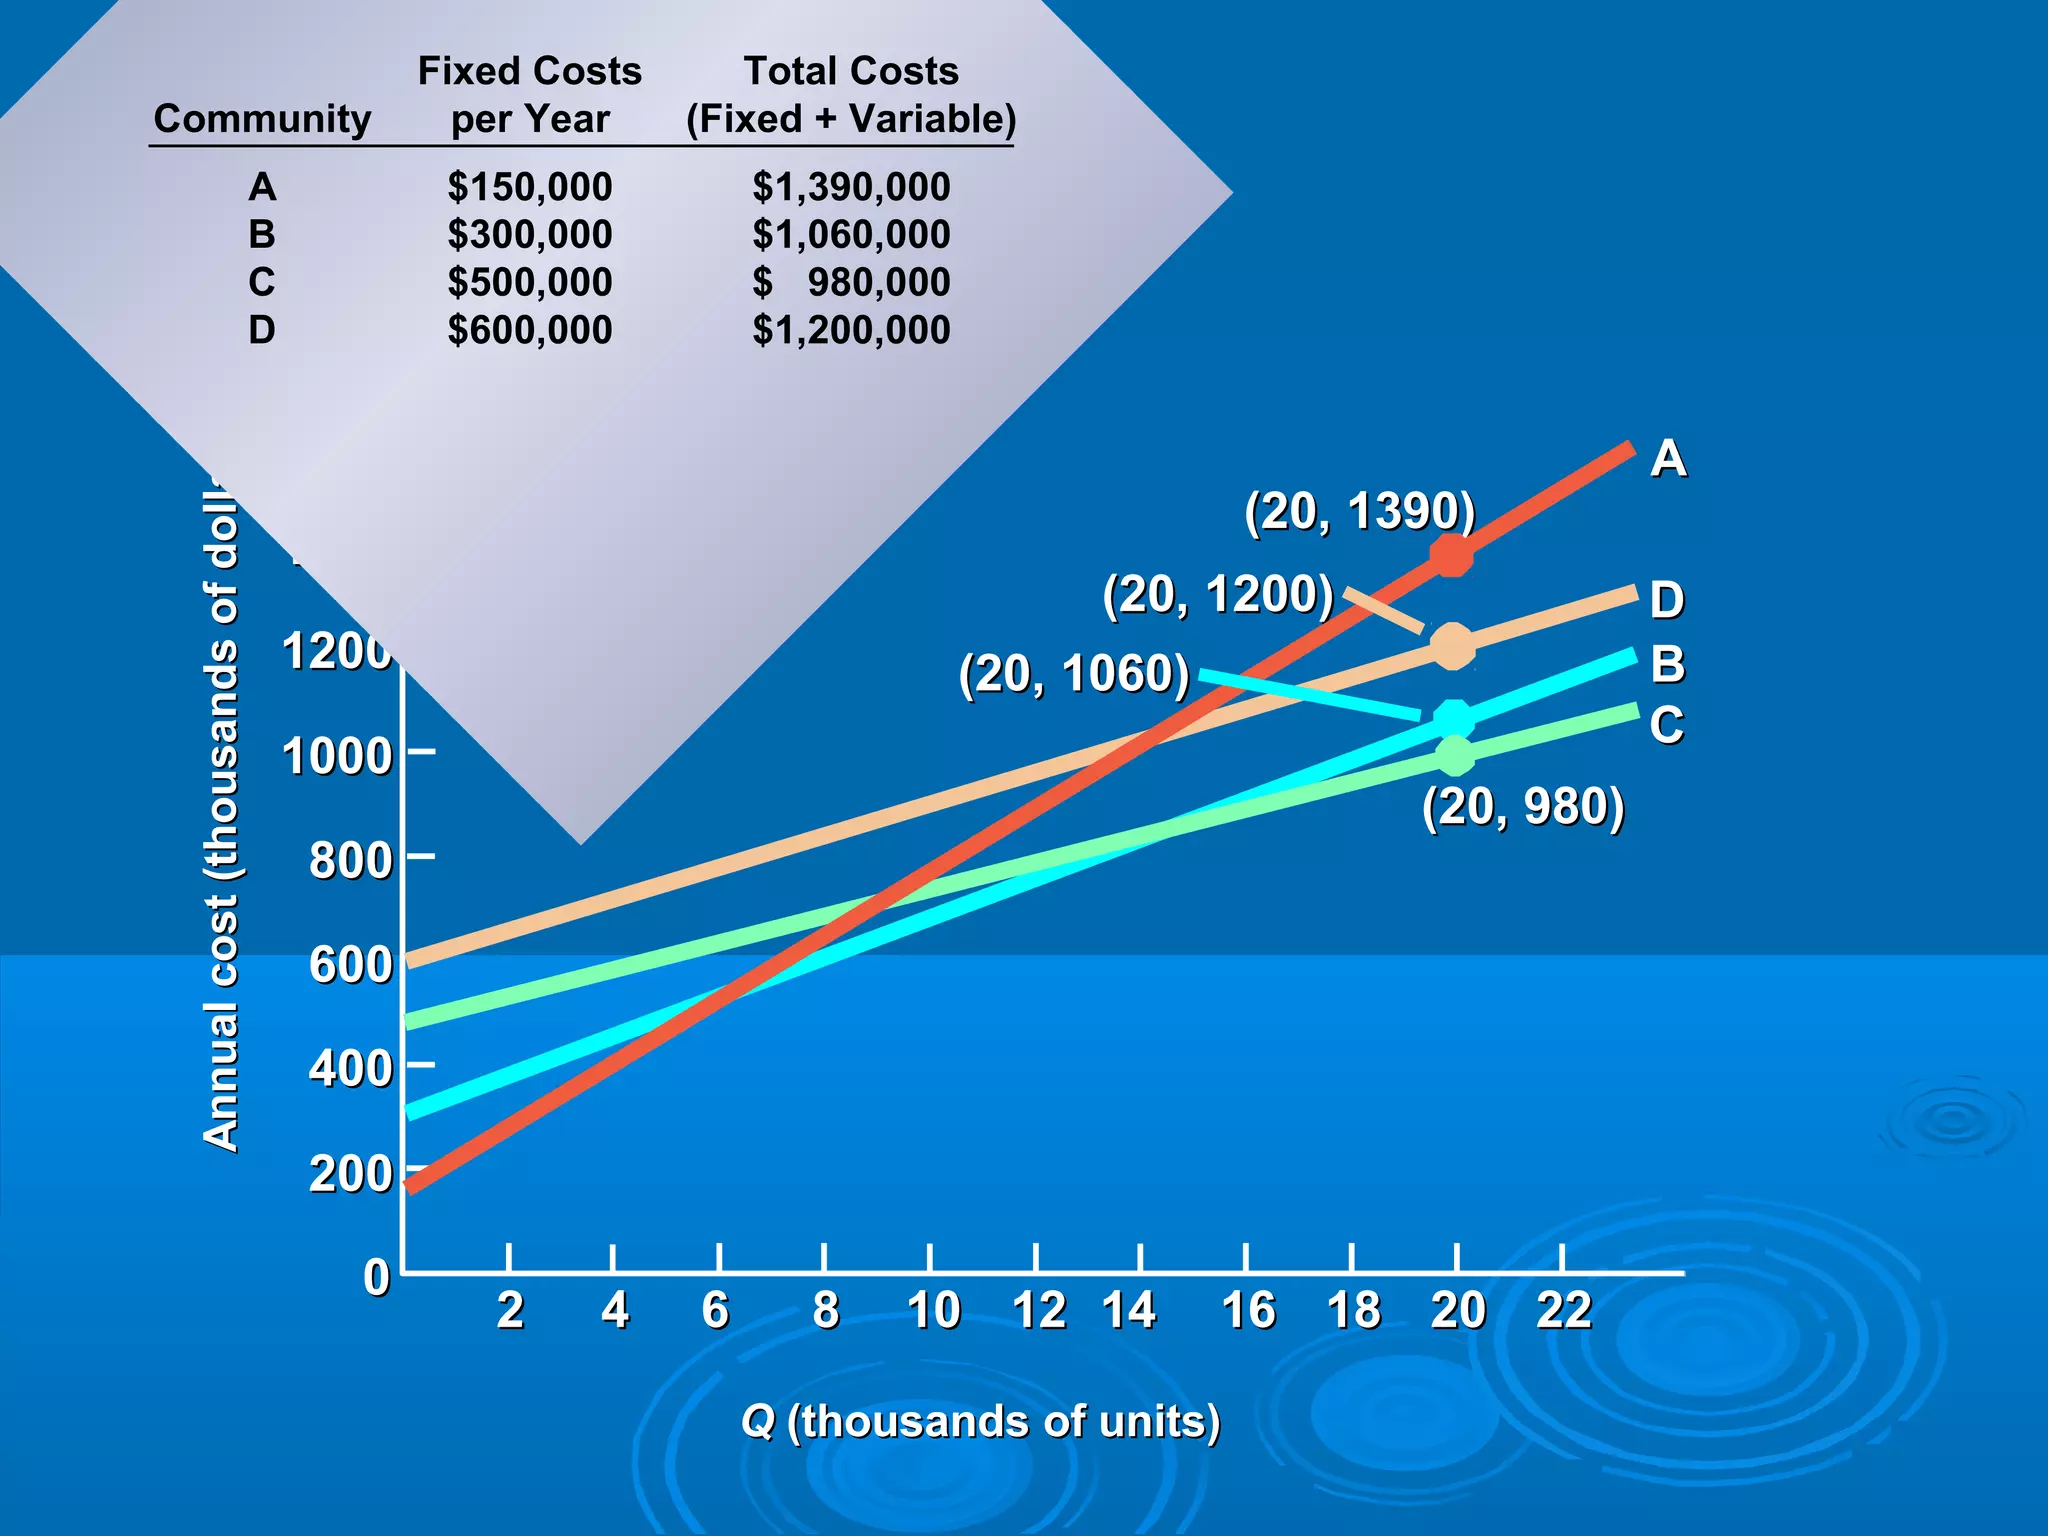
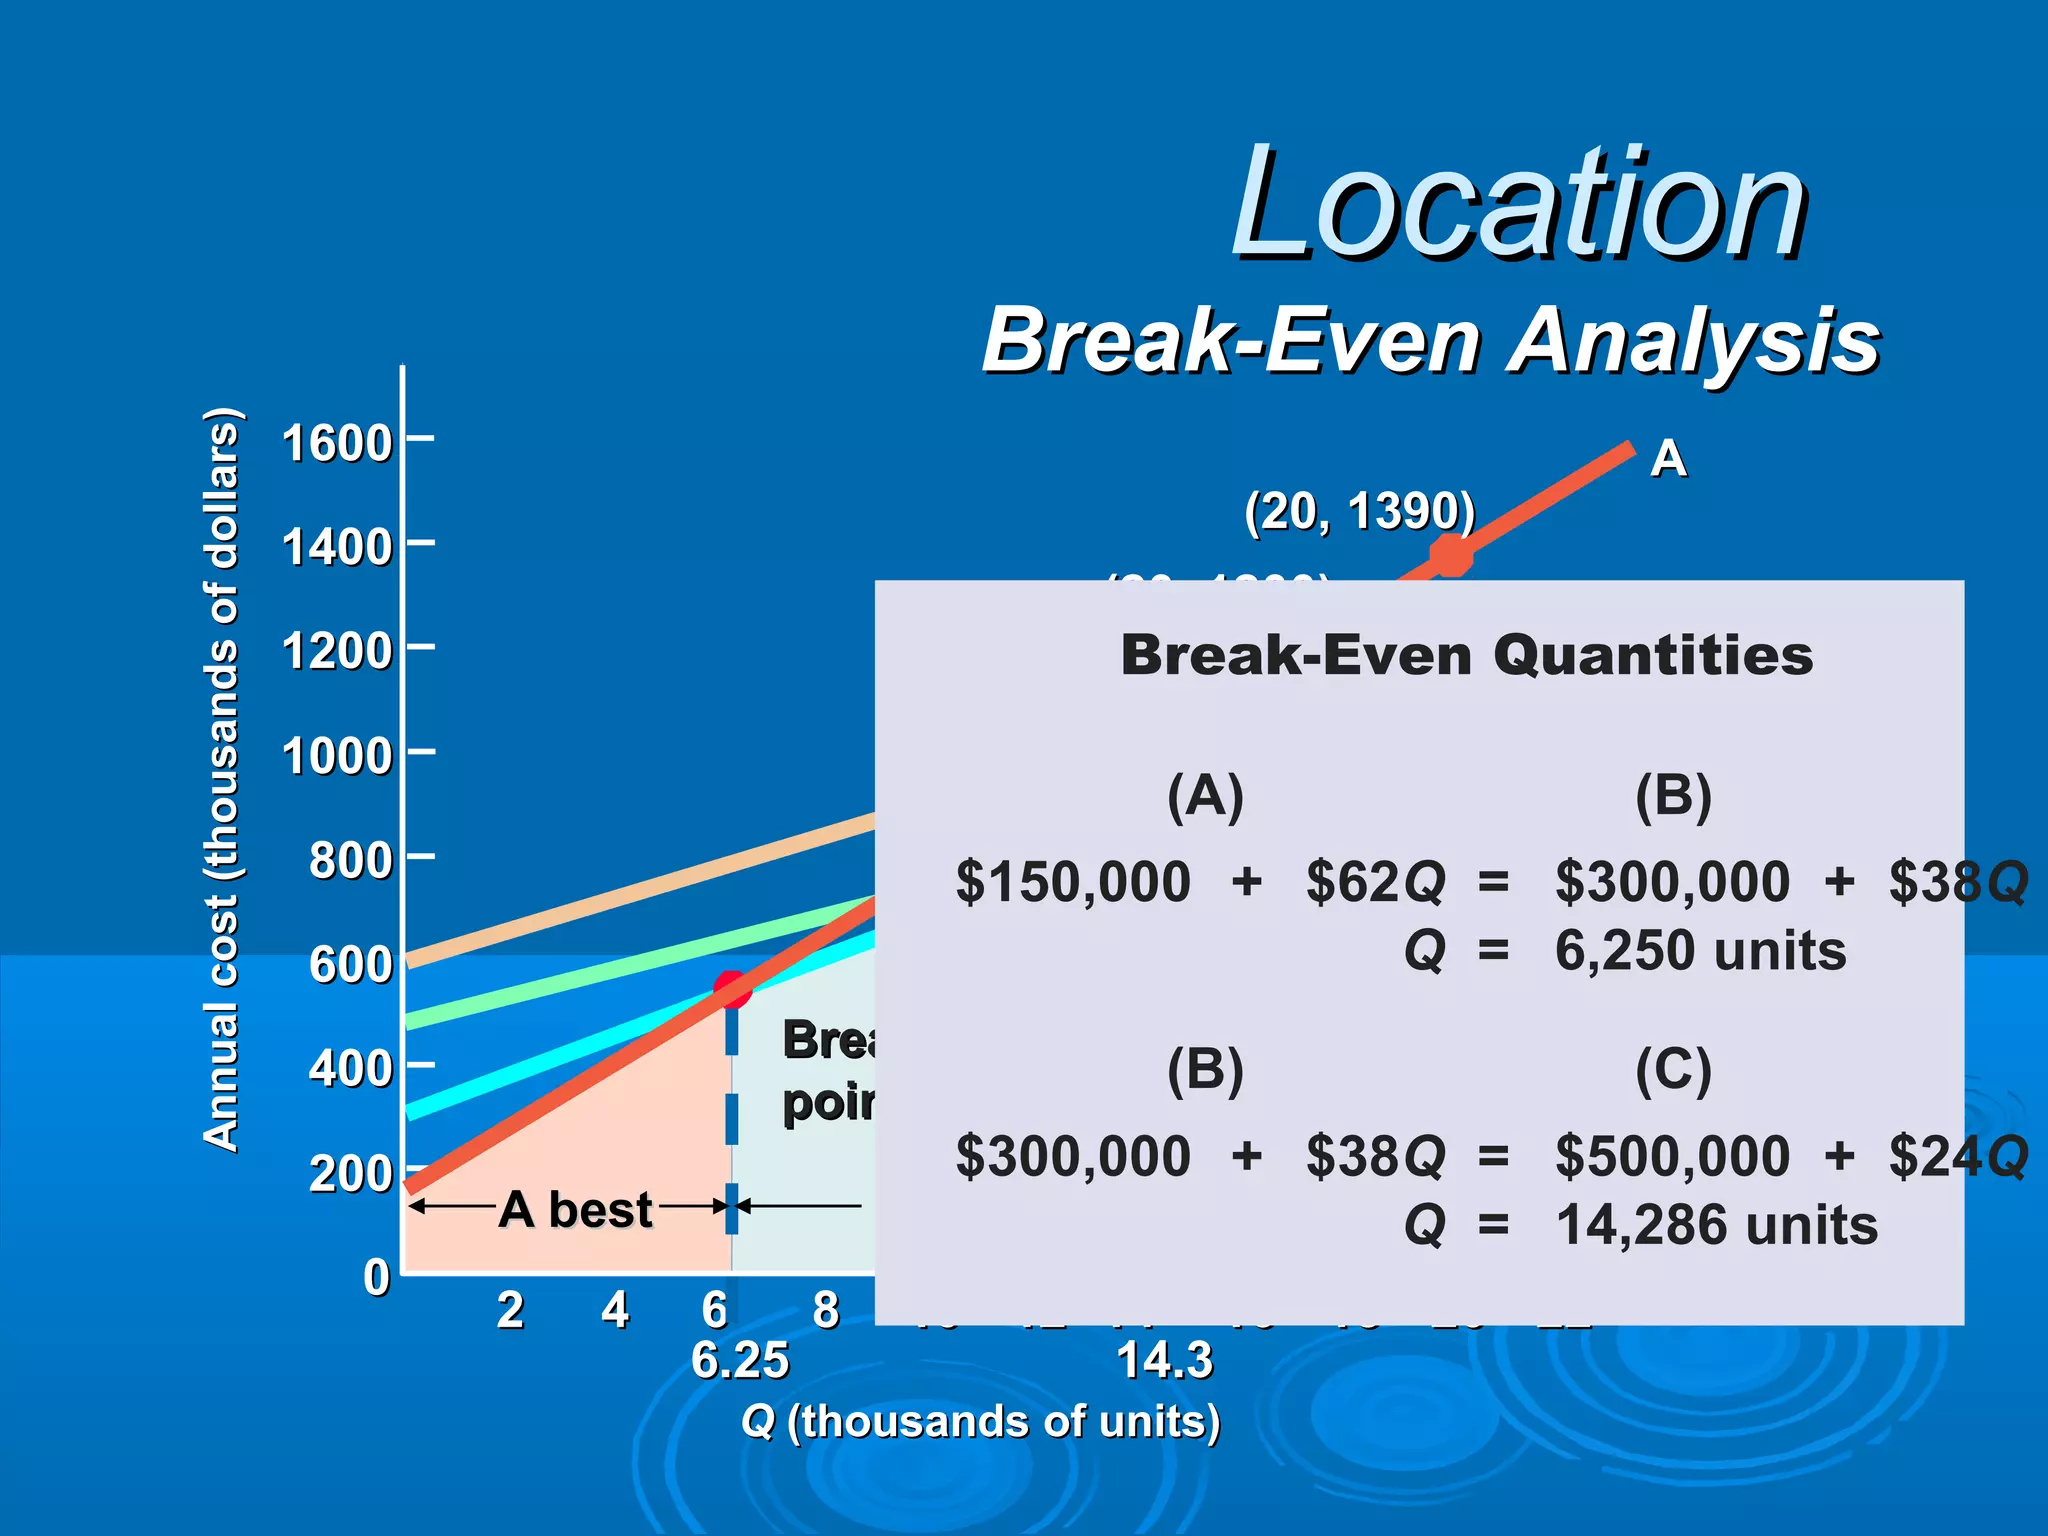
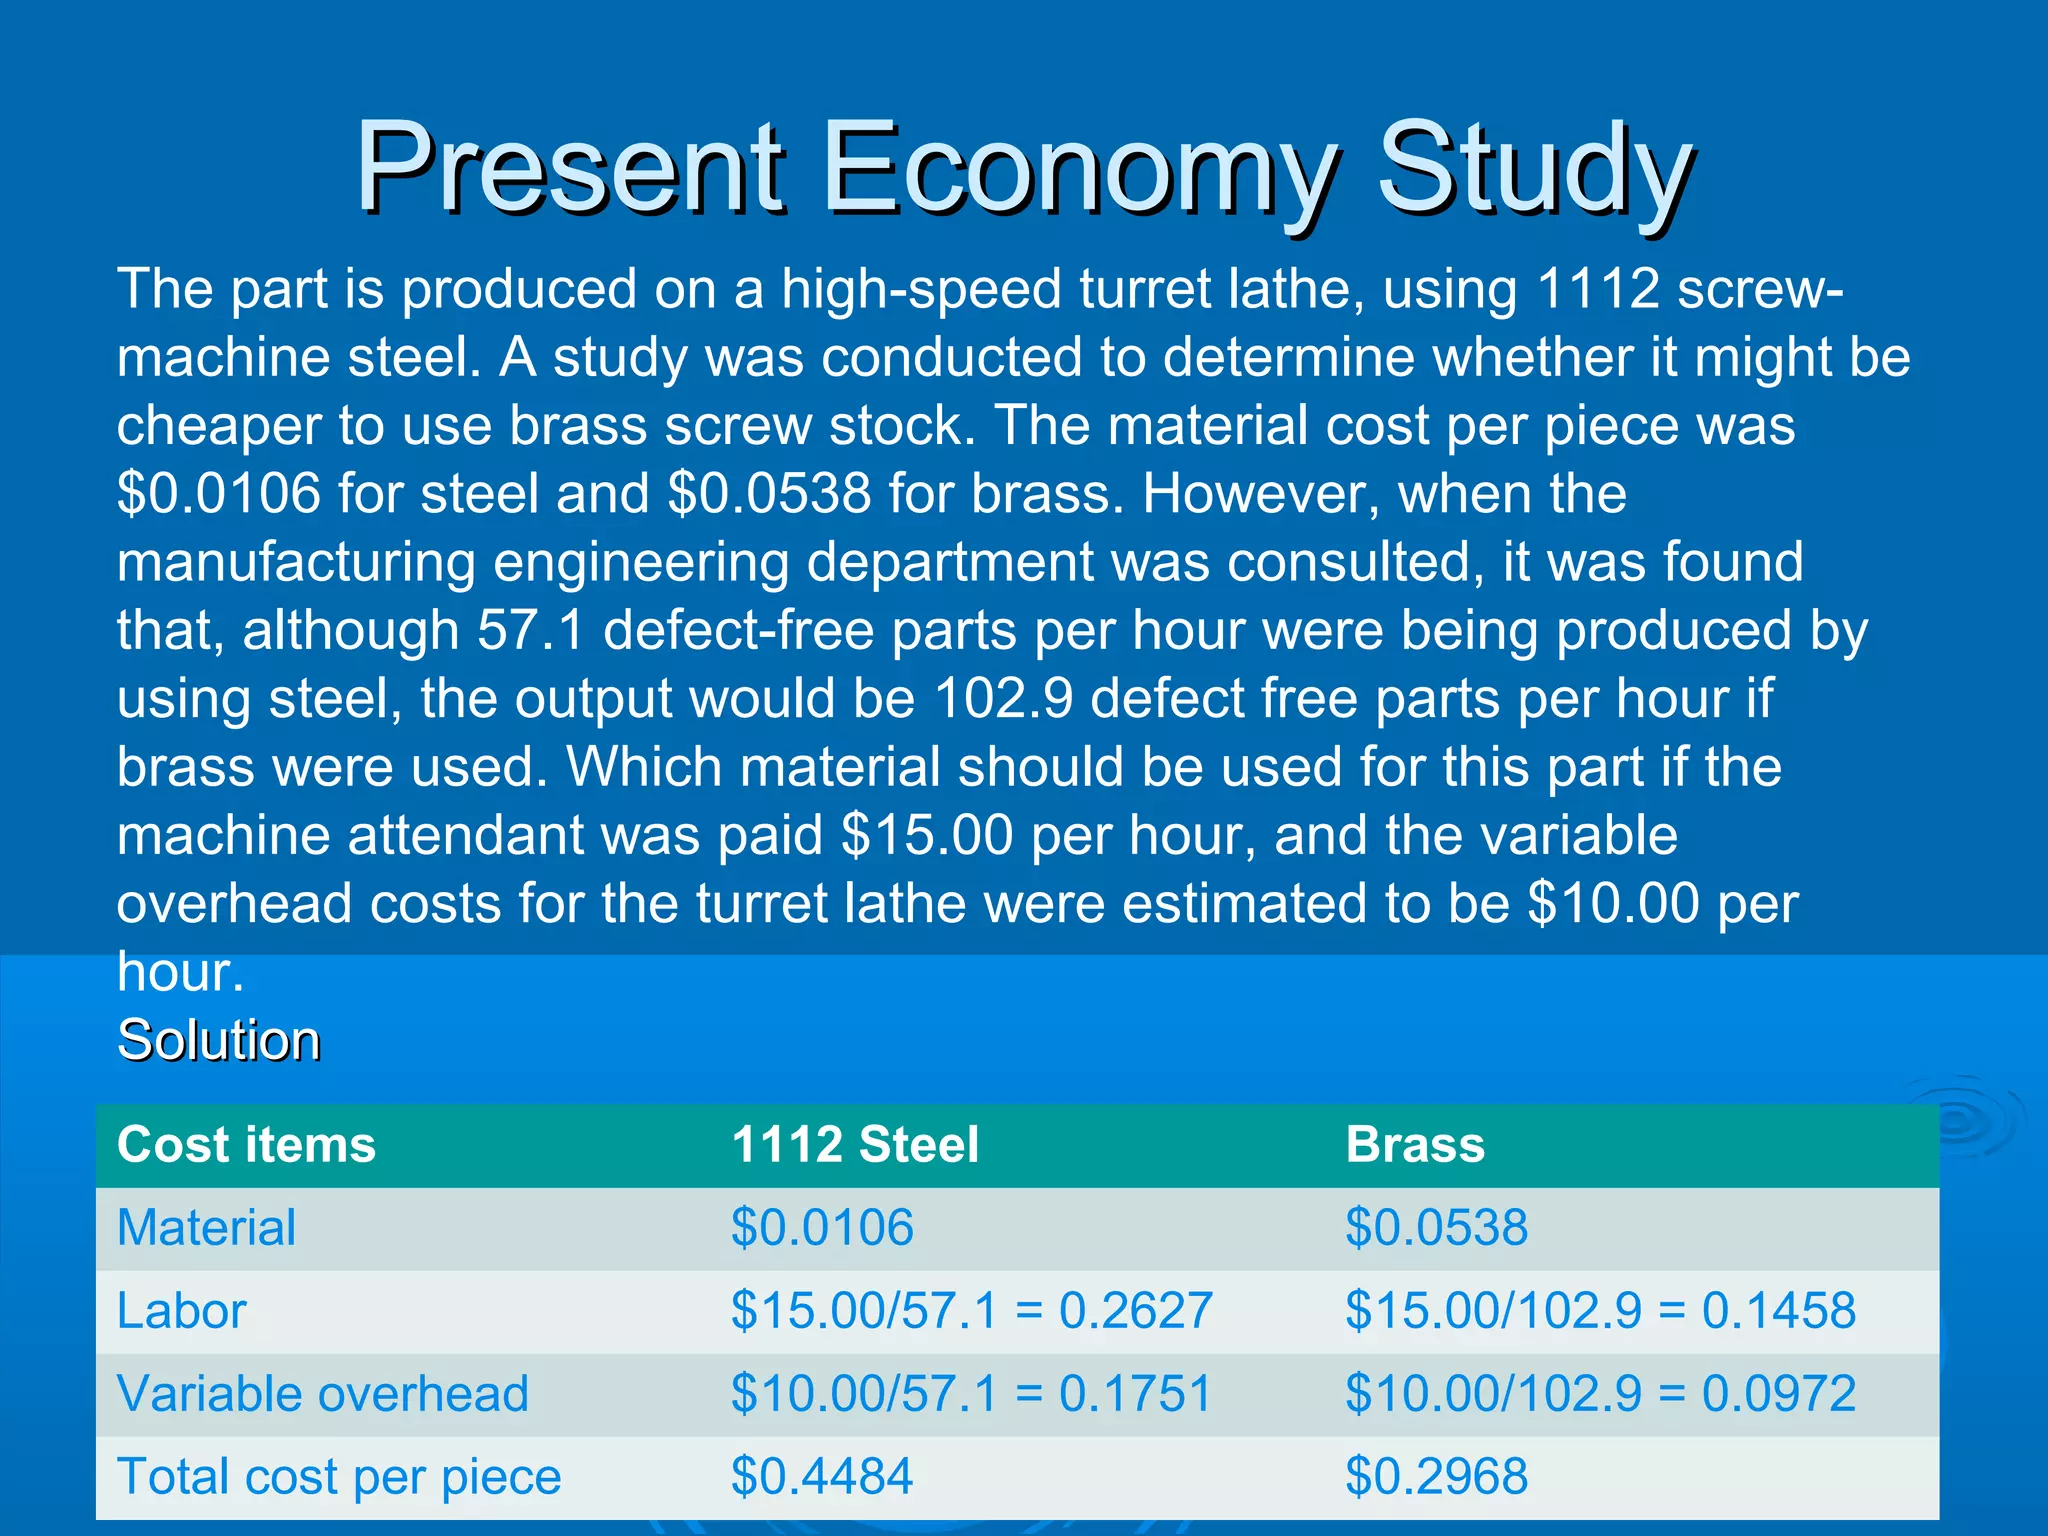
The document discusses cost concepts and their application. It defines different types of costs such as fixed costs, variable costs, opportunity costs, sunk costs, explicit costs, and implicit costs. It also discusses total cost, which is the sum of fixed and variable costs. The total cost equation and linear cost equation are presented. Examples are provided to illustrate calculating total production costs, break-even points, and profits using the total cost equation. Location selection for facilities is also discussed, with factors like proximity to markets and suppliers, labor availability, and costs being considered in a break-even analysis.


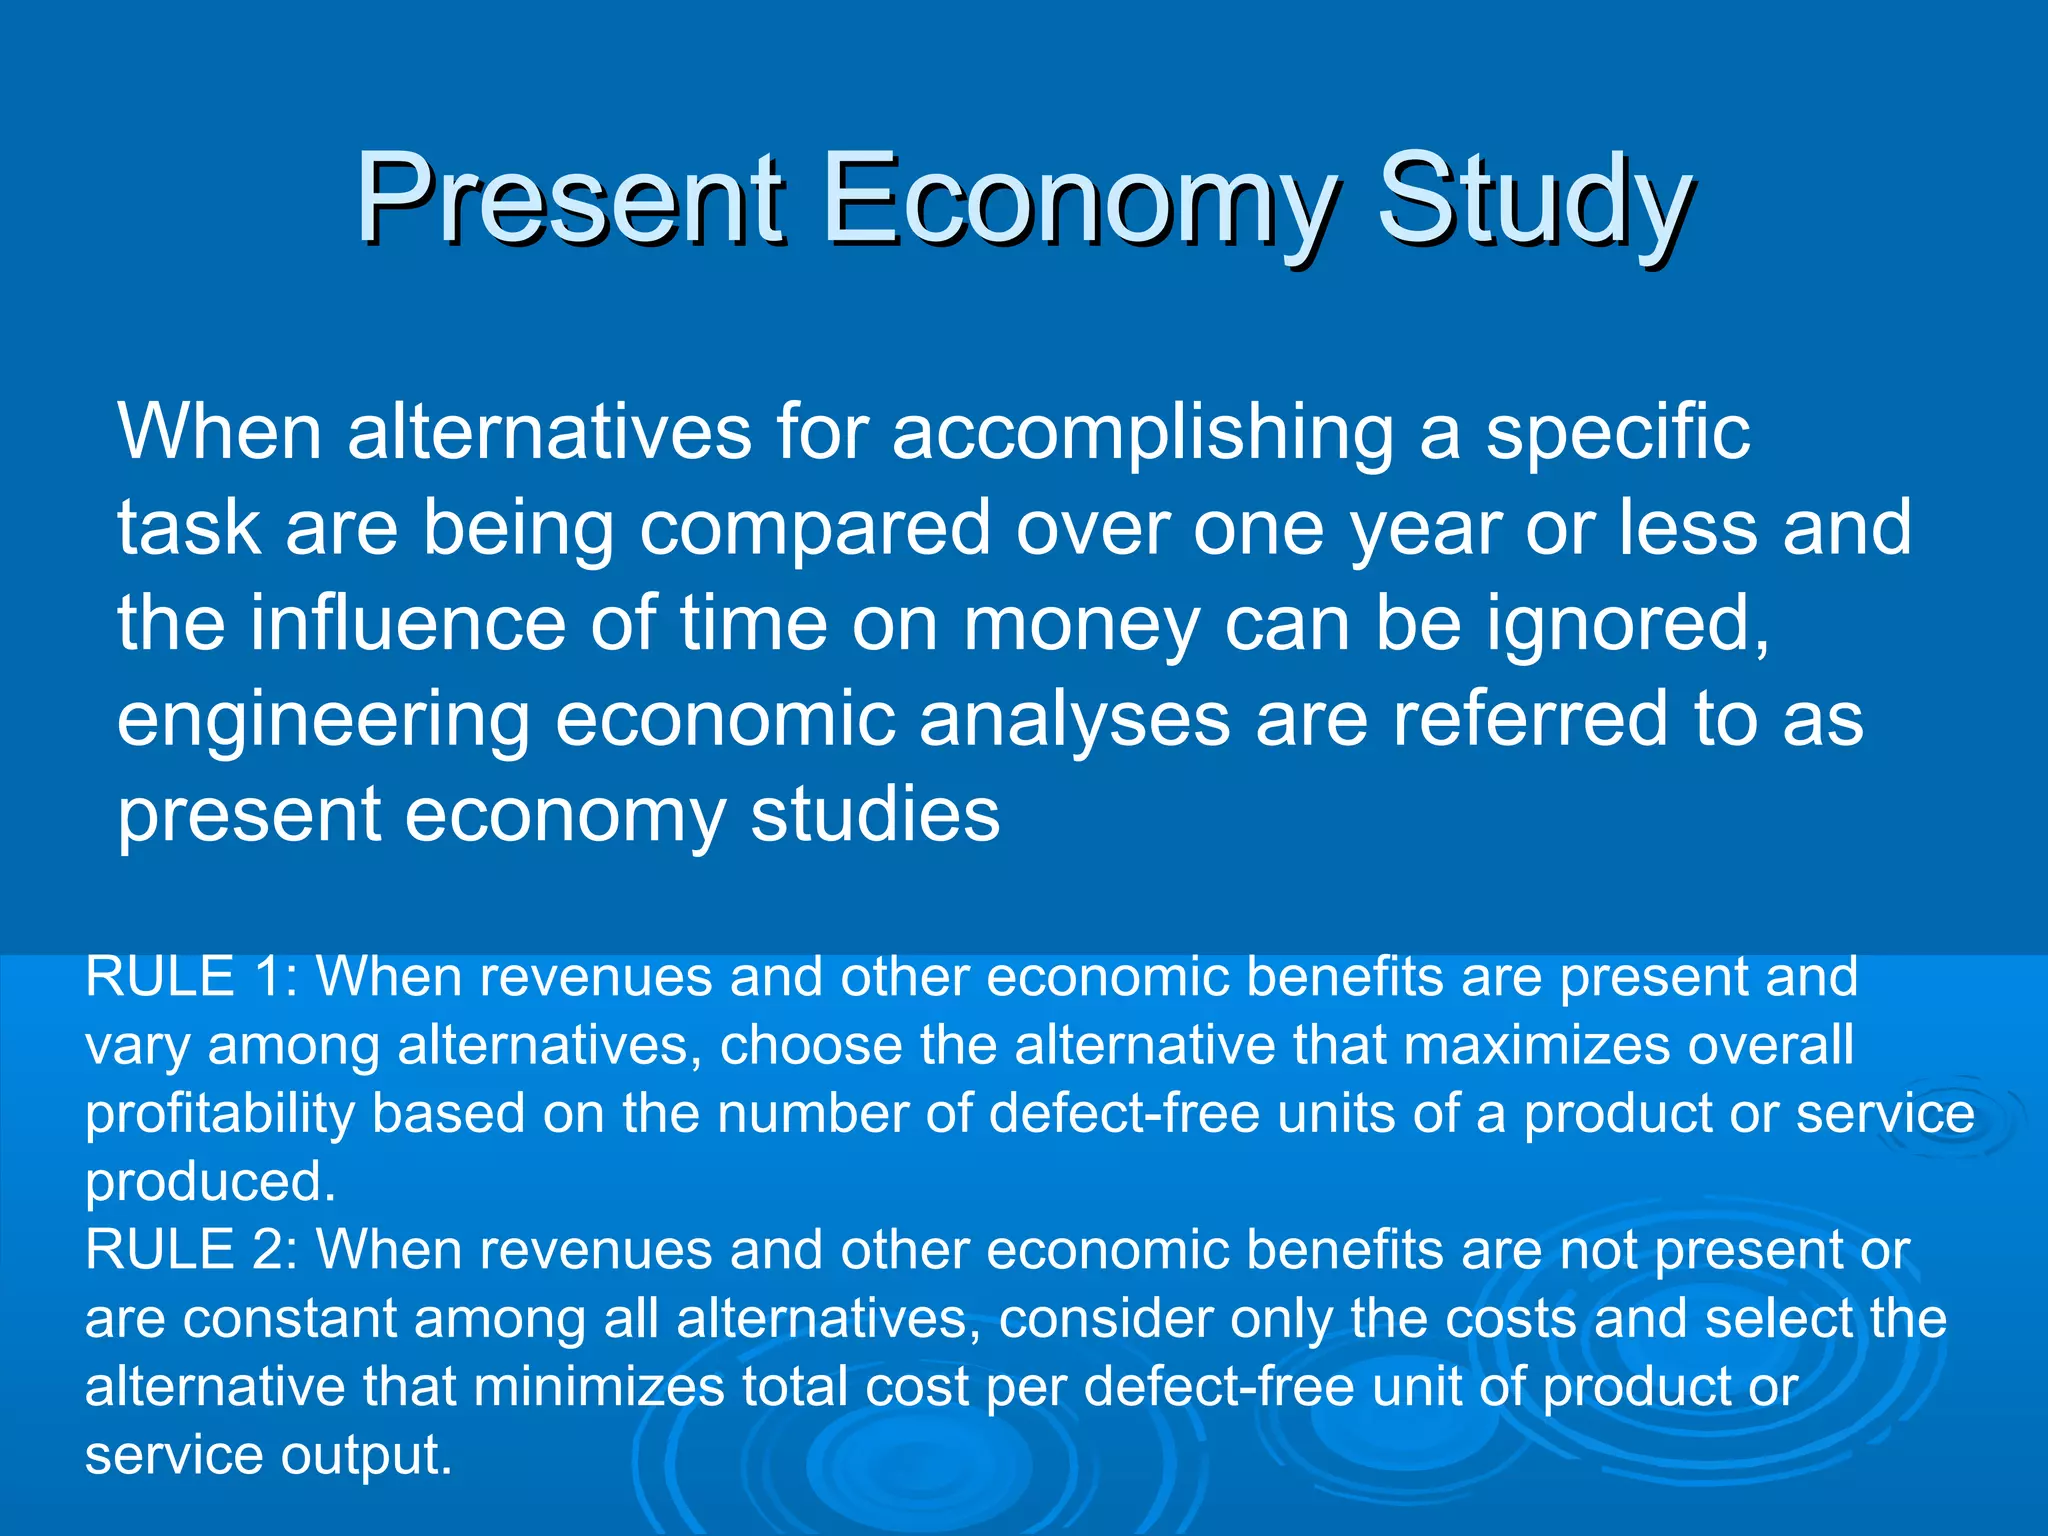
![Present Economy StudyPresent Economy Study
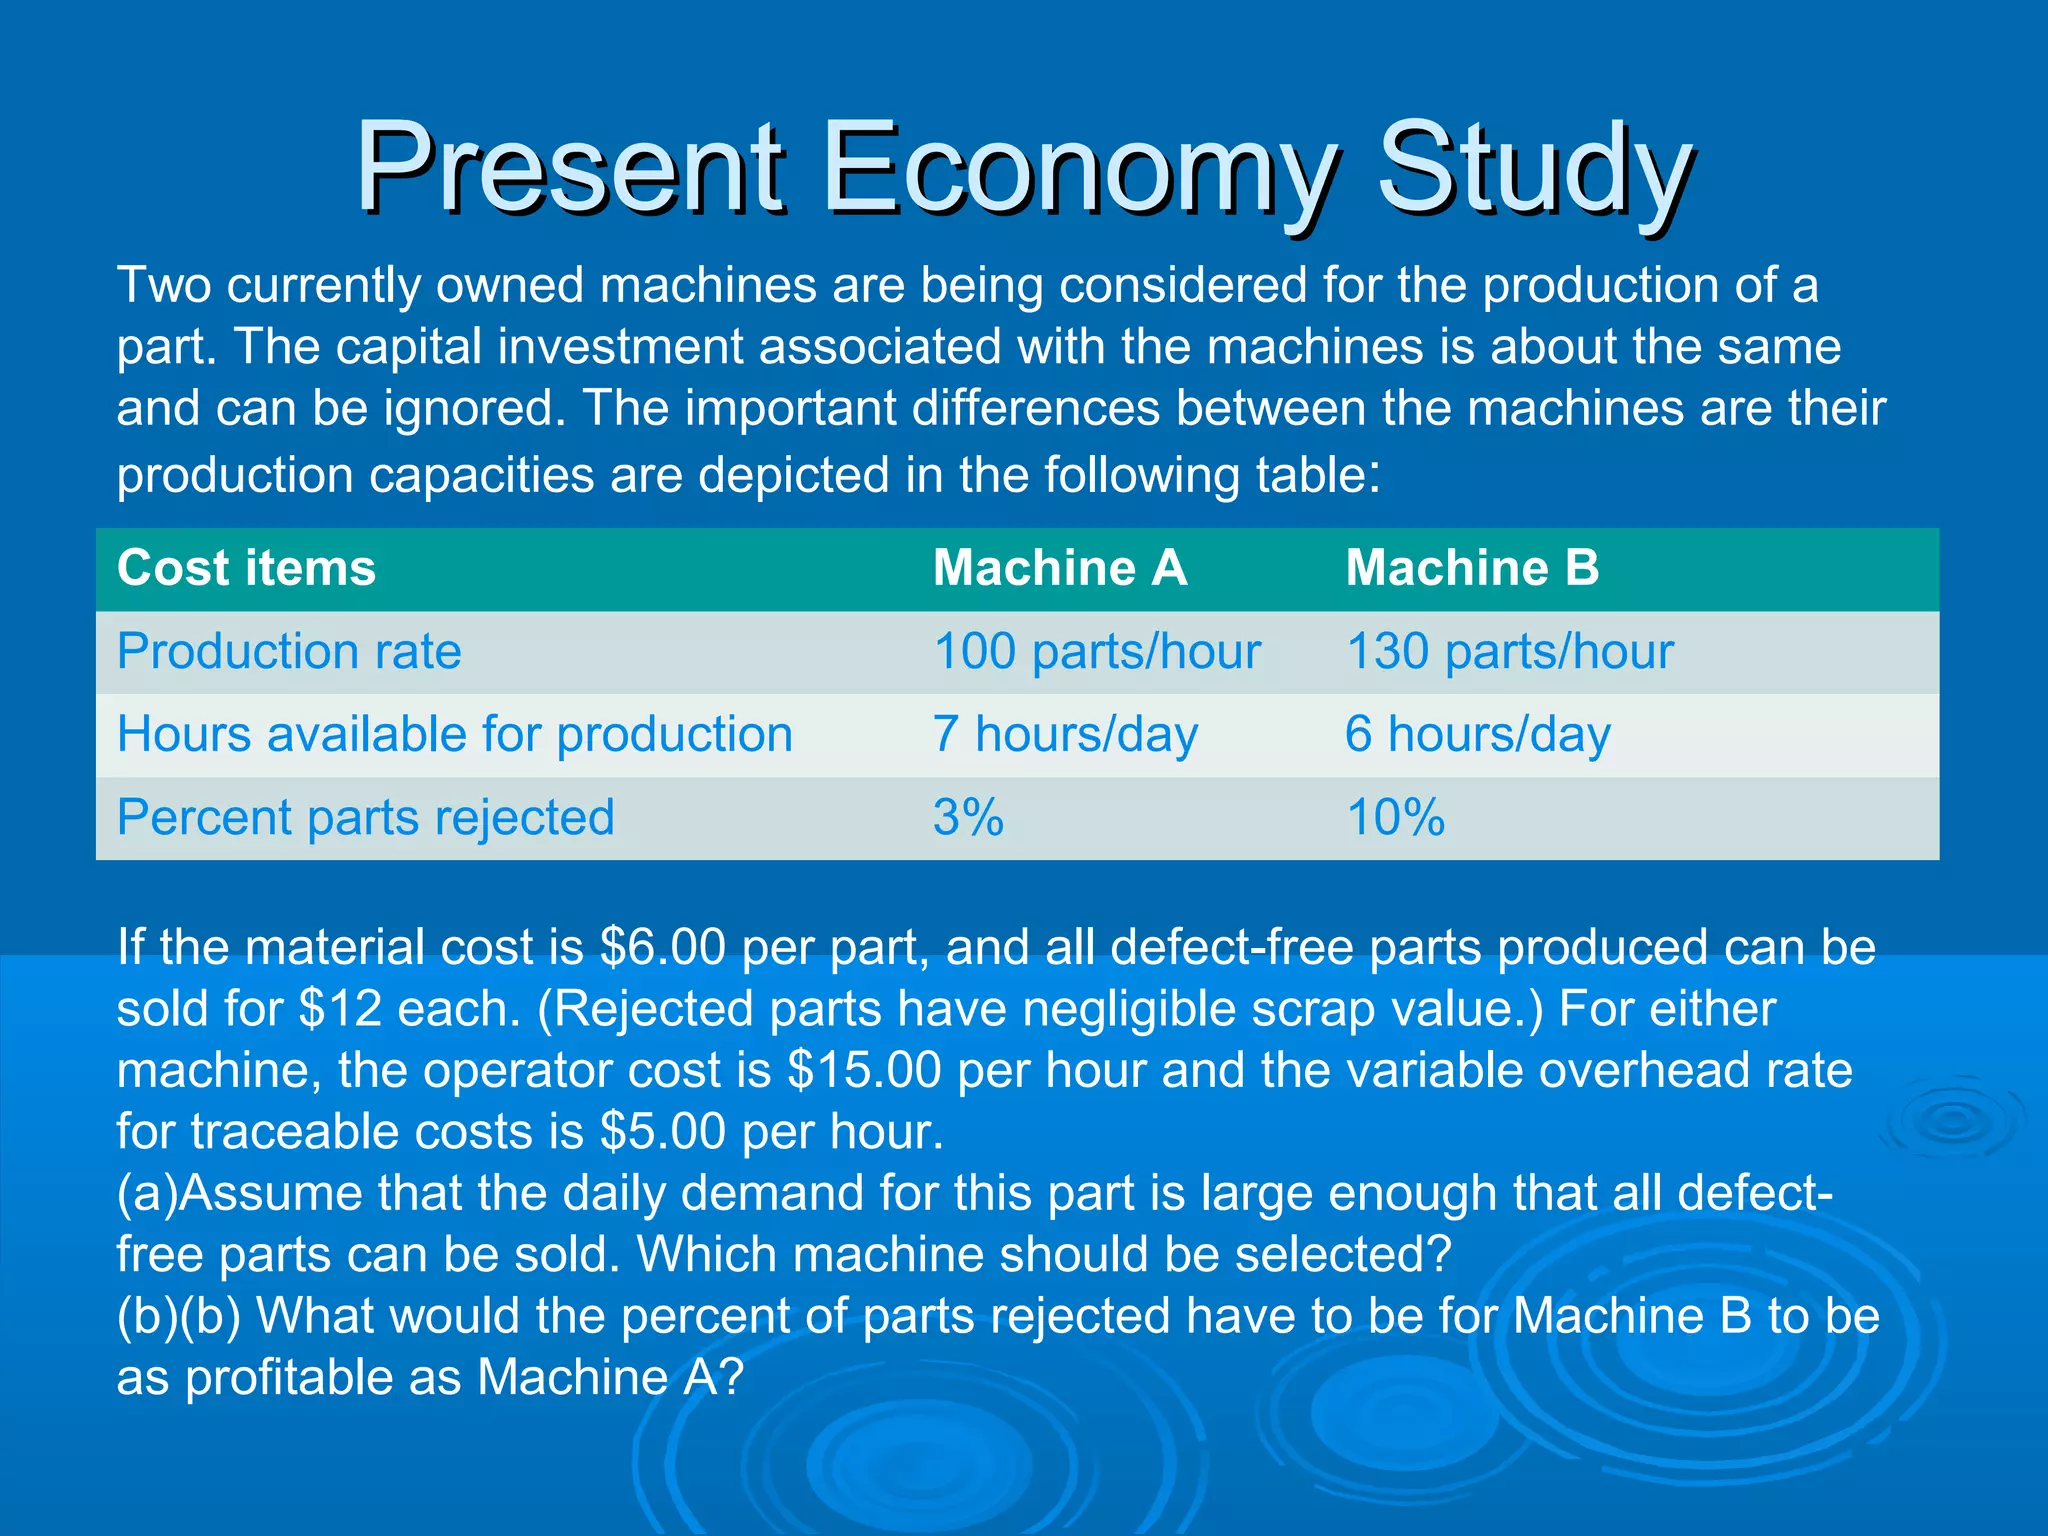
Profit per day = Revenue per day − Cost per day
= (Production rate)(Production hours)($12/part) × [1 − (%rejected/100)] −
(Production rate)(Production hours)($6/part) − (Production hours)($15/hour +
$5/hour).
Machine A:
Profit per day = (100 parts/hour)(7 hours/day )( $12/part)(1 − 0.03) − (100
parts/hour)(7 hours/day)( $6/part) (7 hours day)($15/hour + $5/hour) = $3,808
per day.
Machine B:
Profit per day = (130 parts/hour)(6 hours/day)($12/part)(1 − 0.10) − (130
parts/hour )(6 hours/day)($6/part) (6 hours/day)($15/hour + $5/hour) = $3,624
per day.
Therefore, select Machine A to maximize profit per day](https://image.slidesharecdn.com/chapter2costconcept-150612153659-lva1-app6891/75/Cost-Concept-41-2048.jpg)


