
Recommended
More Related Content
What's hot
What's hot (20)
Similar to Land use-cover-trends-climate-variability-nexus-in-the-njoro-river-catchment
Similar to Land use-cover-trends-climate-variability-nexus-in-the-njoro-river-catchment (20)
More from oircjournals
More from oircjournals (20)
Recently uploaded
Recently uploaded (20)
Land use-cover-trends-climate-variability-nexus-in-the-njoro-river-catchment
- 1. International Journal of Research in Education and Social Sciences (IJRESS) ISSN: 2617-4804 2 (3) 13-24, June, 2019 www.oircjournals.org 13 | P a g e Ontumbi (2019) www.oircjournals.org Land Use/Cover Trends-Climate Variability Nexus in the Njoro River Catchment George Morara Ontumbi Ph. D Candidate Department of Earth Sciences, University of Eldoret Type of the Paper: Research Paper. Type of Review: Peer Reviewed. Indexed in: worldwide web. Google Scholar Citation: IJRESS International Journal of Research in Education and Social Sciences (IJESS) A Refereed International Journal of OIRC JOURNALS. © OIRC JOURNALS. This work is licensed under a Creative Commons Attribution-Non Commercial 4.0 International License subject to proper citation to the publication source of the work. Disclaimer: The scholarly papers as reviewed and published by the OIRC JOURNALS, are the views and opinions of their respective authors and are not the views or opinions of the OIRC JOURNALS. The OIRC JOURNALS disclaims of any harm or loss caused due to the published content to any party. How to Cite this Paper: George, M., O. (2019). Land Use/Cover Trends-Climate Variability Nexus in the Njoro River Catchment.International Journal of Research in Education and Social Sciences (IJRESS), 2 (3), 13-24.
- 2. International Journal of Research in Education and Social Sciences (IJRESS) ISSN: 2617-4804 2 (3) 13-24, June, 2019 www.oircjournals.org 14 | P a g e Ontumbi (2019) www.oircjournals.org Land Use/Cover Trends-Climate Variability Nexus in the Njoro River Catchment George Morara Ontumbi Ph. D Candidate Department of Earth Sciences, University of Eldoret Abstract Anthropogenic activities have consequences on the land use/cover trends in the watershed and subsequently on the hydrological characteristics of rivers through intertwine of climate variability. The interplay between land use changes and climate variability are seen as contributory causes of catchment degradation in Kenya. The land use/cover changes increase impervious ground surfaces, decrease infiltration rate and increase runoff rate thereby affecting the hydrological characteristics of rivers. This study considers the interactions between climate variability and land use/cover changes in the river Njoro catchment in Kenya. The River Njoro drains into the lake Nakuru basin one of the Great Rift Valley Lakes in Kenya. The objectives of the study were: To evaluate the land-use and land cover patterns and changes in Njoro River catchment between 1996 and 2016, analyze the temperature and rainfall variations between 1996 and 2016 and compare the land use/cover changes with the variation in the rainfall and temperature. Landsat images and secondary data on water quality parameters were used in this study. The study showed that there was significant variation in rainfall and temperature trends in the Njoro river catchment and therefore the dynamics of land use/land cover in the river Njoro would be more attributed to anthropogenic activities than climate variability. Introduction The need for environmental sustainability can be achieved through proper resource management. Consequently environmental sustainability has prompted accurate and timely monitoring of land cover/cover alterations and their interactions within the immediate environments to provide information vital for decision making. In Kenya, land cover degradation would be attributed to uncontrolled activities from the up-surging human population. Coupled with lack of appropriate land and water- management strategies, the degradation of land cover is considered to magnify hydrological processes related to surface runoff, soil erosion and sedimentation as observed by Kundu et al., 2008 & Githui et al., 2009). Climate change is affecting almost all countries in the world. It has become one of the biggest environmental challenges and a major concern to society because of its potentially worldwide adverse impacts. There are already increasing concerns globally regarding changes in climate that are threatening to transform the livelihoods of the vulnerable population segments. According to Pacific et al. (20105the earth’s climate has warmed on average by about 0.7°C over the past 100 years with decades of the 1990s and 2000s being the warmest in the instrumental record. There has been global concern that climate change might have negative effects on the economies of countries globally. The negative effects on the economy resulted to the United Nations Framework Convention on Climate Change in 2009 that was held in Copenhagen, Denmark. The Convention encouraged the 37 industrialized countries and the European community to stabilize GHG emissions as they were perceived to be the countries responsible for high levels of emissions compared to other developing countries. Agriculture was considered among the factors that were not responsible for climate change as it contributed far less. Yet, the IPCC Fourth Assessment Report (2007) showed that agriculture directly contributed 13.5 percent of global GHG ARTICLE INFO Received 5th April, 2019 Received in Revised Form 17th May 2019 Accepted on 30th May, 2019 Published online 1st June, 2019 Key Words: Climate Variability, Land Use/Land Cover Water Catchment
- 3. International Journal of Research in Education and Social Sciences (IJRESS) ISSN: 2617-4804 2 (3) 13-24, June, 2019 www.oircjournals.org 15 | P a g e Ontumbi (2019) www.oircjournals.org emissions. Deforestation contributed a further 17 percent and agriculture about one third of global GHG emissions. By 2100, temperature increases are expected to approach 3ºC on the coast and 5ºC in the interior. The greater evaporation rates are expected to increase incidence and intensity of drought in the entire world. The effects on water resources attributed to global climate variations and land use/cover change in the past few years have been of great concern. Weather dynamics is an important variable in the management of water resources. Mogaka et al. (2006) asserted that in Kenya, only about 15% of the safe yield of renewable freshwater resources has been developed. Therefore the level of development of water resources has been low and water supply storage volume per capita has declined dramatically from 11.4 m3 in 1969 to about 4.3 m3 in 1999. This decrease in storage volume per capita is attributed to population growth. Based on current water use efficiencies, it is predicted that aggregate demand will rise by 2020, although this would still be within the country’s safe yield. Thus, the country needs to invest adequately in the water storage capacity, especially due to high rainfall variability and the changing climate. Detrimental effects of climate change include: erratic weather patterns, extreme temperatures, increased meteorological hazards like floods and tsunamis, El Niño, prolonged droughts (La Niña) and rising sea level (Parry et.al. 2007). However despite human beings are natural drivers of climate change, human activities have greatly contributed to increased greenhouse gases which trap heat in the atmosphere, thereby altering the energy balance of the climate system (IPCC 2007). Consequently need arises to undertake studies that will quantify the anthropogenic effects in order to campaign for sustainable use of resources that can help to slow or reverse climate change as observed by Roseland (2012) and therefore need to incorporate LULC studies in investigating climate change. Statement of the Problem The interaction between land use changes and climate variability are potential causes for the changes and alterations of land use in world today. Methodical scrutiny of the land use changes over a given time period will help to give an explanation of new land use changes and their implications on climate change. Anthropogenic distresses are increasingly causing changes in land use and land cover resulting in large areas dominated by crop farming and urban development, which cumulatively contribute to the interference of the hydrological cycle thereby resulting to dynamics in climatic conditions. The dynamics of land use /cover and climate variability have been aggravated by poor packaging of the information without due consideration of the needs and priorities of end-users under different land-use systems as justified by the case study of Njoro river catchment. In some cases within Njoro river catchment, emphasis is made to a single land use system without considering other land-uses and climate variability, yet they coexist as a unit. This would facilitate a shift from passive acceptance of climate variability and related impacts on land use/cover. Hence this study will try to integrate the dynamics of land use/cover and climate variability in the Njoro river catchment by: Evaluating the land-use and land cover patterns and changes in Njoro River catchment between 1996 and 2016, analyzing the temperature and rainfall variations between 1996 and 2016 and finally comparing the land use/cover changes with the variation in the rainfall and temperature quantities in river Njoro catchment between 1996 and 2016. Literature Review Land use/Land cover Many times, “Land use” and “Land cover” are used interchangeably; however each term has a very specific meaning with some fundamental differences. On one hand Land cover denotes the biophysical cover over the land surface which includes: vegetation, urban infrastructure, water and bare soil. Therefore land use does not describe the use of land, which may be different for lands with the same cover type. On the other hand, land use refers to the purpose the land serves, and describes human influence of the land, or immediate actions modifying or converting land cover (Ellis, 2009). Conclusively therefore, Land cover is the "physical state of the earth's surface and immediate subsurface, while land use involves both the manner in which the biophysical attributes of the land are manipulated with the intent underlying that manipulation". Differences may also be made between changes in land cover and changes in land use. Changes in land cover leads to change in cover type where for example forest is converted to pasture, cropland is converted to woodland and agriculture land is converted to urban, and change in cover characteristics. Changes in land use would mean change in land management practices or ownership, intensification, mechanization, irrigation, abandonment, cropping system. Land-use and land-
- 4. International Journal of Research in Education and Social Sciences (IJRESS) ISSN: 2617-4804 2 (3) 13-24, June, 2019 www.oircjournals.org 16 | P a g e Ontumbi (2019) www.oircjournals.org cover change (LULCC) is a general term for the human modification of the earth's terrestrial surface (Ellis, 2010). LULCC modifies surface albedo and thus surface-atmospheric energy exchanges, which have an impact on the regional climate. Since terrestrial ecosystems are sources and sinks of carbon, any change in land-use/cover impact the global climate via the carbon cycle. The contribution of local evapotranspiration to the water cycle as a function of land cover also impacts the climate at a local to regional scale as observed by Lambin et al. (2003). Land-use and land-cover changes are one of the main human induced activities altering the hydrological characteristics of rivers. Land-use changes can also have an important impact on the water quality and energy balance, directly affecting climatic conditions. The impacts of these land-use changes become globally significant through their accumulative effects as observed by Turner et al. (2003). The intense human utilization of land resources has resulted in significant changes of the land-use and land-cover (Baker& Miller, 2013). Disasters from climate/weather related natural phenomena and those occasioned by anthropogenic factors cause land degradation such as deforestation, poor agricultural practices and inappropriate land use systems. Land-use changes are known to have an impact on the hydrology of any catchment area (Bronstert & Bürger, 2002). Deforestation and forest degradation are the most important land-use change processes in the river Njoro catchment. These processes are important threats to the biodiversity and hydrology of Njoro river catchment. In spite of different policies that aimed at reducing logging, recent commercial deforestation, illegal logging, settlement expansion and agricultural expansion pose an important threat to the remaining forested and water catchment areas. Climate variability Environmental changes are attributed to the fact that the natural and artificial earth surface features are in a state of flux. According to Jensen, (2005) the rate of these changes is not uniformly distributed, but depends on the interactions of the biophysical and human components. Some environmental changes largely witnessed today in the developing countries include changes in forest characteristics as a result of human induced deforestation processes, ecological changes due to the need for agricultural expansion and land use/land cover changes due to increased population (Lambin et al., 2003). Olang et al. (2011) observes that in the last couple of years, significant attention has been given to land use and land cover changes, because they form a major component of global changes with greater impact than that of climate change. The land cover has resulted to land cover conversion and modification. According to the intergovernmental panel on climate change (IPCC, 2007) climate variability is occurring and manifested in the intra- and inter-seasonal events such as intense rainfall and prolonged dry spells. Consequently continued climate variability results to climate change. Cruz et al. (2007) defined climate change as variations through increase in frequency and intensity of extreme weather events of storm, flood, drought and irregular rain over time thereby signaling irregular climatic trends. The Intergovernmental Panel on Climate Change (IPCC) Fourth Assessment Report (2007) forecasted that by 2100, the increase in average surface temperature would be between 1.8ºC and 4.0ºC globally (Busisiwe, 2011). The IPCC panel predicted a more pronounced increase in temperatures in the African continent, to be 1.5 times greater than at the global level. According to Tompkins and Adger (2004), climate change is likely to be manifested in four main ways: slow changes in mean climate conditions; increased inter-annual and seasonal variability; increased frequency of extreme events; and rapid climate change causing catastrophic shifts in ecosystems. The potential effects on water resources due to global climate change and land use/cover change in the past few decades have been of great concern. Weather is an important variable in the management of water resources and Mogaka et al. (2006) observes that in Kenya, for example, only about 15% of the safe yield of renewable freshwater resources has been developed. Historic changes in land use have been known to alter the land surface significantly. Since the early 19th century, there has been a substantial increase in the area of cropland in the middle latitudes of the Northern Hemisphere. The pronounced tropical deforestation during the 20th century has paralleled the large-scale development of urban settlements and irrigated agriculture. The land-cover changes have resulted in a number of alterations in the regional and global climate system, primarily by: changing the surface albedo, changing the surface evapotranspiration, modifying winds, heat wave resilience, vulnerability to floods and other such factors in the proximity of human settlements and finally modifying atmospheric carbon dioxide uptake. Decreased forest cover generally increases the surface albedo, thereby reducing the net energy available at
- 5. International Journal of Research in Education and Social Sciences (IJRESS) ISSN: 2617-4804 2 (3) 13-24, June, 2019 www.oircjournals.org 17 | P a g e Ontumbi (2019) www.oircjournals.org the surface. Foley et al. (2005) observed with increasing world population, the demand for food production continues to rise and this has led to significant expansion of areas under agriculture, especially in the tropics. Between 2000 and 2005, DeFries et al. (2010) identified urban population growth and agricultural trade as the main drivers of forest loss in the tropics. Finally Gibbs et al. (2010) estimated that 55% of new agricultural land in the tropics between 1980 and 2000 came from intact forests while a further 28% came from disturbed forests. Land use/cover trends-Climate nexus LULC is essential in order to investigate the effects of climate change, whereby land use plays an important role by influencing the surface-energy budgets and the carbon-cycle effects. Land‐use change is related to climate change as both a causal factor and a major way in which the effects of climate change are expressed. As a causal factor, land use influences the flux of mass and energy, and as land‐cover patterns change, these fluxes are altered. Projected climate alterations will produce changes in land‐cover patterns at a variety of temporal and spatial scales, although human uses of the land are expected to override many effects. Changes in LULC are driven by the need for more energy, food, and other resources to support a growing population, thereby resulting to changing the physical properties of the land surface as observed by Baldyga et al. (2008). The dynamics in LULC in turn, affect the surface albedo properties, which affect the amount of reflected or absorbed energy to the atmosphere. The shrinking of the area under forest cover particularly undermines the ability of ecosystems to regulate climate and air quality, while decreasing carbon sink areas. Climate change is a pertinent issue in the global space due to the adverse effects associated with it, which pose a lot of threat to the existence of man and his environment. Climate change is one of the greatest environmental issues of our time. It is global in its causes but its consequences are far more elaborate in developing countries. Climate change refers to changes in climate overtime, due to natural variability as observed over a time-period or a direct (indirect) human activity which may alter the components of global atmosphere. The interest in land use and land cover is a result of climate variability. Therefore a systematic analysis of local land use changes over a given time frame helps to uncover general principles to provide an explanation of new land use trends and their implications in the catchment degradation. Anthropogenic activities are increasingly causing changes in land use and land cover resulting in landscapes widely dominated by agricultural activities and human settlement which eventually lead to changes in climatic conditions through their effects on the water cycle. Long term degradation of river catchments is triggered by human activities consequently making Kenya vulnerable to experience shortage in water supply. Climate variability leads to changes in precipitation and temperature. In Kenya, the future of sustainable water catchment management is anchored on sound policies of sustainable environmental management. Unsustainable land use practices are major causes of land and water catchment degradation Conceptual framework Fig 3: Conceptual framework of land use/cove-climate variation nexus and likely impacts Land use/cover dynamics would be result of climate variability and vice versa. Rainfall and temperature variation would result to Stress on land evidenced by land use change and land degradation can have adverse impacts on human security. Increasing/decreasing temperatures, higher/lower precipitation variability, due to climate change have the potential of triggering land use/cover dynamics. Consequently one of the interconnections is land and variations in climatic conditions but through human interference of population growth, rapid urbanization, and consequent increasing pressure on ecosystem resources. The Land use/cover dynamics-climate Temperature Variation Water scarcity Drought Seasonal flooding Food crisis Land use change Catchment degradation Rainfall Variation IMPAC
- 6. International Journal of Research in Education and Social Sciences (IJRESS) ISSN: 2617-4804 2 (3) 13-24, June, 2019 www.oircjournals.org 18 | P a g e Ontumbi (2019) www.oircjournals.org variability nexus on extreme would result to Water scarcity, drought, seasonal flooding and food crisis. Justification for the study The Njoro river catchment is the lifeline Nakuru County. The catchment is considered one of the more significant sub catchments of Eastern Mau. The catchment has various land uses/covers which have been greatly modified and changed in the recent past. The dynamics of the land use/cover would be attributed to climate variability. There is growing concern regarding land degradation particularly deforestation in the upper catchment that is affecting the water availability and the river flows. Consequently therefore the study will give the scenario status of climate variability whether attributed to encroachment of the Njoro River catchment and therefore advise on water resource planning and management policy and plan appropriate mitigation measures. Research Design and Methodology The study adopted content analysis and descriptive research designs. Descriptive research was used to discuss land use/cover changes and to describe the relationship between the changes and the climate variability phenomena in the River Njoro catchment. Secondly desktop literature on land use/cover and climate variability was used to supplement the land use/cover and climate variability nexus. The rainfall and temperature data was obtained from Egerton university meteorological station with Rainfall and temperature figures ranging between 1996 and 2016 subjected to graphical and tabular presentations. The Njoro topographical map of 1:50,000 scale was used to delineate and digitize the study area. The images for 1996, 2006 and 2016 of the scene of River Njoro catchment were employed to come up with a land use and cover analysis of 1996 to 2016. The period 1996 to 2016 is significant in the Njoro catchment because this is the period when eastern Mau witnessed encroachment of the forested area resulting to mushrooming of urban and rural settlement in areas that were formerly covered by forests. The imagery classification in this study was based on Earth Resources Data Analysis System (ERDAS) and Landsat images for the respective years. The images were first classified to define the land use types of the study area. The land use types represented by the various classes were identified. Supervised classification using maximum likelihood algorithm was adopted using 6 land use/cover categories based on the information from Landsat images and available maps of the area. Study Area The study area in this study is defined as the area covered by the catchment of river Njoro in the Lake Nakuru catchment as shown in figure 1. The River Njoro is located in Nakuru County in the former Rift Valley Province in Kenya. River Njoro originates at an elevation of about 3,000 m above sea level in the Eastern Mau Escarpment and descend in a northeast direction before terminating at Lake Nakuru on the floor of the Rift Valley at about 1,800 m above sea level. The River Njoro catchment is part of the larger Lake Nakuru catchment, and one of the rivers originating from the Eastern Mau forest of the Mau Complex and draining into the Lake Nakuru. The River Njoro catchment is a high potential area and is under intensive cultivation. The forested hill slopes of the catchment have undergone extensive deforestation, which has led to increased soil erosion, low recharge and remarkable fluctuation in stream flows. The River Njoro Watershed covers approximately 280 km2 (Enanga et al., 2011). The River Njoro watershed is located Kenya’s southwestern Rift Valley at 0°30' South 35°20' East whereas the river itself is approximately 50 km in length. The Njoro Watershed constitutes a critical water source for Lake Nakuru; a large shallow saline lake designated a Ramsar wetlands site of international importance. Results and Discussion The land cover/land use categories that were identified include; forests, agriculture, commercial, residential and shrub land. Table 1: Land Use/Land Cover Changes in the River Njoro Catchment LAND USE/COVER CLASSES 1995 (Ha) 2008 (Ha) 2016 (Ha) Increase/Decrease FOREST 10158.04 9686.41 7052.85 Decrease AGRICULTURE 8595.43 9005.23 8660.17 Increase RESIDENTIAL 3136.1 3460.05 5771.55 Increase COMMERCIAL 1545.21 1618.65 2673.57 Increase SHRUBLAND 2492.33 2129.04 1771.46 Decrease WATER 1026.27 1054 1023.78 Decrease TOTAL 26953.38 26953.38 26953.38
- 7. International Journal of Research in Education and Social Sciences (IJRESS) ISSN: 2617-4804 2 (3) 13-24, June, 2019 www.oircjournals.org 19 | P a g e Ontumbi (2019) www.oircjournals.org The areas of different land uses/ land cover as calculated were found to range from 37.68% and 3.8% in forest and water body, respectively (Table 1). Water body was found to have the smallest area probably because river classification was difficult since water was not visible but the riparian vegetation marked river’s route. Additionally natural forests, secondary forest, and the agro forests were not separated in this study which could be associated with the higher percentage of forest cover. On the other hand, agriculture is the main economic activity within the study area. The results from the land sat images indicate that the area under: forest, scrubland and water reduced between 1995 and 2016 while the area residential settlement, commercial and agriculture reduced within the years. Figure 1: Land use/cover of river Njoro catchment (1996) Source; Author Figure 2: land use/cover of river Njoro catchment (2016). Source; Author
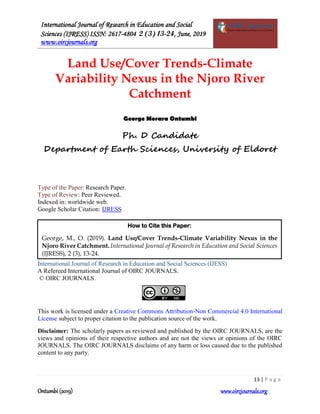
- 8. International Journal of Research in Education and Social Sciences (IJRESS) ISSN: 2617-4804 2 (3) 13-24, June, 2019 www.oircjournals.org 20 | P a g e Ontumbi (2019) www.oircjournals.org Figure 3; mean annual temperature at Egerton University meteorological station 0 200 400 600 800 1000 1200 1400 1600 1800 TOTALRAINFALL(MM) YEARS TOTAL ANNUAL RAINFALL 1996-2016
- 9. International Journal of Research in Education and Social Sciences (IJRESS) ISSN: 2617-4804 2 (3) 13-24, June, 2019 www.oircjournals.org 21 | P a g e Ontumbi (2019) www.oircjournals.org Temperature rainfall trends 18 18.5 19 19.5 20 20.5 21 21.5 22 1996 1997 1998 1999 2000 2001 2002 2003 2004 2005 2006 2007 2008 2009 2010 2011 2012 2013 2014 2015 2016 MEANANNUALTEMPERATURE(oc) YEARS MEAN ANNUAL TEMPERATURE
- 10. International Journal of Research in Education and Social Sciences (IJRESS) ISSN: 2617-4804 2 (3) 13-24, June, 2019 www.oircjournals.org 22 | P a g e Ontumbi (2019) www.oircjournals.org The rainfall from the Njoro University meteorological station showed that the rainfall received in the years 1999, 2000. 2005 and 2009 was less than 1000mm while all the other years between 1996 and 2016 received more than 1000mm p.a. However the years 2003, 2004 and 2010 received higher rainfall with the highest of 1600 mm received in 2010. On the other hand the highest mean annual temperature was experienced in the years 2015 and 2009. But all the other year between 1996 and 2016 received moderate average annual temperature of about 200 c. Conclusively therefore the River Njoro catchment did not experience extreme climate variability between 1996 and 2015. The land use/cover changes climate variation- nexus in the river Njoro catchment between 1996 and 2016 Table 2 shows the land use/cover changes and the average annual rainfall and temperature in the river Njoro catchment between 1996 and 2016. The percentage area of each class in 1996 and 2016 showed that the area under forest and scrubland decreased significantly by 12% and 6% respectively while the area under residential, agriculture and commercial significantly increased by between 4 and 13% of the total LULC categories assigned. However during the period between 1985 and 1995 the Njoro catchment didn’t experience significant variation in the average annual rainfall and temperature. Conversion of forest to agricultural land settlement was also significant. The data would suggest that the increase in deforestation would have been due to increase in agricultural land. Therefore if deforestation continues the Njoro river catchment is bound to face the negative impact of soil erosion, high temperature finally the negative impacts would further lead to climatic changes. Table 2: Land use/cover changes and the Average annual rainfall and temperature in the Njoro river catchment YEAR LAND USE/COVER AREA(Ha) EFFECT AVER. ANNUAL RAINFALL AVER. ANNUAL TEMP 1985-1996 Forest 9746 35.09% (D) 946.5 mm/a 233.60 c Agriculture 8595 30.95% (D) Residential 4991 17.97% (I) Commercial 1517 5.46% (I) Scrubland 2924 10.52% (D) 1996-2006 Forest 7141 25.71% (D) 1017.47 mm/a 236.90 c Agriculture 9505 34.22% (I) Residential 7022 25.28% (I) Commercial 2183 7.86% (I) Scrubland 1922 6.92% (D) 2006-2016 Forest 6403 23.05% (D) 1164.95 mm/a 242.00 c Agriculture 8760 31.54% (D) Residential 8755 31.52% (I) Commercial 2581 9.29% (I) Scrubland 1274 4.59% (D) Conclusion The changes in LULC revealed competing land uses, particularly involving forest, agriculture and residential and commercial settlement. Comparing the LULC changes to rainfall and temperature trends, the loss of green cover had insignificant relationship. The wanton destruction of Njoro river catchment over time has alike hood of triggering climate change with negative impacts such as; frequent cyclic droughts, rising temperatures, reduced water levels, erratic rainfall and destructive floods. Therefore there is serious need to adopt The ‘Greening Kenya’ programme which is projected to establish between 30,000 – 40,000 Ha of forests by 2022 and increase forest cover from 7% to 10% as recommended by United Nations Environment Programme (UNEP) This study revealed that there was increase of area under settlement and commercial between 1986 and 2016. This value signified the dramatic land cover change on the category of built up surface exerting an incredible pressure on non-built up surfaces particularly forests and scrubland. Expansion of the
- 11. International Journal of Research in Education and Social Sciences (IJRESS) ISSN: 2617-4804 2 (3) 13-24, June, 2019 www.oircjournals.org 23 | P a g e Ontumbi (2019) www.oircjournals.org already existing urban centers through rapid construction sites of residential units, commercial and road networks all combined together led to continuous expansion of built up surfaces in the different corners of the Njoro river catchment. However despite the great changes in land use/cover changes in the Njoro river catchment the annual rainfall and average annual temperature didn’t show significant variations between 1985 and 2016. The forested and large-scale farm areas have been converted mainly into small- scale mixed agriculture and human settlements and this is manifested by the significant increase in the area under settlement while the area under forest has significantly reduced. Conclusively the dynamics of land use/land cover in the river Njoro would be more attributed to anthropogenic activities than climate variability. And therefore in the words of Prof Wangari Maathai, “I have been trying to convince others in government and in the community that we need to stop cutting or cultivating crops in our indigenous forests (Maathai, 2011). When the forests are cleared, rivers and streams dry up, biodiversity is lost, and rainfall becomes erratic. This threatens farmers’ livelihoods and has negative impacts on other species as habitats and the water catchment areas are lost.” Further Prof. Maathai asserted, “I keep telling people, let us not cut trees irresponsibly...especially the forested mountains. Because if you destroy the forests, the rivers will stop flowing and the rains will become irregular and the crops will fail and you will die of hunger and starvation. Now the problem is, people don't make those linkages” (The Green Belt Movement Watershed Workshop). References Baldyga, T. J., Miller, S. N., Driese, K. L., & Gichaba, C. M. (2008).Assessing Land Cover Change in Kenya's Mau Forest Region using Remotely Sensed data. African Journal of Ecology, 46(1), 46-54 Baker, T. J., & Miller, S. N. (2013). Using the Soil and Water Assessment Tool (SWAT) to assess land use impact on water resources in an East African watershed. Journal of hydrology, 486, 100-111. Bronstert, A., Niehoff, D., & Bürger, G. (2002). Effects of Climate and Land‐use Change on Storm Runoff generation: Present Knowledge and Modelling Capabilities. Hydrological Processes, 16(2), 509-529. Busisiwe, M. (2011). Impact of Climate Change and adaptation on Cattle and Sheep Farming in the Eastern Cape Province of south Africa Doctor of Philosophy Environmental Management University of South Africa DeFries RS, Rudel TK, Uriarte M, Hansen M. 2010. Deforestation Driven by Urban Population Growth and Agricultural Trade in the Twenty-First Century. Nature Geoscience 3: 178 –181. Ellis, E., (2010). Land-use, In Encyclopedia of Earth.Eds. Cutler J. Cleveland, Washington, D.C.236 Ellis E., (2009). Land-cover, In Encyclopedia of Earth.Eds. Cutler J. Cleveland, Washington, D.C. Tompkins, E. and Adger, W. (2004). Does Adaptive Management of Natural Resources Enhance Resilience to Climate change? Ecology and Society, 9 (2), 10. Enanga, E.M & W. A. Shivoga, W. A, Maina, C. G & I. F. Creed, (2014).Observing Changes in Riparian Buffer Strip Soil Properties Related to Land Use Activities in the River Njoro Watershed, Kenya. Water Air Soil Pollut DOI 10.1007/s11270-010-0670 Foley, J. A, DeFries R, Asner GP, Barford C, Bonan G, Carpenter SR, Chapin FS, Coe MT, Daily G.C., Gibbs Helkowski J. H, Holloway T, Howard EA, Kucharik CJ, Monfreda C, Patz, J. A, Prentice I.C, Ramankutty N, Snyder PK. 2005. Global consequences of land use.Science 309: 570–574. Gibbs HK, Ruesch A.S, Achard F., Clayton M.K, Holmgren P, Ramankutty N, Foley JA. (2010). Tropical Forests were the Primary Sources of new Agricultural land in the 1980s and 1990s. Proceedings of the National Academy of Sciences 107: 16732– 16737. Intergovernmental Panel on Climate Change (IPCC) (2007). Impacts, Adaptations and Vulnerability. Fourth Assessment Report. Cambridge University Press, Cambridge, UK. Jensen, J. R., 2005. Introductory Digital Image Processing: A Remote Sensing Perspective (3rd edition). Prentice Hall series in geographic information science. Upper Saddle Lambin, E. F., & Geist, H. J. (Eds.). (2008). Land-use and Land-cover Change: Local Processes and global Impacts. Springer Science & Business Media. Lambin, E.F., H.J. Geist, and E. Lepers, (2003). Dynamics of land –use and Land-cover Change in Tropical Regions, Annu. Rev. Environ. Resource, 28:205–41. Li, C. and Huu N.N. (2007).Climate Change: Impacts, Adaptation and Vulnerability. Contribution of Working Group II to the Fourth Assessment Report of the Intergovernmental Panel on Climate Change, Asia. Kundu P. M., Chemelil M.C., Onyando J. O and Gichaba M. (2008). The Use of GIS and Remote Sensing to Evaluate the Impact of Land Cover and Land Use Change on Discharges in the River Njoro
- 12. International Journal of Research in Education and Social Sciences (IJRESS) ISSN: 2617-4804 2 (3) 13-24, June, 2019 www.oircjournals.org 24 | P a g e Ontumbi (2019) www.oircjournals.org Watershed, Kenya. Journal of World Association on Soil Water Conservation J2: 109–120. Maathai, W. (2011). Challenge for Africa. Sustainability Science, 6(1), 1-2. Mogaka, H., S. Gichere, R. Davis and R. Hirji. (2006). Climate Variability and Water Resources Degradation in Kenya Improving- Water Resources Development and Management. World Bank Working Paper No. 69. IPCC, 2007; Summary for Policy Makers in Climate Change 2007: Impacts, Adaptation and Vulnerability Contributions of Working Group II to the Fourth Assessment Report of the Intergovernmental Panel on Climate Change. Palutikof, P.J. Van der Linden and C.E Hanson (ed) Cambridge, Cambridge University Press 1000 Olang, L. O., & Fürst, J. (2011). Effects of Land Cover Change on Flood Peak Discharges and Runoff Volumes: Model estimates for the Nyando River Basin, Kenya. Hydrological Processes, 25(1), 80-89. Ott, B., &Uhlenbrook, S. (2004). Quantifying the Impact of Land-use Changes at the Event and Seasonal Time Scale Using a Process-Oriented Catchment Model. Hydrology and Earth System Sciences Discussions, 8(1), 62-78. River, NJ, USA Pacifici, M., Foden, W. B., Visconti, P., Watson, J. E., Butchart, S. H., Kovacs, K. M. & Corlett, R. T. (2015). Assessing species Vulnerability to Climate Change. Nature climate change, 5(3), 215. Roseland, M. 2012. Toward Sustainable Communities: Solutions for Citizens and their Governments (4.Ed). Gabriola Island, BC: New Society Publ. Shivoga, W.A., Mucai M., Kibichi, S., Odanga, J., Scott N. M.,Tracy J. B., Enanga, E. M and Gichaba, C. M (2007); Influences of land use/cover on water quality in the upper and middle reaches of River Njoro, Kenya. Lakes & Reservoirs: Research and Management 2007 12: 97–105 Tompkins, E. L., & Adger, W. N. (2004). Does Adaptive Management of Natural Resources Enhance Resilience to Climate Change? Ecology and Society, 9(2). Turner, R. E. and Rabalais, N. N. (2003): Linking landscape and Water Quality in the Mississippi River Basin for 200 years. Journal of Bioscience, 2(53): 563-572