2. 308 D. Copetti et al.
research studies carried out world-wide. This temperature increase is first responsible
for a general increase of the water column stability and for a reduction of the mass
transfer between deep and surface waters with direct implications on the oxygen
and nutrient cycles. The magnitude of the temperature increase is also sufficient to
impact on the growth of phytoplankton populations and it is likely one of the con-
current causes promoting the massive cyanobacteria blooms, recently detected in
the two Italian case studies and in different lake environments in Europe. Section 10.2
approaches the problem of establishing a methodology to estimate the average
yearly nutrient (phosphorus and nitrogen) river loads under present climate condi-
tions and under the forcing of climate change. The case study is the Po River the
largest hydrological basin in Italy and the third tributary of the Mediterranean semi-
enclosed basin. The methodology developed in this study is based on a hierarchy of
different numerical models which allowed to feed the MONERIS model (MOdeling
Nutrient Emissions into River System) with the necessary meteorological and
hydrological forcing. MONERIS was previously calibrated (1990–1995) and vali-
dated (1996–2000) under past conditions and then run under current conditions to
define a control experiment (CE). Current nutrient loads have been estimated in
170,000 and 8,000 t year−1
respectively for nitrogen and phosphorus. Approximately
70% of the nitrogen load is from diffuse sources while 65% of the phosphorus load
originates from point sources. Nutrient loads projections at 2100 (under different
IPCC scenarios) allowed to estimate that both nitrogen and phosphorus loads are
strictly dependent on the resident population which is responsible of a 61 and 41%
increase respectively for nitrogen and phosphorus. Projected nutrient load varia-
tions were found to be negligible when holding the resident population constant.
Finally the phosphorus load is markedly influenced by the efficiency of the waste
water treatment plants (WWTPs).
Keywords Lake temperature • Downscaling • Deterministic models • Nutrient
loads • River catchments
10.1 Impact on Lake Thermal Structure and Ecological
Consequences
10.1.1 Introduction
10.1.1.1 Global Importance of Lakes as Valuable Fresh Water Resource
Lakes are an important component of the water cycle and a prominent resource of
water, world-wide used for drinking supply, irrigation, industrial and recreational
uses (Wetzel 2001). The majority of readily-accessible water resource is contained in
lakes of small size and volume (International Lake Environment Committee Founda-
tion www.ilec.or.jp/wwf/eng). Despite their importance as freshwater resources the
3. 30910 Impacts of Climate Change on Water Quality
exact number of lakes in the world and their total volume is not yet known. This
makes difficult to quantify the contribution of lakes to the total amount of freshwa-
ter and thus to reckon possible future trends on lake water availability.
At the global extent, Downing et al. (2006) estimate a number of 3.04·108
natural
lakes with surface area less than or equal to 4.2·106
km2
, with the most of the envi-
ronments having surface area less than 1 km2
. The total surface covered by lentic
freshwaters, including artificial lakes, is of the order of 4.6·106
km2
which is more
than 3% of the earth’s continental surface.
In Europe more than 500,000 natural lakes are larger than 0.01 km2
(http://www.
eea.europa.eu/themes/water/european-waters/lakes). About 80–90% of them are
small with a surface area between 0.01 and 0.1 km2
, while only around 16,000
exceed 1 km2
. Three quarters of the European lakes are located in Norway, Sweden,
Finland and in the Karelo-Kola region (Russia) where they account for approxi-
mately 5–10% of the respective national surface. The total European lake area is
about 200,000 km2
, corresponding to approximately 2% of the continental surface.
In the Mediterranean region dams represents the most important resource devoted
to water supply. In Egypt, for example, the availability of freshwater is largely
dependent by the dam of Aswan, whose catchment is fed by waters from central
Africa, a region highly sensitive to climate change (Dumont 2009).
In Italy 891 freshwater lakes larger than 0.01 km2
(65% natural) have been
identified. 296 are larger than 0.2 km2
(Tartari, LIMNO Project unpublished data)
and are mainly (about 82%) distributed in the northern part of the Peninsula. The
lake surface covers 1,821 km2
, around 0.6% of the national surface area. This per-
centage is approximately one fifth of that related to the earth system (3%), in agree-
ment with the relatively dry climate in South Europe. The total volume of the
Italian freshwater lakes is more than 151 km3
, which is of the same order of mag-
nitude of running waters in the national hydrological budget (155 km3
, IRSA 1999),
underling the relative importance of lentic environments in terms of water avail-
ability in Italy.
Currently the scientific community agreed that global warming is strongly
impacting on lacustrine environments and that these impacts are abruptly changing
the ecosystems structure (Schindler 2001). Although changes on the lake water
quantity and quality lead to socio-economic and environmental impacts our knowl-
edge on the possible consequences of these changes is still poor, limiting our capa-
bility of adaptation or mitigation (Salmaso and Mosello 2010).
10.1.1.2 Lakes and Global Change: Passive and Active Role
Among other surface aquifers, lakes are particularly vulnerable to changes in climatic
conditions (Bates et al. 2008). Climate modifications can directly cause changes in
the hydrological balance and impact on the physical, chemical and biological com-
partments, with implications on the lake water quality (Schindler 2001). These
impacts are expected to be stronger in water bodies located in high elevated area, at
high latitudes and in semiarid regions (Bates et al. 2008).
4. 310 D. Copetti et al.
The main direct effects of climate change on lake waters are driven by the rising
of temperature, the variability of precipitation and by the changes in the regional
solar radiation budget. The latter is intimately connected with the presence of aero-
sols in the low atmosphere (Yu et al. 2006), which can modify both short and long
wave adsorption at the air-water interface, with implication on the physical, chemi-
cal and biological processes (Miller et al. 2004) and particularly on the biogeo-
chemical cycles of nutrients (Zepp et al. 2007).
Globally the pattern of precipitations evidences a non-uniform increase of
about 2% since the beginning of the twentieth century (Eisenreich 2005). Future
increases are projected at high latitudes and in most tropical areas, while precipi-
tations at subtropical latitudes are expected to decrease (Bates et al. 2008).
Variations in the precipitation patterns can modify the regional distribution of
lakes as reported by Downing et al. (2006), which found a significant relationship
between the lakes distribution and the amount of precipitations. Increasing weath-
ering of nutrients from the catchment is also expected to impact on the external
nutrient loads (Eisenreich 2005). According to IPCC (Bates et al. 2008) at present
no consistent trend in lakes levels has been found at the global scale. Variations in
different parts of the world have been, rather, related to the combination of the
effects of drought, warming and human activities. Similarly changes in the ice
cover are not expected to impact significantly on the lake water levels in the
Mediterranean region, with exception for the alpine natural and artificial lakes
(Bates et al. 2008).
The variation of the average global temperature has been estimated (IPCC 2007)
in 0.76 +/− 0.19°C for the period from 1850 to 1899 to 2001–2005. Increasing lake
water temperature has been observed in Europe (Ambrosetti and Barbanti 1999;
Tartari et al. 2000; Livingstone 2003; EEA 2008), North America (Coats et al. 2006)
and North Africa (Verburg et al. 2003). This trend is of fundamental importance not
only for the direct hydrodynamic implications, such as vertical and horizontal mix-
ing (Peeters et al. 1996; Hodges et al. 2000), but also for the indirect consequences
on the biological communities (see MacIntyre and Melack 1995 and below).
The increase in atmospheric temperature detected over the twentieth century
has been shown to determine a secular increase of water temperature at all depths
in Lake Zurich (Livingstone 2003) leading to a 20% increase in thermal stability
and a consequent extension of 2–3 weeks in the stratification period. Similar
results have been described for the Italian Deep Southern subalpine Lakes (DSL:
Garda, Iseo, Como, Lugano and Maggiore). Here Ambrosetti and Barbanti (1999)
found a progressive increase in the heat content of deep waters of Lake Maggiore
(and of the other DSL) which has been related to large-scale climatic fluctuations
controlled by the on going process of climate change. Modifications of the water
column circulation/stratification cycle and reduction of the mixing depth at maxi-
mum winter overturn were also detected for DSL between 1970 and 1999
(Ambrosetti and Barbanti 1999). A long-term (1970–2010) data series analysis
reported in Salmaso and Mosello (2010) allowed to estimate an increase in water
temperature (at maximum spring overturn) between 0.011 and 0.021°C year−1
for
5. 31110 Impacts of Climate Change on Water Quality
DSL, which was very close to the warming rate (between 0.015 and 0.030°C year−1
)
found in other large lakes in Europe (Livingstone 2003) and North America (Coats
et al. 2006).
Lake warming has different implications for the ecology of lacustrine environ-
ments. The progressive increase of the water column stability is leading to a reduc-
tion of mass exchange between surface and deep layers and to the expansion of the
anoxic/hypoxic layer in productive environments (Verburg et al. 2003) and in turn
to an increase of the nutrient release from sediments (Bström et al. 1988; Salmaso
et al. 2003; Ambrosetti et al. 2010). Globally the impact of lake warming is expected
to enhance many biogeochemical processes and to exacerbate the process of eutro-
phication (Schindler 2001) or to promote eutrophication-like response (Visconti
et al. 2008).
Recent investigations have underlined biological alterations, induced by
global warming, affecting the structure and functioning of lake ecosystems
(Eisenreich 2005). As the most of the physiological (e.g. growth rate) and bio-
chemical (e.g. nutrient uptake and excretion) processes are temperature depen-
dent a general increase of the lake water temperature is expected to act on all
nodes of the trophic web (Schindler 2001). Focusing on the first node, recent
papers suggest a shift in the phytoplankton phenology with an extension of the
growing season allowing phytoplankton to bloom earlier in spring and later in
autumn (Thackeray et al. 2008). Together with the extension of the growing sea-
son, changes in the phytoplankton assemblages have been also detected (Elliott
et al. 2005). These changes seem to be particularly pronounced in spring due to
the combined effect of major nutrient availability and increased water tempera-
ture. Finally different research (Elliott et al. 2005; Thackeray et al. 2008) found
that the earlier nutrient uptake in spring is reducing the summer phytoplankton
blooms as a consequence of nutrient deficit.
Recent studies suggest that lakes may not just passively react to a changing cli-
mate but also play an active role in the climate modification from the sub-regional
to the global scale. At the regional scale it has been recognized that large lakes exert
considerable influences on the regional climate with particular reference to the heat
and moisture budget (León et al. 2007). At the global scale is now accepted that
lakes play a role comparable to that of oceans in the total carbon budget (Einsele
et al. 2001). This is due to their higher productivity which compensates the much
smaller volume. Lacustrine environments directly affect the greenhouse gas con-
centrations in the atmosphere through two distinct ways. They can, indeed, operate
both as carbon sink, entrapping carbon within sediments, and as carbon sources
releasing carbon dioxide (Algesten et al. 2005) and methane (Bastviken et al. 2004)
at the lake surface.
The aim of this contribution is to describe a model exercise carried out within the
CIRCE project aiming at simulating variations in the thermal structure of two
Northern Italian lakes over the period 1953–2050. The hydrodynamic model used in
this study has been fed with data from Regional Earth System scenarios developed
within CIRCE. Lake temperature projections were interpreted in the light of their
6. 312 D. Copetti et al.
possible influences on the lake ecology with particular emphasis on the proliferation
of potentially toxic cyanobacteria species, one of the major on-going lake water
deterioration problems.
10.1.2 The CIRCE Approach to the Climate Change Impact
on Lakes
10.1.2.1 Study Sites
The impact of the incoming climate warming has been studied onto two Italian
South alpine lakes: Lake Como and Pusiano (Fig. 10.1). Lake Como is the deepest
(425 m) Italian lake with a surface area of 145.5 km2
and a volume of 22,500·106
m3
.
The principal inflow to the lake is the Adda River, which enters the lakes in the
North basin and leaves from the South-East arm (Fig. 10.1). Lake Pusiano is an
inter-morainic lake, located between the two branches of Lake Como (Fig. 10.1).
It is a mid-size natural lake (volume=69.2·106
m3
) with surface area of 5.26 km2
and
Fig. 10.1 Lake Como and Pusiano catchments (black line) and lake profiles (grey surface) within
the Mediterranean Region. Black dots indicate Regional Earth System (RES) nodes of interest for
the present study
7. 31310 Impacts of Climate Change on Water Quality
maximum depth of around 24 m. The principal inflow of Lake Pusiano is the Lambro
River. The catchment area of Lake Como and Pusiano covers respectively 4,524 and
94.6 km2
. Based on the thermal behavior Lake Como is classified holo-oligomictic
as it undergoes to complete overturn only in cold and windy winters (Ambrosetti
and Barbanti 1999). Lake Pusiano, by contrast, is monomictic and circulates once a
year in winter (Copetti et al. 2006).
Lake Como is a fundamental multiple-uses resource of water for the Lombardy
Region. Its waters are directly devoted to drinking supply (90% of the city of Como),
recreational and industrial activities. The waters from its outflow are also used to
feed the agricultural crop of the Lombardy Plain. Lake Pusiano, instead, is princi-
pally used for recreational purposes. Both environments are valuable resources from
an environmental, aesthetic and economic point of view.
10.1.2.2 Diagnostic Tools
Hydrodynamic long term simulations were performed using the Dynamic Reservoir
Simulation Model (DYRESM) developed by the Centre for Water Research
(University of Western Australia). DYREMS is a pseudo two-dimensional hydrody-
namic model used to simulate salinity and temperature in lakes and reservoirs over
timescales of days to decades (Rinke et al. 2010). The model architecture consists
of a vertical stack of Lagrangian layers that split and merge in response to external
forcing. The model involves process-based routines to simulate the mechanisms of
heat and mass atmospheric transfer, density stratification, vertical mixing and inflow
dynamics reporting these effects in a one-dimensional array.
DYRESM simulations are initialized through a salinity and temperature profile
and require both meteorological and hydrological data input. For the Lake Como
and Pusiano applications, meteorological forcing were downscaled from a Regional
Earth System model developed within CIRCE. Meteorological (daily average val-
ues) data include: air temperature, short and long wave radiation, vapor pressure
wind speed and rainfall. Thanks to their proximity (Fig. 10.1) the same meteoro-
logical forcing were applied to both environments. Hydrological data encompass
daily discharge, daily average water temperature and salinity for the principal
inflows and daily discharge for the principal outflows to the lake. Daily inflow rates
were derived from a precipitation/discharge relationship specific for each lake
catchment area obtained by historical dataset related to the Lake Como (Laborde et
al. 2010) and the Lake Pusiano (Copetti et al. 2006) basins.
Model interactions and data flux in this study are reported in Fig. 10.2. The
Global Circulation Model (GCM, ECHAM5-MPIOM) forces the Regional Earth
System (RES, PROTHEUS; Artale et al. 2010) model which is used to feed the local
Impact Study Model (ISM, DYRESM). The objective of the intermediate downscal-
ing (DSC) step is to correct RES output for local biases (mainly due to the raw
approximation of land use and topography in RES) and thus obtain realistic meteo-
rological forcing for local impact studies.
8. 314 D. Copetti et al.
A full description of the statistical approach used in local impact research is
described in the Chap. 9 of Part II of this book, to which the reader is referred for
methodological details. In general terms the downscaling technique applied in this
study consists in a variable correction method based on the estimation of the inverse
of the Cumulative Distribution Function (CDF) or quantile function (Déqué 2007).
The quantiles are estimated for both a reference dataset and a RES simulation.
The comparison of the two inverse CDF allows to define a Quantile-Quantile (Q-Q)
algorithm which is used to correct the simulated variable, so that the CDF of the
post processed simulation is exactly the same as the CDF of the reference. In this
study the Q-Q algorithm was estimated by comparing ground station data series
(reference) with the RES forced by ERA40 (1958–1999) reanalysis (hind-cast sim-
ulation). The Q-Q algorithm was then applied to both control (20c=1953–2000)
and future scenario (A1b=2001–2050) GCM simulations to filter out the local
systematic biases of the RES. The application of this technique has two principal
advantages: first it preserves the temporal and spatial dynamics of the GCM projec-
tions and second it enhances the comparability between future scenario and control
simulations, as both time series has been downscaled with the same algorithm.
To improve the robustness of the statistical approach the Q-Q algorithms were
computed at seasonal time scale using the maximum available observed data over
the control simulation time windows.
Fig. 10.2 Model interactions and flux of data from the Global Circulation Model (GCM) to the
Impact Study Model (ISM). Hind-cast ERA40 (1958–1999), Control 20c scenario (1953–2000),
Scenario A1b scenario (2001–2050)
9. 31510 Impacts of Climate Change on Water Quality
10.1.3 Impact of Global Warming on Two Italian
South Alpine Lakes
10.1.3.1 Downscaling of Meteorological Forcing
Figure 10.3 summarizes the results of the DSC application for atmospheric
temperature and the relative projection over the period 1953–2050. Panel (a) reports
the seasonal comparison between daily temperature quantiles from the hind-cast
simulation (RES through ERA40) at the node closest to the city of Lecco against the
daily temperature quantiles measured by a ground station located in Lecco
(data from Lombardy Regional Agency for Environmental Protection, http://ita.
arpalombardia.it/meteo/dati/richiesta.asp) over a period of 8 years (1991–1999).
An average underestimation of around 6°C can be noticed for the hind-cast simula-
tion. Such a difference can be attributed to a relatively low topography resolution in
condition of high intra-node variability (e.g. very steep lake valley) which led to eleva-
tion smoothing at the RES node spatial scale. Despite this critical offset the Q–Q plots
comparison is in most cases linear at all seasons, with exception for extreme values.
The impact of DSC on both hind cast and scenario temperature distributions (Fig. 10.3)
is evident comparing the yearly mean values of the simulated atmospheric tempera-
ture before (b) and after (c) DSC. Despite an average increase of about 6°C, the appli-
cation of DSC technique does not affect the overall trend of the variable, as it can be
also seen from the trend slope values reported in Table 10.1. The same DSC technique
was applied to the other meteorological data forcing DYRESM (not shown) obtaining
similar results to those reported in detail for atmospheric temperature.
Fig. 10.3 Q-Q plots comparison between hind-cast simulation and measured air temperature (a).
Projected trends before (b) and after (c) downscaling: ERA40 black dot line; control simulation
and A1b scenario black full line
10. 316 D. Copetti et al.
10.1.3.2 Past, Present and Future Projections of Lake Thermal Structure
In order to test the model performances we compared field temperature data measured
in both environments (Lake Pusiano and Como) with those simulated by DYRESM.
Temperature was measured at different depths through thermistor chains. The com-
parison for the 0–5, 0–23 and 0–60 m (the latter only for Lake Como) layers is
reported in Fig. 10.4. Lake Pusiano is represented in panel (a) Lake Como in
panel (b). For both environments it can be noticed that the simulation well represent
the seasonal and pluri-annual evolution of the upper 5 m indicating that the model
is able to properly reproduce both surface mixing and heat exchange at the air-water
interface. Model performances decrease with increasing depth indicating a lower
model capability in simulating internal and deep mixing. From this point it has to be
underlined that hydrodynamic model performances are markedly sensitive to the
resolution of wind field data (Rueda et al. 2005; Copetti et al. 2006) and that local
projections of this variable can be compromised by low topography resolution,
which is one of the main limitation affecting current RES model performances.
After model assessment DYRESM was forced (A1b scenario) to simulate the
thermal evolution of the upper 20 m (almost maximum depth for Lake Pusiano) of
the water column of both lakes (Fig. 10.5). First it has to be noticed that both
environments show a very similar trend with an average increase of around 0.04°C
Table 10.1 Air temperature trend slope for hind-cast simulation (ERA40), control and future
scenario (A1b) at the node close to the city of Lecco before and after downscaling (DSC)
ERA-40 (1970–1999) 20c (1970–2000) A1b (2001–2050)
Before DSC 0.032°C year−1
0.041°C year−1
0.028°C year−1
After DSC 0.032°C year−1
0.040°C year−1
0.026°C year−1
Fig. 10.4 Comparison between average daily field and simulated temperatures (respectively grey
and black lines) for Lake Pusiano (panel a: 0–5 and 0–23 m layers) and for Lake Como (panel b:
0–5, 0–23, 0–60 m layers). Trend line width decreases with increasing layer depth
11. 31710 Impacts of Climate Change on Water Quality
year−1
between 1970 and 2000. This increase is of the same order of magnitude of
those reported in long term studies (Ambrosetti and Barbanti 1999; Tartari et al.
2000; Livingstone 2003). For the first half of the twenty-first century our model
simulations confirm a process of warming of the upper 20 m of the water column.
Between 2001 and 2050 lake warming is expected to occur at a less pronounced rate
of about 0.03°C year−1
, in line with the slighter increase of atmospheric temperature
projected for the same period (Table 10.1).
10.1.4 Ecological Implications of Lake Warming
Future projections of the lake water temperature evolution are of essential impor-
tance for both predicting incoming lake functioning modifications and planning
management initiatives.
The results presented in this section agreed with those from other previous long
terms studies, which underlined an average temperature increase of the order of
hundredths of °C per year. In particular our simulations showed an average annual
increase of 0.04 and 0.03°C year−1
(over the first 20 m of the water column) respec-
tively for the periods 1970–2000 and 2001–2050. This means that on average the
first 20 m of the water column have increased their temperature of about 1.2°C
between 1970 and 2000 and that a further increase of 1.5°C is expected by the
middle of the twenty-first century.
A first impact of the projected warming rates is a global increase of the lake
water column stability (Livingstone 2003) with implications for the annual cycle of
stratification/destratification of the water column and on the maximum depth of
Fig. 10.5 Simulated annual mean water temperature of the layer 0–20 m for both Lake Pusiano
(a) and Lake Como (b): hind-cast (ERA40) black dot line; control simulation and A1b scenario
black full line
12. 318 D. Copetti et al.
mixing (mixolimnio) in winter (Ambrosetti and Barbanti 1999). At the ecosystem
level this is expected to reduce the mass transfer between surface and deep waters
with particular reference for the oxygen exchange rate and nutrient circulation over
the water column (Salmaso et al. 2003; Verburg et al. 2003; Ambrosetti et al. 2010).
Although the reliability of our simulations decreases with increasing depth, our
projections for Lake Como (not shown) seems to confirm the reduction of the mix-
olimnio depth at maximum winter overturn, detected by Ambrosetti and Barbanti
(1999) in recent decades for DSL. By contrast no macroscopic effect have been
captured by our simulations on the thermal behavior of Lake Pusiano which tends
to completely overturn at each winter season of the first half of the twenty-first cen-
tury. This dissimilar response is clearly related to a different physical inertia (Tartari
et al. 2000; Salmaso and Mosello 2010) of the two environments, typical respec-
tively of large-deep and mid-size lakes.
The magnitude of the projected temperature increases is also sufficient to
determine significant variations in the growth rate of phytoplankton popula-
tions. In a range of temperature between 15 and 25°C Oberhaus et al. (2007)
measured an increase of threefold in the growth rate (from about 0.15 to 0.45
day−1
) of Planktothrix rubescens a filamentous and potentially toxic cyanobac-
terium which is recently invading many European lakes, jeopardizing the use of
the water resource, especially for drinking supply and bathing (Legnani et al.
2005; Manganelli et al. 2010). In recent years P. rubescens has become the
dominant species in both Lake Como and Pusiano (Buzzi 2002; Legnani et al.
2005). Assuming a linear relationship between temperature and P. rubescens
growth rate we can estimate that an average increase of 2°C in lake temperature
is expected to determine around 40% of increase in the growth rate. In a rela-
tively recent past (Reynolds 1984) P. rubescens has been described as a cold
stenotherm species well adapted to growth at low level of irradiance typically
found in the thermocline of stratified lakes in summer, which hardly became
dominant among the phytoplankton assemblage (Reynolds 1984). By contrast
recent papers (Legnani et al. 2005; Manganelli et al. 2010) suggest a shift in the
phenology of this species which tends to bloom in winter (even massively), to
dominate in spring and only to quiescently growth in summer. The success of
this species in the following season is influenced by the autumnal population
size (inoculum) whose strength affects the probability to overcome the winter
season (Salmaso 2000). Although changes in the phenology of a species are
mediated by a variety of factors (such as nutrient availability, water renewal
time, light penetration, interspecific competition and predation) the rapid rate of
dispersal of this species suggests the presence of global causes. One of these
can be reasonably identified in the change of the lake temperature patterns.
In particular temperature increases of the order of 2°C during the maximum
winter overturn may promote an earlier nutrient uptake favoring this cold steno-
therm species (Oberhaus et al. 2007) to bloom in late winter or early spring in a
similar way described by Thackeray et al. (2008) for other phytoplankton spe-
cies in North Europe.
13. 31910 Impacts of Climate Change on Water Quality
10.2 Nutrient Loads: Simulations of River Catchments
10.2.1 Introduction
Future scenarios of nutrient availability in coastal areas need accurate predictions of
river loads. River discharge and the associated nutrient loads depend both on climatic
conditions and on anthropogenic factors, finally acting as ‘stressors’ on coastal and
(on the long run) on open-ocean ecosystems.
This is especially relevant for the Mediterranean Sea, one of the largest semi-
enclosed basins with prominent oligotrophic characteristics, where the river loads
are recognized to play a major role in partially compensating the net nutrients loss
induced by estuarine inverse circulation (Guerzoni et al. 1999). River loads have
been supposed to play a major role also in the spatial trophic structure of the
Mediterranean Sea, by inducing a longitudinal skewness in the Mediterranean
macronutrient distribution (Crise et al. 1999). The identification of the average river
loads is also important for eutrophication studies.
The four major Mediterranean rivers (Nile, Rhône, Po and Ebro) account for 60%
of the total river discharge (Struglia et al. 2004). As the Mediterranean hydrological
cycle is liable to be altered under changed climatic conditions (Sanchez-Gomez et al.
2009), there is a need to predict at least the loads attributable to these four major
contributors. On the other hand, smaller rivers (average discharge<100 m3
s−1
) can
be considered to have minor effects on climatic scales, their impact being confined
to coastal ecosystems, which are very effective in trapping terrigenous agents.
For the production of future scenarios in the framework of the CIRCE project
numerical computation of river discharge was explicitly considered, together with an
impact evaluation of the transport of nutrient loads. The objective was to define a meth-
odology for the estimate of Nitrogen and Phosphorus river loads, under present climate
condition and future scenarios, selecting the Po basin as a significant test case.
In the last decades, the Po River has shown modifications of the stoichiometric
nutrient balance and has influenced the productivity and the trophic dynamics of
the Adriatic basin, rapidly reacting to variations in the external conditions and
determining severe eutrophication phenomena (Justić et al. 1995; Pettine et al. 1998;
Artioli et al. 2005). The dependencies of the nutrient loads on physical and socio-
economical drivers in the Po basin has been modeled, calibrated, and projected in
the near future in a previous paper (Palmeri et al. 2005).
The Po basin is the largest hydrographic basin in Italy, located in the northern
part of the country and slightly extending into small areas of Switzerland and France.
The basin embraces an area of approximately 71,000 km2
with a population of about
16×106
, resulting in an average density of 225 pp km2
. The river is 652 km long.
Direct river water uptake amounts to 25.1×10⁹
m3
year−1
, while uptake from ground-
water is estimated to be 5.3×10⁹
m3
year−1
. This area is of considerable relevance to
national economy as it provides 40% of the national GDP. It hosts 37% of the indus-
trial production, 55% of animal husbandry and 35% of agricultural production,
14. 320 D. Copetti et al.
while 46% of the Italian employed population resides in this area. Local climate
may be classified as temperate suboceanic (warm temperate oceanic and suboce-
anic, partially sub-Mediterranean in coastal areas), with an average annual rainfall
of about 980 mm year−1
.
The average discharge of the river Po at Pontelagoscuro near Ferrara for the
period 1986–2001 is 1,500 m3
s−1
, but peaks have been registered up to 10,300 m3
s−1
.
Nitrogen (N) and Phosphorus (P) concentrations have been measured at this site for
the last 30 years. These measurements highlight the recent trend in N and P river
loads. Current estimates for Nitrogen and Phosphorus loads are 170,000 t year−1
and
8,000 t year−1
respectively. Approximately 70% of N loads come from diffuse
sources (direct and indirect inputs to surface water and seepage) while 30% come
from point sources. On the contrary diffuse sources account for 35% of P loads,
whereas point sources are responsible for the remaining 65% (Palmeri et al. 2005).
10.2.2 Data and Methodology
The methodology for the prediction of nutrient loads proposed in this work is based
on the use of a hierarchy of different numerical models: the relevant meteorological
fields (precipitation and runoff) computed by currently available climate models are
elaborated by a numerical scheme (IRIS: Interactive RIver Scheme, already
described in Sect. 9.2 of Part II of this book) in order to supply the necessary hydro-
logical information to the model of nutrient emission and transport into the river
(MONERIS: MOdelling Nutrient Emissions into River Systems). Such information
is used by MONERIS together with other socio-economic data relative to land use
and population in order to estimate the final loads into the sea. These loads are then
liable to be used as input to coastal or ocean models. The MONERIS model set up
is discussed in detail in Palmeri et al. (2005) which is assumed as basis for the
present work. In particular results obtained for the 1996–2000 validation window
(Palmeri et al. 2005) have been obtained by calibrating MONERIS with the obser-
vations and are then considered as a control experiment to which the results of our
simulations must be compared in order to assess the reliability of the regional simu-
lations for the present application.
We perform both a present climate experiment (PCE) and future scenario simula-
tions by using precipitation and runoff fields from present climate and scenario runs
of the Regional Climate Model (RegCM) (Giorgi et al. 1993a, b) available from the
PRUDENCE project.
The MONERIS model estimates nutrient loads originated from natural and
anthropogenic sources within a selected basin. It has been developed by Behrendt
(IGB, Berlin, Germany) and its detailed description and first applications can be
found in Behrendt and Opitz (1999) and Behrendt et al. (2000).
It is calibrated according to the existing discharge observations (provided by the
Po Basin Authority – AdBP 2001) and avoids the detailed water balance calculation.
Moreover it is kept manageable also on large watersheds by limiting its application
15. 32110 Impacts of Climate Change on Water Quality
to time scales much longer than the characteristic times of the hydrologic response
(i.e., yearly) and by aggregating spatial information into sub-catchment units of the
order of hundreds of km2
.
This approach also permits the inclusion in the model of several socio-economical
factors which can only be estimated at non-local scales. Such an opportunity is par-
ticularly useful for the investigation of future watershed management scenarios
(Grossman 1994).
MONERIS is a steady state space dependent parameter model with a time reso-
lution of 1 year. The model discriminates between nutrients generated within the
basin, the emissions, and nutrients conveyed by the water flowing in the surface
river network down to the sub-basin closure(s), the loads.
The domain of application of MONERIS is divided into sub-domains called ana-
lytical units, whose spatial extension is approximately 100 km2
. The calculation of
loads is performed in two subsequent steps. First, for each analytical unit MONERIS
considers the possible diffuse and point sources of nutrient emissions and estimates
them by taking into account seven main different processes, called pathways: waste
water treatment, atmospheric deposition, erosion, surface runoff, tile drainage,
groundwater flow, urban systems discharges. It then evaluates the nutrient abate-
ment inside each sub-domain through the retention equation and computes nutrient
loads. The analytical units are then hierarchically interconnected in order to create
a flow tree that realistically reproduces the load pathways and fate within the catch-
ment area. The retention model used for the evaluation of emission abatement can
be calibrated and adapted to the specific conditions of the region under analysis. The
MONERIS version used in this work has been calibrated over the 1990–1995 time
window and validated over the 1996–2000 period (Palmeri et al. 2005).
The main processes of generation and transport of nutrients (nitrogen and phos-
phorus) through the river network simulated by the MONERIS can be ascribed both
to natural phenomena, like atmospheric deposition or land/underground flow, and to
the specific land use of the region, e.g. drainage or erosion of agricultural areas or
industrial/urban systems. The details of the simulated processes are:
NATURAL BACKGROUND: it accounts for emissions of nitrogen and phos-•
phorus. The model also includes the amount of emissions associated with snow.
ATMOSPHERIC DEPOSITION: Nutrients (NH• 4
+
, NOx
, PO4
3−
) coming from
atmospheric deposition onto water surface.
GROUNDWATER: Nutrient emissions through shallow groundwater are calcu-•
lated. Nitrogen concentrations in groundwater are the sum of meteoric water con-
centrations and agricultural surplus. For the calculation of concentrations the
model uses typical values that vary as a function of soil texture. These parameters
can be adjusted in order to fit the mean values specific for the region in analysis.
OVERLAND FLOW: Nutrient emissions from surface runoff originated by•
rainfall. This pathway only considers dissolved nutrients. The model uses mean
concentrations of nitrogen and phosphorus as a function of soil texture.
SURPLUS: Phosphorus and Nitrogen concentrations in topsoil as functions of•
the long term agricultural surplus and of the mean content of clay in the soil.
16. 322 D. Copetti et al.
TILE DRAINAGE: Nutrients emissions through tile drained agricultural areas.•
The phosphorus concentrations in drainage water are calculated from the agri-
cultural surplus. The model includes nitrogen removal by denitrification.
EROSION: Nutrient emissions from surface erosion in agricultural lands (topsoil).•
Nitrogen concentrations are given as input data, while phosphorus concentra-
tions are calculated as surplus.
URBAN SYSTEMS: Nutrient emissions from urban systems, including paved•
urban areas wash out during meteoric events, direct civil discharge into surface
waters, combined sewers overflows and discharges from industrial areas.
POINT SOURCES: Nutrient emissions from point sources (WWPT).•
The IPCC Special Report on Emissions Scenarios (SRES, Nakicenovic and
Swart 2000) defines alternative projections of future green house gases (GHG)
emissions in response to driving forces such as demographic development, socio-
economic development, and technological changes. Four different qualitative repre-
sentations of these driving forces and emissions yield four different sets of scenarios,
called “families” and usually labeled A1, A2, B1 and B2. Each single scenario is a
specific quantitative realization among all those possible within the same family.
Each family results from the combination of different economical and environmen-
tal strategies. For this work we selected A2 and B2 SRES scenarios together with
the present climate run (PCE). This choice is imposed by the availability of regional
simulations performed within the FP6 PRUDENCE project. The A2 scenario
describes a world that maintains prominent geographical differences and preserves
local identities. Economic development is primarily regionally oriented and per
capita economic growth and technological changes are fragmented for the industri-
alized countries. In this scenario the global population at 2100 is estimated to be
approximately 15 billion people. The B2 scenario describes a world in which the
emphasis is still on local solutions to economic and social problems, plus a deeper
concern for environmental sustainability. Again, economic growth and technologi-
cal changes are fragmented. This scenario implies a moderate population growth,
intermediate levels of economic development, but a reduced demand of primary
energy if compared to the A2 scenario. In this scenario the global population at
2100 is approximately 10 billion people.
10.2.3 PCE and Scenarios Implementation
In this application the Po catchment is divided into 33 analytical units, as shown in
Fig. 10.6. All the variables coming from different sources have been geographically
associated to such partitions, by adopting ad hoc strategies for each variable which
will be discussed in the following. It must be noted that the SRES scenarios are not
direct counterparts of local projections of land use, soil and demographic growth.
The precipitation from 2071 to 2100 is given by the regional climate model
RegCM (Giorgi et al. 1993a, b). This simulation is a part of the PRUDENCE project,
17. 32310 Impacts of Climate Change on Water Quality
where a multi-model approach was used in order to assess climate change at regional
scale over Europe. The 30 year average of the relevant simulated hydrological fields
were interpolated to the IRIS working grid for the PCE and the A2 and B2 scenar-
ios. Mean fields were then spatially integrated to provide the aggregated informa-
tion for each analytical unit. Atmospheric deposition for nitrogen is maintained as
in Palmeri et al. 2005.
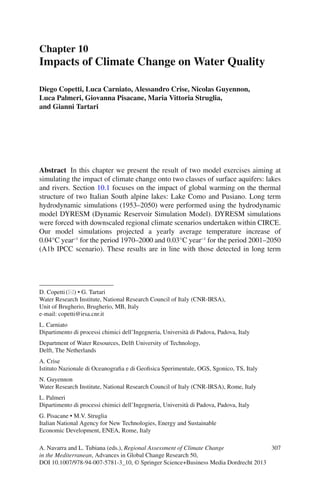
The projections of population are fundamental to calculate nutrient emission
from urban system and are provided for North Italy by ISTAT up to 2051 (http://
demo.istat.it/). In these estimates there are three scenarios: low growth scenario
(consistent with A1 and B1 scenario), medium growth scenario (consistent with B2)
and high growth scenario (consistent with A2). The population projected to 2051
for the three scenarios is represented in Fig. 10.7. The population of northern Italy
at 2100 was calculated by projecting the population at 2051 using 2030–2051
growth rates. The 2100/2001 population ratios were multiplied by the values of each
sub-basin population in 2001.
The model uses Corine Land Cover classification (EEA 2000), aggregated to the
second level. To implement land use change in MONERIS it is necessary to have
data at the sub-basin scale up to 2100, but high-resolution land use change models
are available only up to 2030 (for example CLUE model; Verburg et al. 2002). We
thus decide to refer to the land use change percentages provided by IPCC for the
Fig. 10.6 MONERIS 33 basins, gauge stations, river network, lakes and urban areas
18. 324 D. Copetti et al.
OECD countries (Table 10.2). These percentages are referred to four land use types
and were applied to all sub-basins, by multiplying the appropriate percentage by
each Corine Land Cover use.
Soil, tile drainage, geology, and topography characteristics are kept as constant
and the same parameterization is used as in Palmeri et al. (2005). The source for
data on soil is the FAO (1998) Soil Profile Database.
As for the case of land use, there are no long-term high resolution predictions for
the nutrient surplus in agricultural lands either. In the scenarios implementation we
explored two cases. In the first case N and P surplus values were provided by the
ELBA model at 2016 (Nasuelli et al. 1999). In the second case nutrient surpluses
have been prescribed to MONERIS by following the prediction of fertilizer use in
agricultural land provided by Tilman et al. (2001). This work estimates the fertilizer
consumption at 2050 along with a projection of irrigated land area and population
growth at a global level. In order to project the value of the surplus from 2001 to
2100, the use of fertilizer per unit area was assumed equal to the change in agricul-
tural surplus S. The formula used is:
2005 2020 2030 2040 2050 2060
26
27
28
29
30
31
32
33
34
35
Population(106
inhab.)
Year
B2 scenario
A1, B1 scenarios
A2 scenario
Fig. 10.7 Northern Italy population projected to 2051 (http://demo.istat.it/)
Table 10.2 Condition numbers for nutrient loads as function of
specific runoff, phosphorous and nitrogen surpluses and population
DIN TN TP
SPECIFIC RUNOFF 0.52 0.39 0.42
P SURPLUS 0 0 0.31
N SURPLUS 0.46 0.46 0
POPULATION 0.24 0.24 0.59
19. 32510 Impacts of Climate Change on Water Quality
Δ
Δ
2100
20012050
2100 2001
2001 2050
2100
( ) ( ) · 1 · i
i i
glob
P
PF
S S
F P
P
⎡ ⎤⎛ ⎞⎟⎢ ⎥⎜ ⎟⎜ ⎟⎢ ⎥⎜ ⎟⎜⎝ ⎠Δ⎢ ⎥
= +⎢ ⎥⎛ ⎞⎢ ⎥⎟⎜ ⎟⎢ ⎥⎜ ⎟⎜ ⎟⎜⎢ ⎥⎝ ⎠⎣ ⎦
where the subscript i, varying from 1 to 33, indicates the sub-basin, F is the use of
fertilizer per unit area (nitrogen or phosphorus) and P is the population. Differences
indicated by the delta symbol are to be taken between the date of the subscript and
the year 2001.
The values of surplus in kg of nutrient per ha per year have been used in combi-
nation with agricultural land use changes in order to estimate nutrient surplus at the
sub-basin level.
In the Urban Systems category we consider data concerning urban wastewater
treatment plants (WWTP) and the storage capacity of sewers. For each sub-basin
the following data and assumptions were used:
In each sub-basin it is assumed that 95% of inhabitants are connected to sewers.•
This hypothesis is plausible for the 2100 scenarios, according to data supplied by
ISTAT.
It is assumed that all collected waste waters are depurated in WWTPs. The num-•
ber of inhabitants having IMHOFF depuration systems is assumed to be constant
and equal to that of year 2001, as a major population growth is expected in urban
areas rather than in rural areas.
The total length of sewers systems has been projected at 2100 by keeping con-•
stant the 2001 ratio between sewer length and connected inhabitants.
Nutrient emissions per inhabitant (kg in• −1
day−1
) are assumed to be constant at the
values provided by AdBP and ISTAT (AdBP 2001).
It is assumed that WWTP reduction efficiencies for nitrogen and phosphorus will•
reach 90% by 2100.
10.2.4 Results and Discussion
MONERIS calculates the nutrients loads at basin closure (Pontelagoscuro, near
Ferrara, sub-basin 32, Fig. 10.6) in terms of dissolved inorganic nitrogen (DIN),
total nitrogen (TN) and total phosphorus (TP). A preliminary model sensitivity
analysis is carried out by computing the “condition numbers” following Chapra
(1997). Each condition number (CNXV
) is defined as:
XV
V X
CN
X V
∂
=
∂
20. 326 D. Copetti et al.
Therefore for each load X (DIN, TN or TP), CN is a function of each model forc-
ing variables V (either specific runoff, phosphorous and nitrogen surpluses or popula-
tion). Derivatives are computed by separately imposing variations of ±30% to each
input variable. The condition numbers CNXV
estimate the sensitivity of the X nutri-
ent load to changes in V. The bigger the condition number, the more sensitive the
parameter is for the specific model prediction.
In Table 10.2 we report the condition numbers for each input variable in the loads
estimation. It is evident that the specific runoff affects all nutrient loads, especially
those coming mainly from diffuse sources (DIN). This result highlights the neces-
sity of reliable estimates of river discharge, which for future climate can only be
provided by numerical models. Quite expectedly Table 10.2 also shows that varia-
tions in nutrient surpluses heavily affect the final loads (up to 30%) while changes
in population mainly affect the total phosphorus content.
Figure 10.8 shows the Po River discharge computed by MONERIS as a function
of distance from river spring along the main course for both the PCE and the two
future scenarios. In order to have an observational term of comparison the same
curve was derived by forcing the MONERIS model with observed runoff over the
period 1985–2001. The agreement between observed and modeled discharge is
quite good, despite the RegCM negative bias in estimating runoff (Sect. 9.2 of Part
II of this book). The two scenarios show a similar increase in Po discharge as a
result of comparable increases in mean annual precipitation (for A2 and B2 sce-
narios mean precipitation is 1,220 and 1,265 mm year−1
respectively).
Figures 10.9 and 10.10 show mean nutrient surplus for the period 1996–2000 and
for future scenarios. For future scenarios the two surplus prescription methods
recalled in the preceding section were adopted: in the first case surplus is computed
Fig. 10.8 Po runoff as a function of the distance from the river spring
21. 32710 Impacts of Climate Change on Water Quality
by the ELBA model while in the second case surplus is based on Tilman prediction.
In the first case a fixed value of surplus for each sub-basin is imposed for both scenarios,
without considering population growth, whereas in the second case sub-basin surplus
was calculated as a function of population. Therefore for each scenario two different
surplus values were attributed to the sub-basins. As a result no big variations are
observed between the control experiment and the first case scenario runs, whereas in
Fig. 10.9 Mean nitrogen surpluses for the control experiment (MONERIS 1996–2000, Palmeri
et al. 2005) and future scenarios
Fig. 10.10 Mean phosphorus surpluses for the control experiment (MONERIS 1996–2000,
Palmeri et al. 2005) and future scenarios
22. 328 D. Copetti et al.
the second case surplus is definitely larger for the more populated scenarios, showing
a 61% increase in Nitrogen and a 41% increase in Phosphorus for the A2 scenario.
When population is held fixed, there are no relevant changes for TN and DIN
loads with respect to the control experiment, as nitrogen loads are mainly generated
from agricultural areas (via groundwater leakage and surface runoff of surplus). The
maximum increase is 19% for DIN and 14% for TN, due to increased river
discharge.
Urban waters collected through WWTPs in point sources are important in the
calculation of TP loads. The assumed increased efficiency of WWTPs reduces TP
loads for all scenarios (for B2 scenario the reduction is 28%).
On the other hand, when increases in population are allowed, we find more
important changes in the river loads which reflect the past tendency to increment
the use of fertilizers with population, regardless of legislative directives (e.g. Nitrate
Directive 91/676/EEC). As expected the loads are greater in this case due to the
increase in all agricultural surplus. In the A2 scenario the increase of TN and DIN
loads exceeds 50%. TP loads decrease for the B2 scenario whereas they slightly
increases for the A2 scenario due to large growth of agricultural surplus as a conse-
quence of population increment. Again the increased efficiency of WWTPs is cru-
cial for TP determination. Such large variations call for suitable countermeasures
and mitigation strategies.
10.2.5 Final Remarks
In this study we present a methodology for the numerical estimation of river loads,
which is particularly useful when observed data are not available as in the case of
future climate and land use changes. The MONERIS model was applied to estimate
river loads as a function of the main hydrological variables (precipitation, runoff
and river discharge) and of nutrient surplus and population. MONERIS has been
proved to be suitable for the scope of this work, as it is a good compromise between
quality of results and input requirements. We assessed the relative weight of the
input variables in determining the final nutrient river loads. Our results, however,
are limited by a systematic lack of detailed projections for future changes at the sub-
basin scale, thus forcing the adoption of simplified assumptions in the scenario
implementation. For instance, homogeneous land use changes had to be assumed,
whereas agricultural surplus and population estimates were extrapolated from the
predicted growth rate up to 2050.
Results obtained for the scenarios are consistent with the model behavior: diffuse
sources are predominant for nitrogen and the more influential parameters are specific
runoff and agricultural surplus, whereas the most significant contributors to phos-
phorus loads are point sources, for which population estimates and WWTPs
efficiencies are crucial parameters. For the Po basin test case results appear to be
quite satisfactory, although the PCE experiment exhibits a systematic negative bias
with respect to the control, recommending caution in the evaluation of the scenario
23. 32910 Impacts of Climate Change on Water Quality
estimates, which might need to be adjusted to higher values. Nevertheless we trust
that the proposed method is a valuable tool for the assessment of climate change
impacts at the regional scale for large-medium size catchments, in particular in view
of possible improvements in land modules of atmospheric limited area models.
10.3 Conclusions
In this chapter we presented two model frameworks which resulted to be suitable for
evaluating the impact of global change at the regional (large river basin) or sub-
regional scale (lake environment). Both model applications developed specific
approaches (e.g. statistical downscaling of meteorological forcing) to overcome
lacks in spatial scale resolution and consistency of local input data that are still the
principal factors limiting the reliability of local impact studies.
Although preliminary, the lake water temperature simulations presented in
this study are in line with those detected in past long-term measurement cam-
paigns undertaken word wide. This is meaningful, and in part surprisingly, if we
consider that these projections are the result of a model cascade working from
the global to the very local (of the order of tens km2
) spatial scale. This model
framework represents a powerful management and research tool potentially
transferable to other European and Mediterranean lacustrine environments. The
significance of this model exercise is amplified by the fact that the hydrodynamic
model applied in this impact study can be easily coupled with the Computational
Aquatic Ecosystem Model (CAEDYM) one of the most advanced ecological
process-based model. DYRESM-CAEDYM is currently used in modeling stud-
ies aiming at exploring the impact of climate change on both Lake Como and
Pusiano ecology and water quality, trying to link the global climatic scenarios
with the local ecosystem responses
In a similar way the methodology proposed for estimating the nutrient load in a
large medium size catchment appears to be a valuable tool for the assessment of
climate change impact at the regional scale. The quite satisfactory results obtained
for the Po basin give ground for the application of such a methodology to other
European and Mediterranean catchments. Moreover, our assessment of the different
relative weights of input variables in determining nutrient load variations allows to
distinguish between the effects induced by climate change and those attributable to
a muted anthropic pressure. This result supports the effectiveness of a water quality
projection tool for future planning of water management. Enhancements of its per-
formance are mainly expected from future improvements in the land modules
included in atmospheric models and from an increased robustness of the projected
population and agricultural surpluses.
Acknowledgment The authors wish to thank the EPSONmeteo Centre (http://www.meteo.it/) for
the computational support and the Centre for Water Research (http://www.cwr.uwa.edu.au/) for
kindly supplying the in-lake hydrodynamic model DYRESM
24. 330 D. Copetti et al.
References
AdBP (2001) Progetto di piano stralcio per il controllo dell’eutrofizzazione (PsE). Relazione di
sintesi. Autorità di Bacino del Fiume Po, Parma, delibera no. 15, 31 Jan 2001 (In Italian)
Algesten G, Sobek S, Bergström AK, Jonsson A, Tranvik L, Jansson M (2005) Contribution of
sediment respiration to summer CO2
emission from low productive boreal and subarctic lakes.
Microb Ecol 50:529–535
Ambrosetti W, Barbanti L (1999) Deep water warming in lakes: an indicator of climatic change.
J Limnol 58:1–9
Ambrosetti W, Barbanti L, Carrara EA (2010) Mechanisms of hypolimnion erosion in a deep lake
(Lago Maggiore, N. Italy). J Limnol 69:3–14
Artale V, Calmanti S, Carillo A, Dell’Aquila A, Herrmann M, Pisacane G, Ruti PM, Sannino G,
Struglia MV, Giorgi F, Bi X, Pal JS, Rauscher S, The PROTEUS Group (2010) An atmosphere–
ocean regional climate model for the Mediterranean area: assessment of a present climate
simulation. Clim Dyn 35:721–740
Artioli Y, Bendoricchio G, Palmeri L (2005) Defining and modelling the coastal zone affected by
the Po River (Italy). Ecol Model 184:55–68
Bastviken D, Cole J, Pace M, Tranvik L (2004) Methane emissions from lakes: dependence of lake
characteristics, two regional assessments, and a global estimate. Glob Biogeochem Cyc
18:GB4009. doi:10.1029/2004GB002238
Bates BC, Kundzewicz ZW, Wu S, Palutikof JP (eds) (2008) Climate change and water. Technical
paper of the Intergovernmental Panel on Climate Change. IPCC Secretariat, Geneva
Behrendt H, Opitz D (1999) Retention of nutrients in river systems: dependence on specific runoff
and hydraulic load. Hydrobiologia 410:111–122
Behrendt H, Huber P, Kornmilch M, Opitz D, Schmoll O, Scholz G, Uebe R (2000) Nutrient emis-
sions into river basins of Germany. UBA-FB, 99-087/e
Bström B, Andersen JM, Fleischer S, Jansson M (1988) Exchang of phosphorus across the
sediment-water interface. Hydrobiologia 170:229–244
Buzzi F (2002) Phytoplankton assemblages in two sub-basins of Lake Como. J Limnol
61:117–128
Chapra SC (1997) Surface water−quality modeling. McGraw-Hill, New York
Coats R, Perez-Losada J, Schladow G, Richards R, Goldman C (2006) The warming of Lake
Tahoe. Clim Chang 76:121–148
Copetti D, Tartari G, Morabito G, Oggioni A, Legnani E, Imberger J (2006) A biogeochemical
model of the Lake Pusiano (North Italy) and its use in the predictability of phytoplankton
blooms: first preliminary results. J Limnol 65:59–64
Crise A, Allen JI, Baretta J, Crispi G, Mosetti R, Solidoro C (1999) The Mediterranean pelagic
ecosystem response to physical forcing. Prog Oceanog 44:219–243
Déqué M (2007) Frequency of precipitation and temperature extremes over France in an anthropo-
genic scenario: model results and statistical correction according to observed values. Glob
Planet Change 57:16–26
Downing JA, Prairie YT, Cole JJ, Duarte CM, Tranvik LJ, Striegl RG, McDowell WH, Kortelainen
P, Caraco NF, Melack JM, Middelburg JJ (2006) The global abundance and size distribution of
lakes, ponds, and impoundments. Limnol Oceanogr 51:2388–2397
Dumont HJ (ed) (2009) The Nile: origin, environments, limnology and human use. Monographiae
Biologicae 89. Springer, Dordrecht
EEA (2000) CORINE land cover 250 m grid, version 12/2000
EEA(2008)ImpactsofEurope’schangingclimate–indicator-basedassessment.EEA,Copenhagen.
doi:10.2800/48117
Einsele G, Yan J, Hinderer V (2001) Atmospheric carbon burial in modern lake basins and its
significance for the global carbon budget. Glob Planet Change 30:167–195
Eisenreich SJ (2005) Climate change and the European water dimension. European Community,
Ispara
25. 33110 Impacts of Climate Change on Water Quality
Elliott JA, Thackeray SJ, Huntingford C, Jones RG (2005) Combining a regional climate model
with a phytoplankton community model to predict future changes in phytoplankton in lakes.
Freshw Biol 50:1404–1411
FAO (1998) FAO–CSIC multilingual soil profile database, version 1.03
Giorgi F, Marinucci MR, Bates GT, De Canio G (1993a) Development of a second generation
regional climate model (REGCM2). Part I: boundary layer and radiative transfer processes.
Mon Weather Rev 121:2794–2813
Giorgi F, Marinucci MR, Bates G, De Canio G (1993b) Development of a second generation
regional climate model (REGCM2). Part II: cumulus cloud and assimilation of lateral bound-
ary conditions. Mon Weather Rev 121:2814–2832
Grossman WD (1994) Socio-economic ecological models: criteria for evaluation of state-of-art
models shown on four case studies. Ecol Model 75–76:21–36
Guerzoni S, Chester R, Dulac F, Herut B, Loÿe-Pilot MD, Measures C, Migon C, Molinaroli E,
Moulin C, Rossini P, Saydam C, Soudine A, Ziveri P (1999) The role of atmospheric deposition
in the biogeochemistry of the Mediterranean Sea. Prog Oceanogr 44(1–3):147–190
Hodges BR, Imberger J, Saggio A, Winters KB (2000) Modeling basin-scale internal waves in a
stratified lake. Limnol Oceanogr 45:1603–1620
IPCC (2007) Climate change 2007: the physical science basis. Contribution of working group I to
the fourth assessment report of the Intergovernmental Panel on Climate Change. Cambridge
University Press, Cambridge, New York
IRSA (1999) Un futuro per l’acqua in Italia. Quaderni IRSA 109 (In Italian)
Justić D, Rabalais NN, Turner RE, Dortch Q (1995) Changes in nutrient structure of river-dominated
coastal waters: stechiometric nutrient balance and its consequences. East Coast Shelf Sci
40:339–356
Laborde S, Antenucci JP, Copetti D, Imberger J (2010) Inflow intrusions at multiple scales in a
large temperate lake. Limnol Oceanogr 55:1301–1312
Legnani E, Copetti D, Oggioni A, Tartari G, Palumbo MT, Morabito G (2005) Planktothrix rubes-
cens’ seasonal and vertical distribution in Lake Pusiano (North Italy). J Limnol 64:61–73
León LF, Lam DCL, Schertzer WM, Swayne DA, Imberger J (2007) Towards coupling a 3D
hydrodynamic lake model with the Canadian regional climate model: simulation on Great
Slave Lake. Environ Model Softw 22:787–796
Livingstone DM (2003) Impact of secular climate change on the thermal structure of a large tem-
perate central European lake. Clim Chang 57:205–225
MacIntyre S, Melack JM (1995) Vertical and horizontal transport in lakes: linking littoral, benthic,
and pelagic habitats. J North Am Benthol Soc 14:599–615
Manganelli M, Scardala S, Stefanelli M, Vichi S, Mattei D, Bogialli S, Ceccarelli P, Corradetti E,
Petrucci I, Gemma S, Testai E, Funari E (2010) Health risk evaluation associated to Planktothrix
rubescens: an integrated approach to design tailored monitoring programs for human exposure
to cyanotoxins. Water Res 44:1297–1306
Miller RL, Tegen I, Perlwitz J (2004) Surface radiative forcing by soil dust aerosols and the hydro-
logic cycle. J Geophys Res 109:D04203. doi:10.1029/2003JD004085
Nakicenovic N, Swart R (2000) Special report on emissions scenarios: a special report of working
group III of the Intergovernmental Panel on Climate Change. Cambridge University Press,
Cambridge
Nasuelli P, Palladino G, Setti M, Zanasi C (1999) Analisi integrata dei sistemi agro-ambientali: il
modello ELBA. Il modello ELBA. Poster Presentato al 3◦ Convegno Nazionale sulla Protezione
e Gestione delle Acque Sotterranee, atti vol. 1, 1243–1250, Parma (In Italian)
Oberhaus L, Briand JF, Leboulanger C, Jacquet S, Humbert JF (2007) Comparative effects of the
quality and quantity of light and temperature on the growth of Planktothrix agardhii and P.
rubescens. J Phycol 43:1191–1199
Palmeri L, Bendoricchio G, Artioli Y (2005) Modelling nutrient emissions from river systems and
loads to the coastal zone: Po River case study, Italy. Ecol Model 184:37–53
Peeters P, Wüest V, Piepke G, Imboden DM (1996) Horizontal mixing in lakes. J Geophys Res
101:18361–18375
26. 332 D. Copetti et al.
Pettine M, Patrolecco L, Camusso M, Crescenzio S (1998) Transport of carbon and nitrogen to the
Northern Adriatic sea by the Po River. East Coast Shelf Sci 46:127–142
Reynolds CS (1984) The ecology of freshwater phytoplankton. Cambridge University Press,
Cambridge
Rinke K, Yeates P, Rothhaupt K (2010) A simulation study of the feedback of phytoplankton on
thermal structure via light extinction. Freshw Biol 55:1674–1693
Rueda FJ, Schladow SG, Monisnith SG, Stacey MT (2005) On the effects of topography on wind
and the generation of currents in a multi-basin lake. Hydrobiologia 532:139–151
Salmaso N (2000) Factors affecting the seasonality and distribution of cyanobacteria and chloro-
phytes: a case study from the large lakes south of the Alps, with special reference to Lake
Garda. Hydrobiologia 438:43–63
Salmaso N, Mosello R (2010) Limnological research in the deep southern alpine lakes: synthesis,
directions and perspectives. Adv Oceanogr Limnol 1:29–66
Salmaso N, Mosello R, Garibaldi L, Decet V, Brizzio MC, Cordella P (2003) Vertical mixing as a
determinant of trophic status in deep lakes: a case study from two lakes south of the Alps (Lake
Garda and Lake Iseo). J Limnol 62:33–41
Sanchez-Gomez E, Somot S, Mariotti A (2009) Future changes in the Mediterranean water budget
projected by an ensemble of regional climate models. Geophys Res Lett 36:L21401.
doi:10.1029/2009GL040120
Schindler DW (2001) The cumulative effects of climate warming and other human stresses on
Canadian freshwaters in the new millennium. Can J Fish Aquat Sci 58:18–29
Struglia MV, Mariotti A, Filograsso A (2004) River discharge into the Mediterranean Sea:
climatology and aspects of the observed variability. J Clim 17:4740–4751. doi:10.1175/JCLI-
3225.1
Tartari G, Marchetto A, Copetti D (2000) Qualità delle acque lacustri della Lombardia alle soglie
del 2000. Fondazione Lombardia per l’Ambiente. Ricerche & Risultati 44 (In Italian)
Thackeray SJ, Jones D, Maberly C (2008) Long-term change in the phenology of spring phyto-
plankton: species-specific responses to nutrient enrichment and climatic change. J Ecol
96:523–535
Tilman D, Faragione J, Wolff B, D’Antonio C, Dobson A, Woarth R, Schindler D, Schlesinger
WH, Simberloff D, Swackhamer S (2001) Forecasting agriculturally driven global environ-
mental change. Science 292:281–284
Verburg PH, Soepboer W, Veldkamp A, Limpiada R, Espaldon V, Sharifah Mastura SA (2002)
Modeling the spatial dynamics of regional land use: the CLUE-S Model. Environ Manage
30(3):391–405
Verburg P, Hecky RE, Kling H (2003) Ecological consequences of a century of warming in Lake
Tanganyika. Science 301:505–507
Visconti V, Manca M, de Bernardi R (2008) Eutrophication-like response to climate warming: an
analysis of Lago Maggiore (N. Italy) zooplankton in contrasting years. J Limnol 67:87–92
Wetzel RG (2001) Limnology. Lake and river ecosystems. Elsevier Academic Press, San Diego
Yu H, Kaufman YJ, Chin M, Feingold G, Remer LA, Anderson TL, Balkanski Y, Bellouin N,
Boucher O, Christopher S, DeCola P, Kahn R, Koch D, Loeb N, Reddy MS, Schulz M,
Takemura T, Zhou M (2006) A review of measurement-based assessments of the aerosol direct
radiative effect and forcing. Atm Chem Phys 6:613–666
Zepp RG, Erickson DJ III, Paul ND, Sulzberger B (2007) Interactive effects of solar UV radiation
and climate change on biogeochemical cycling. Photochem Photobiol Sci 6:286–300