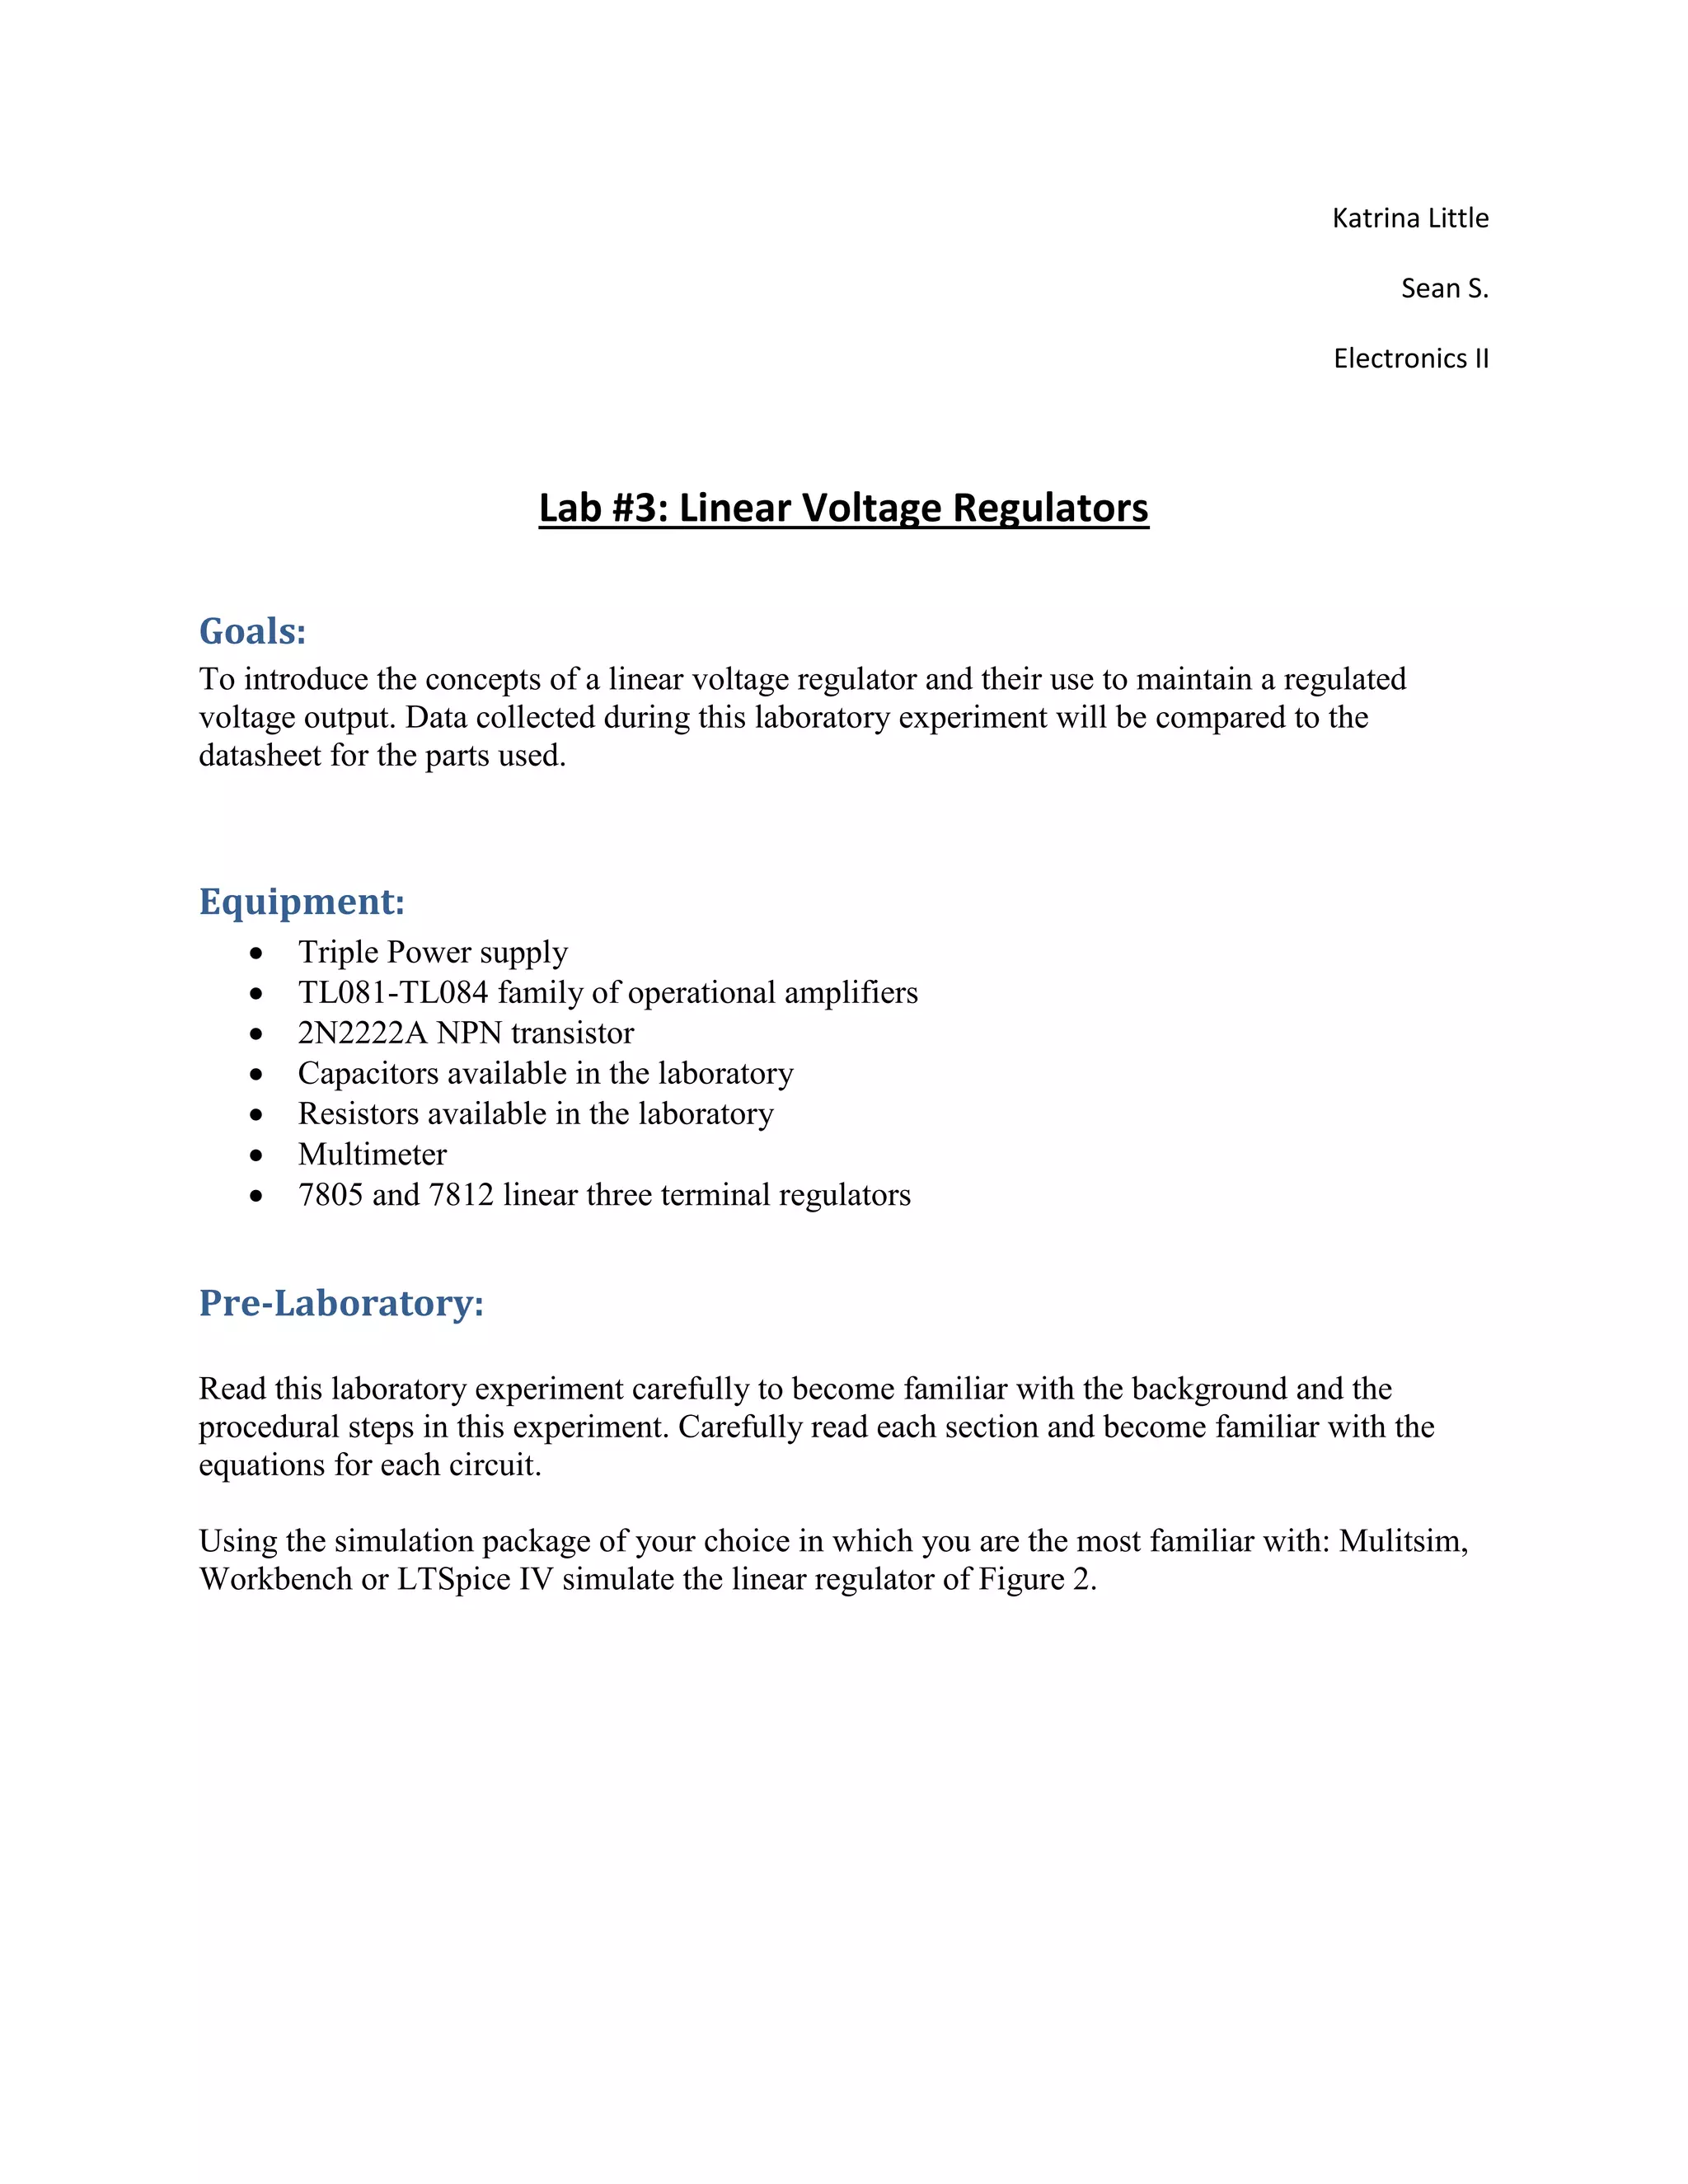
The document outlines a laboratory experiment focused on linear voltage regulators aimed at maintaining a regulated voltage output, detailing equipment and pre-laboratory preparations. It includes experimental procedures for measuring output voltage, input current, efficiency, and dropout voltage using specified operational amplifiers and voltage regulators. Data collected will be compared with datasheet values for the 7805 and 7812 voltage regulators to analyze performance characteristics.
![O. Find the load regulation.
LM7805 LM7812
Load Regulation 10mV 12mV
P. Find the thermal resistance of the voltage regulator.
LM7805 LM7812
Thermal Resistance [ϴJA=50° ϴJC= 4°] C/W [ϴJA=50° ϴJC= 4°] C/W
Procedure:
General Setup:
1. Record the model and serial number of the scope, power supply, multimeter and function
generator used in laboratory experiment.
2. Download the datasheet for the 78XX regulators. This will be needed to obtain the pin-
out of the regulator. When comparing datasheet data values to experimental data use the
typical values in the datasheet if given.
3. Obtain the pin-out for the 2N2222 transistor
4. Make sure that the power supply to the op-amp is correctly wired so as not to apply the
incorrect polarity to the op-amp.
5. When measuring any values, make sure to measure all inputs as well as the output of the
circuit. Do not rely on the values indicated on the instruments. Always measure all signal
values.
6. Before turning any power on, double check the wiring to make sure that it is correct.
7. Measure all resistors that are used in the amplifier circuits using the multimeter and
record these values.
8. Use all measured values to determine experimental results such as gain and current.
9. Comparing data means to calculate the percent difference between two values. For
example, theoretical values versus measured values.
10. Comparing data graphically means to plot the data on the same plot to see how the data
overlaps.
Discrete linear regulator:
1. Build the linear regulator of Figure 2.](https://image.slidesharecdn.com/lab3reportlinearvoltageregulators-180724131814/75/Lab-3-Report-Linear-Voltage-Regulators-4-2048.jpg)
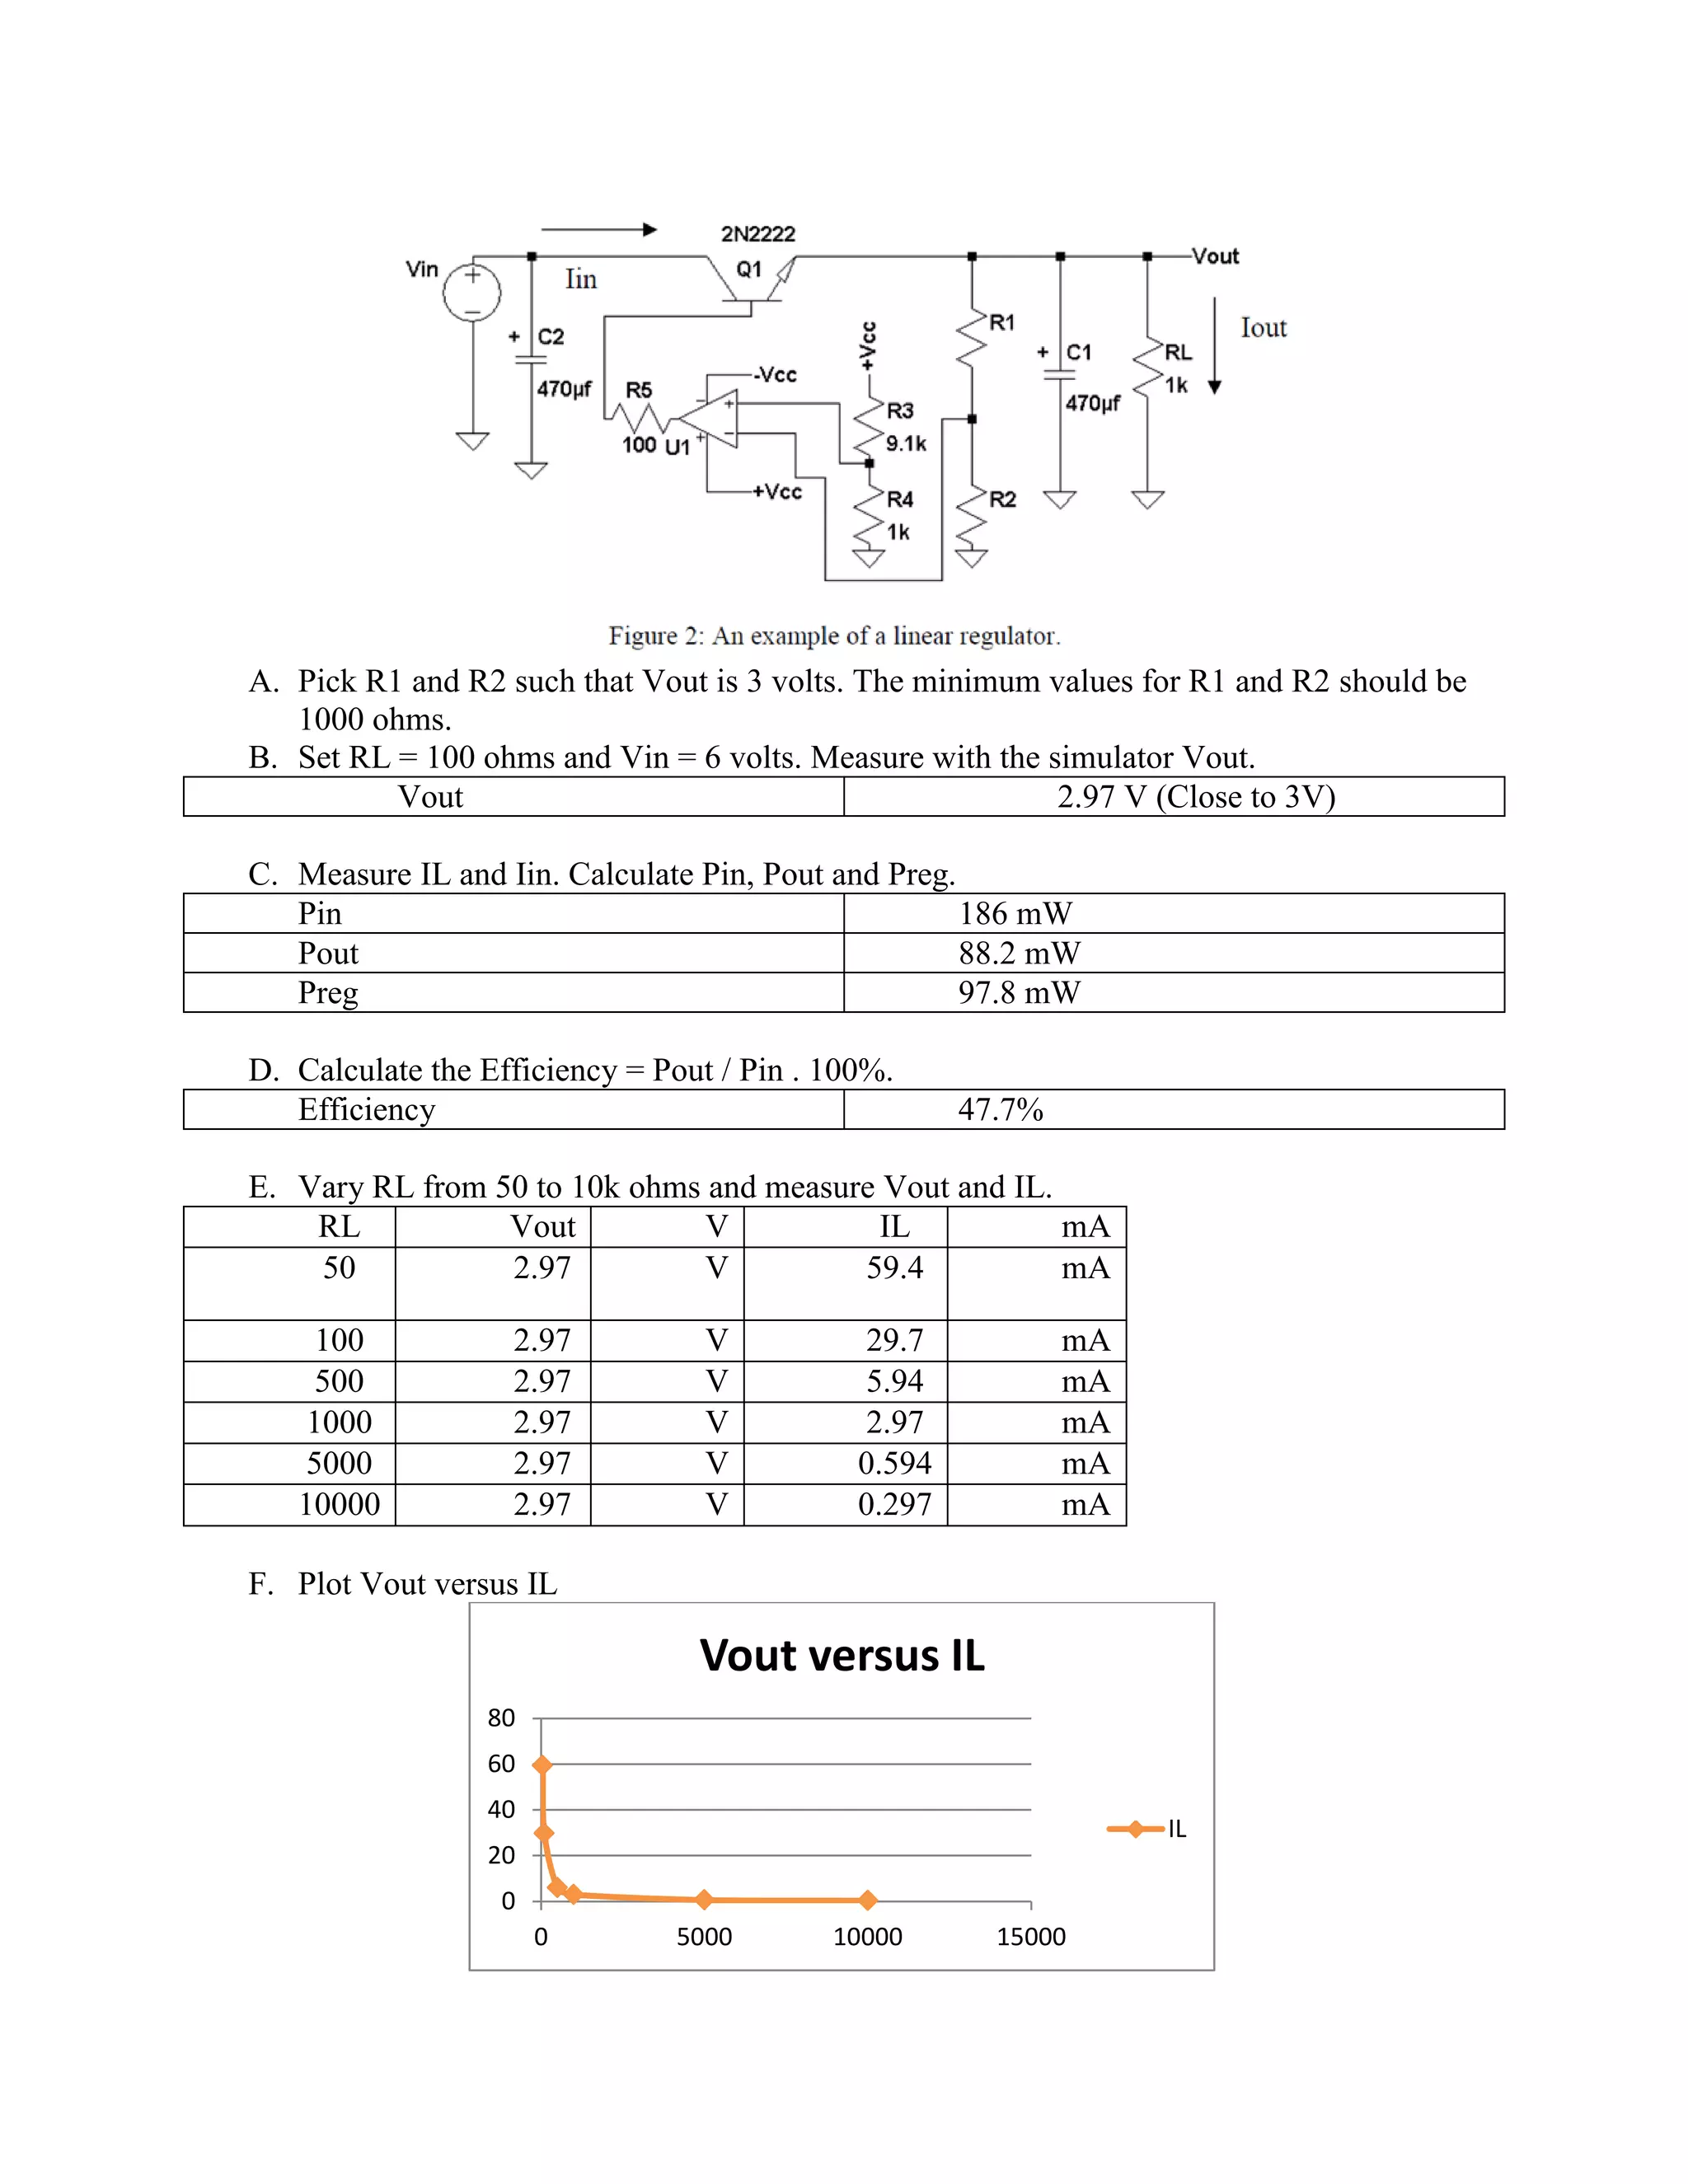
![2. Calculate the resistors R1 and R2 required to produce an output voltage of 3 volts for the
circuit of Part 1. The minimum values for R1 and R2 should be 1000 ohms.
R1 =5.1k , R2 =5.2k
3. Set +Vcc = 15 volts and -Vcc to -15 volts.
4. Build this linear circuit (Part 1) using a 1000 ohm resistor for RL. Take note of the
polarity of the two electrolytic capacitors. Double check your wiring.
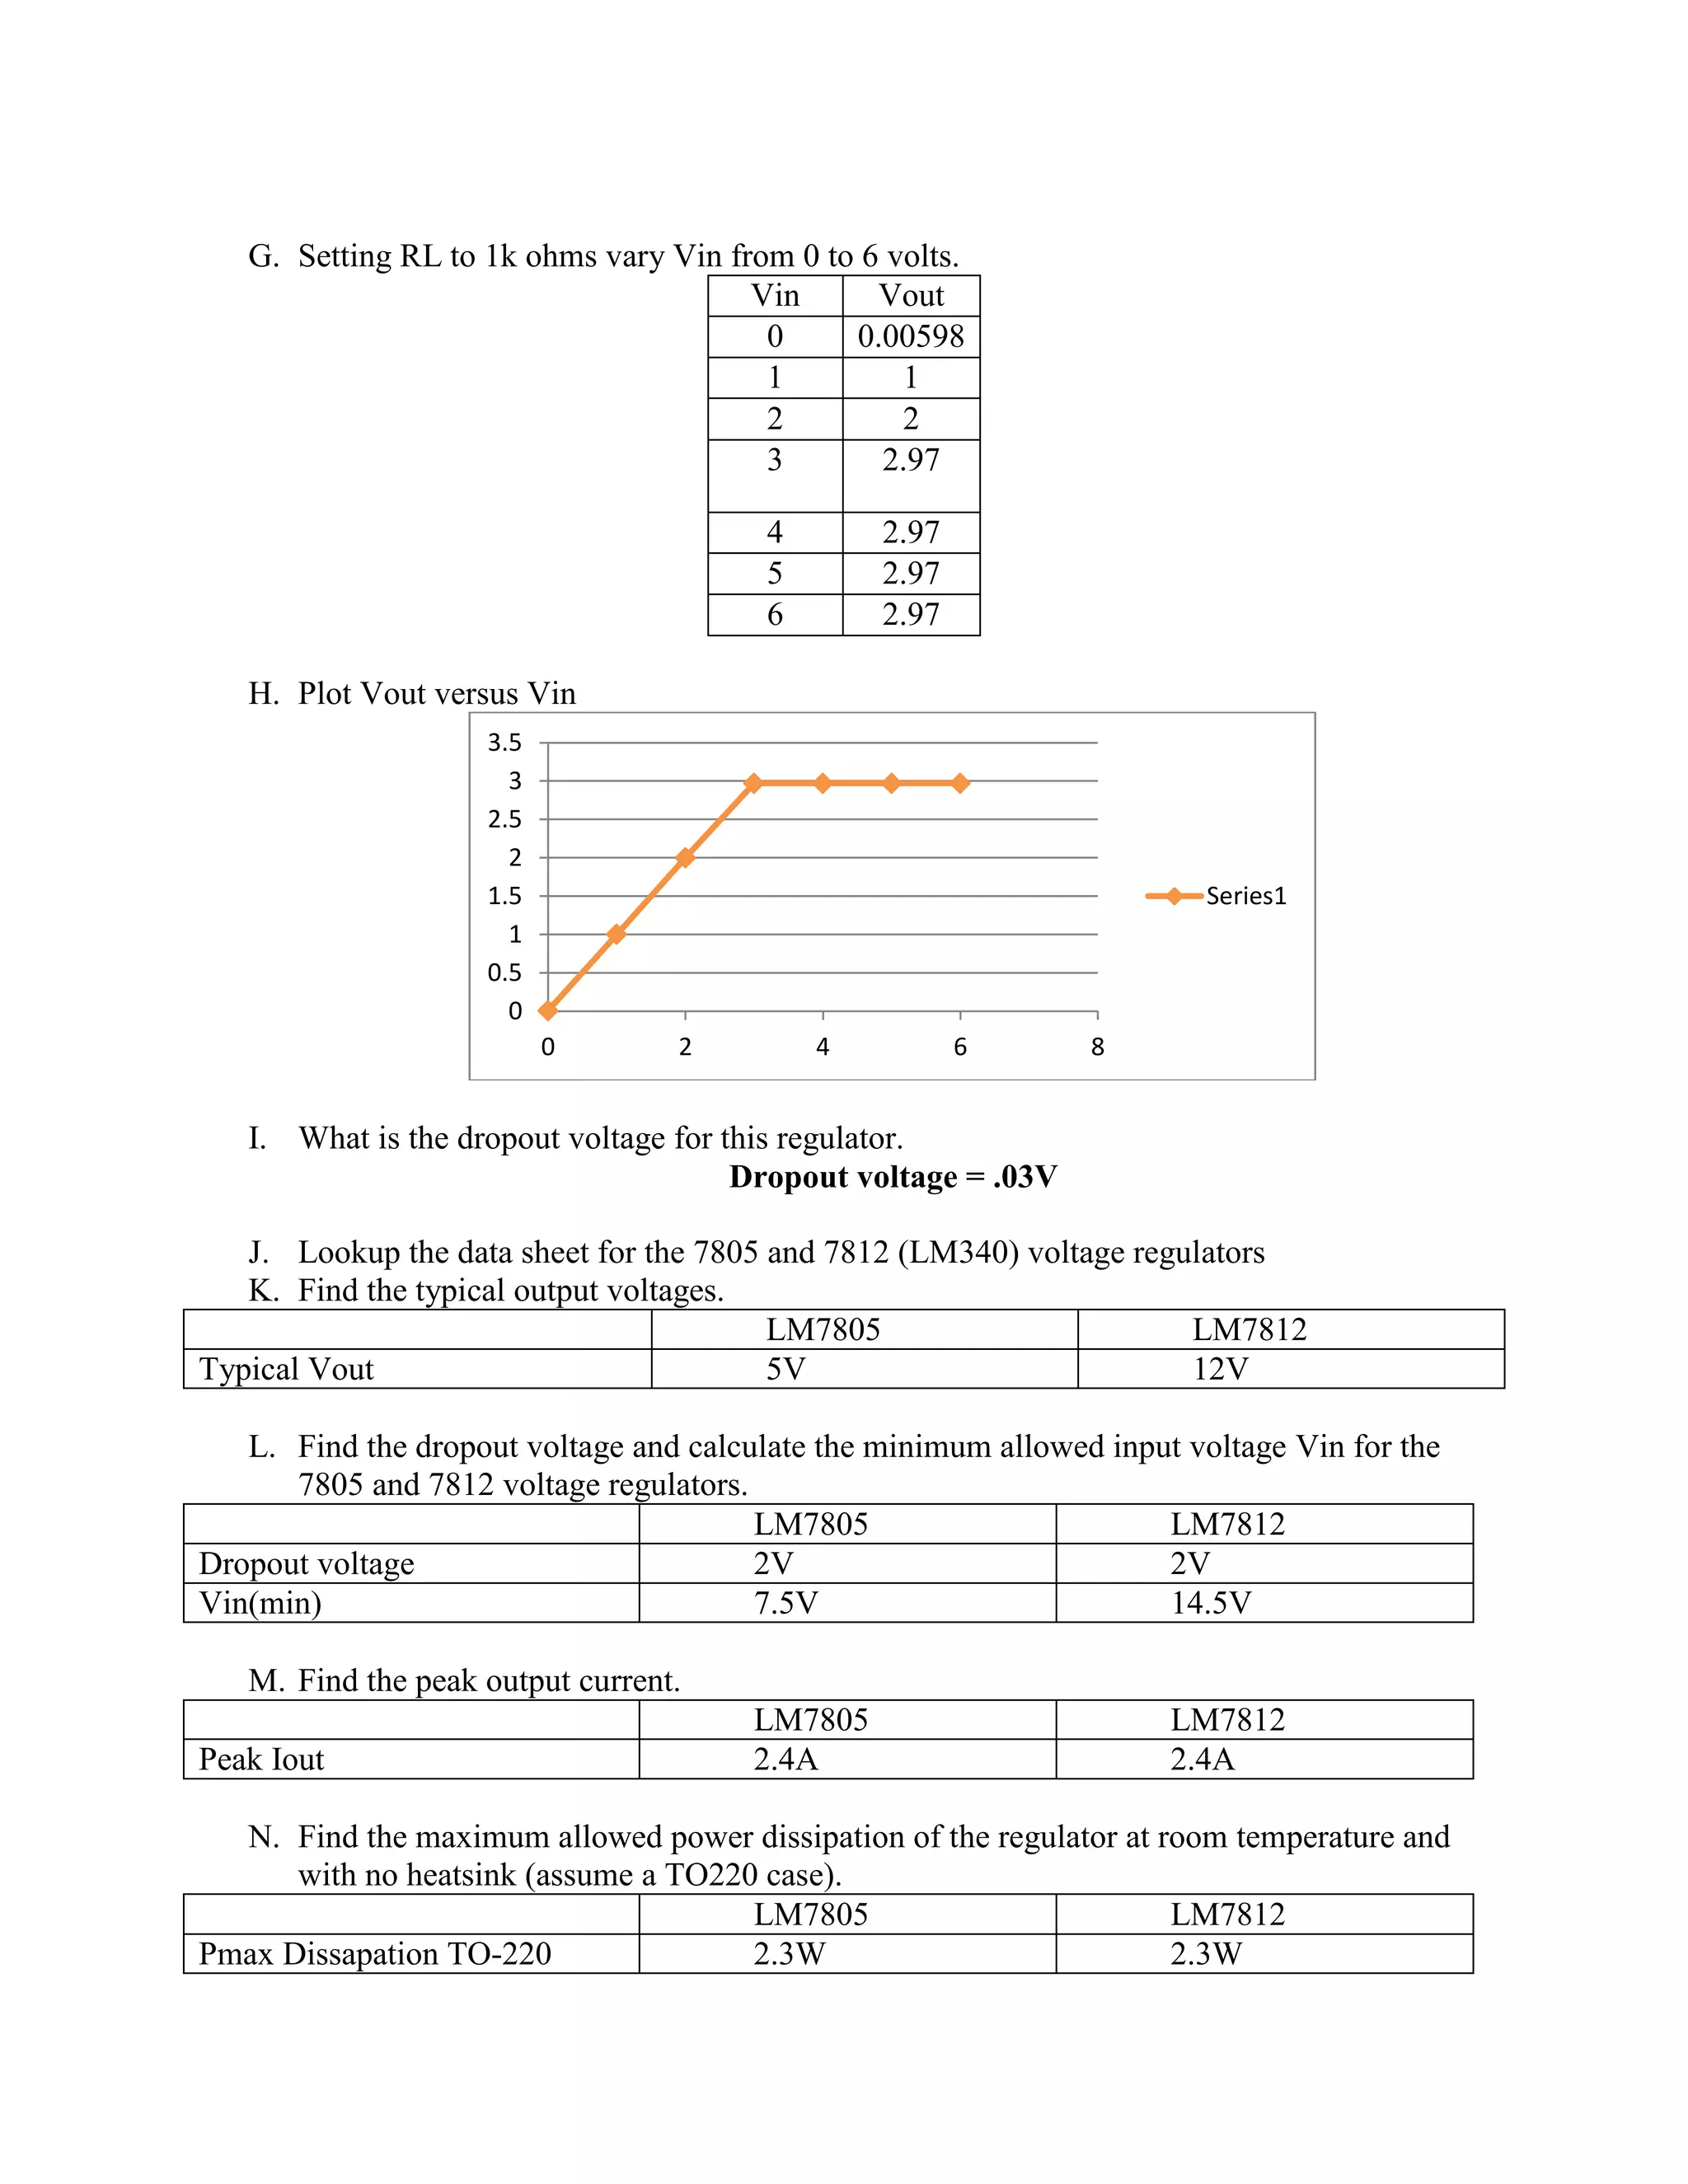
5. Vary the input voltage Vin, between 0 and 6 volts and measure Vout, Iout and Iin.
Vin [V] Vo [V] Iout (mA) Iin
0 0.00434 3.078 0
1 1.003 940.554 0
2 2.001 949.644 0
3 2.998 958.731 0
4 3 967.817 0
5 3 976.901 0
6 3 985.984 0
6. Plot the output voltage Vout as a function of Vin.
7. What is the dropout voltage for this regulator?
.03V
8. Plot the output current Iout as a function of Vin.](https://image.slidesharecdn.com/lab3reportlinearvoltageregulators-180724131814/75/Lab-3-Report-Linear-Voltage-Regulators-5-2048.jpg)
![9. Plot the input current Iin as a function of Vin.
10. Calculate Pin and Pout from steps 6, 7, 8 and 9.
Vin Pin Po ξ = Pout/Pin [%]
0 0 1.3385E-05
1 0.940554 0.943375
2 1.899328 1.900238
3 2.876193 2.874276
4 3.871268 2.90345 75
5 4.884505 2.903703 59.447
6 5.912904 2.956452 50
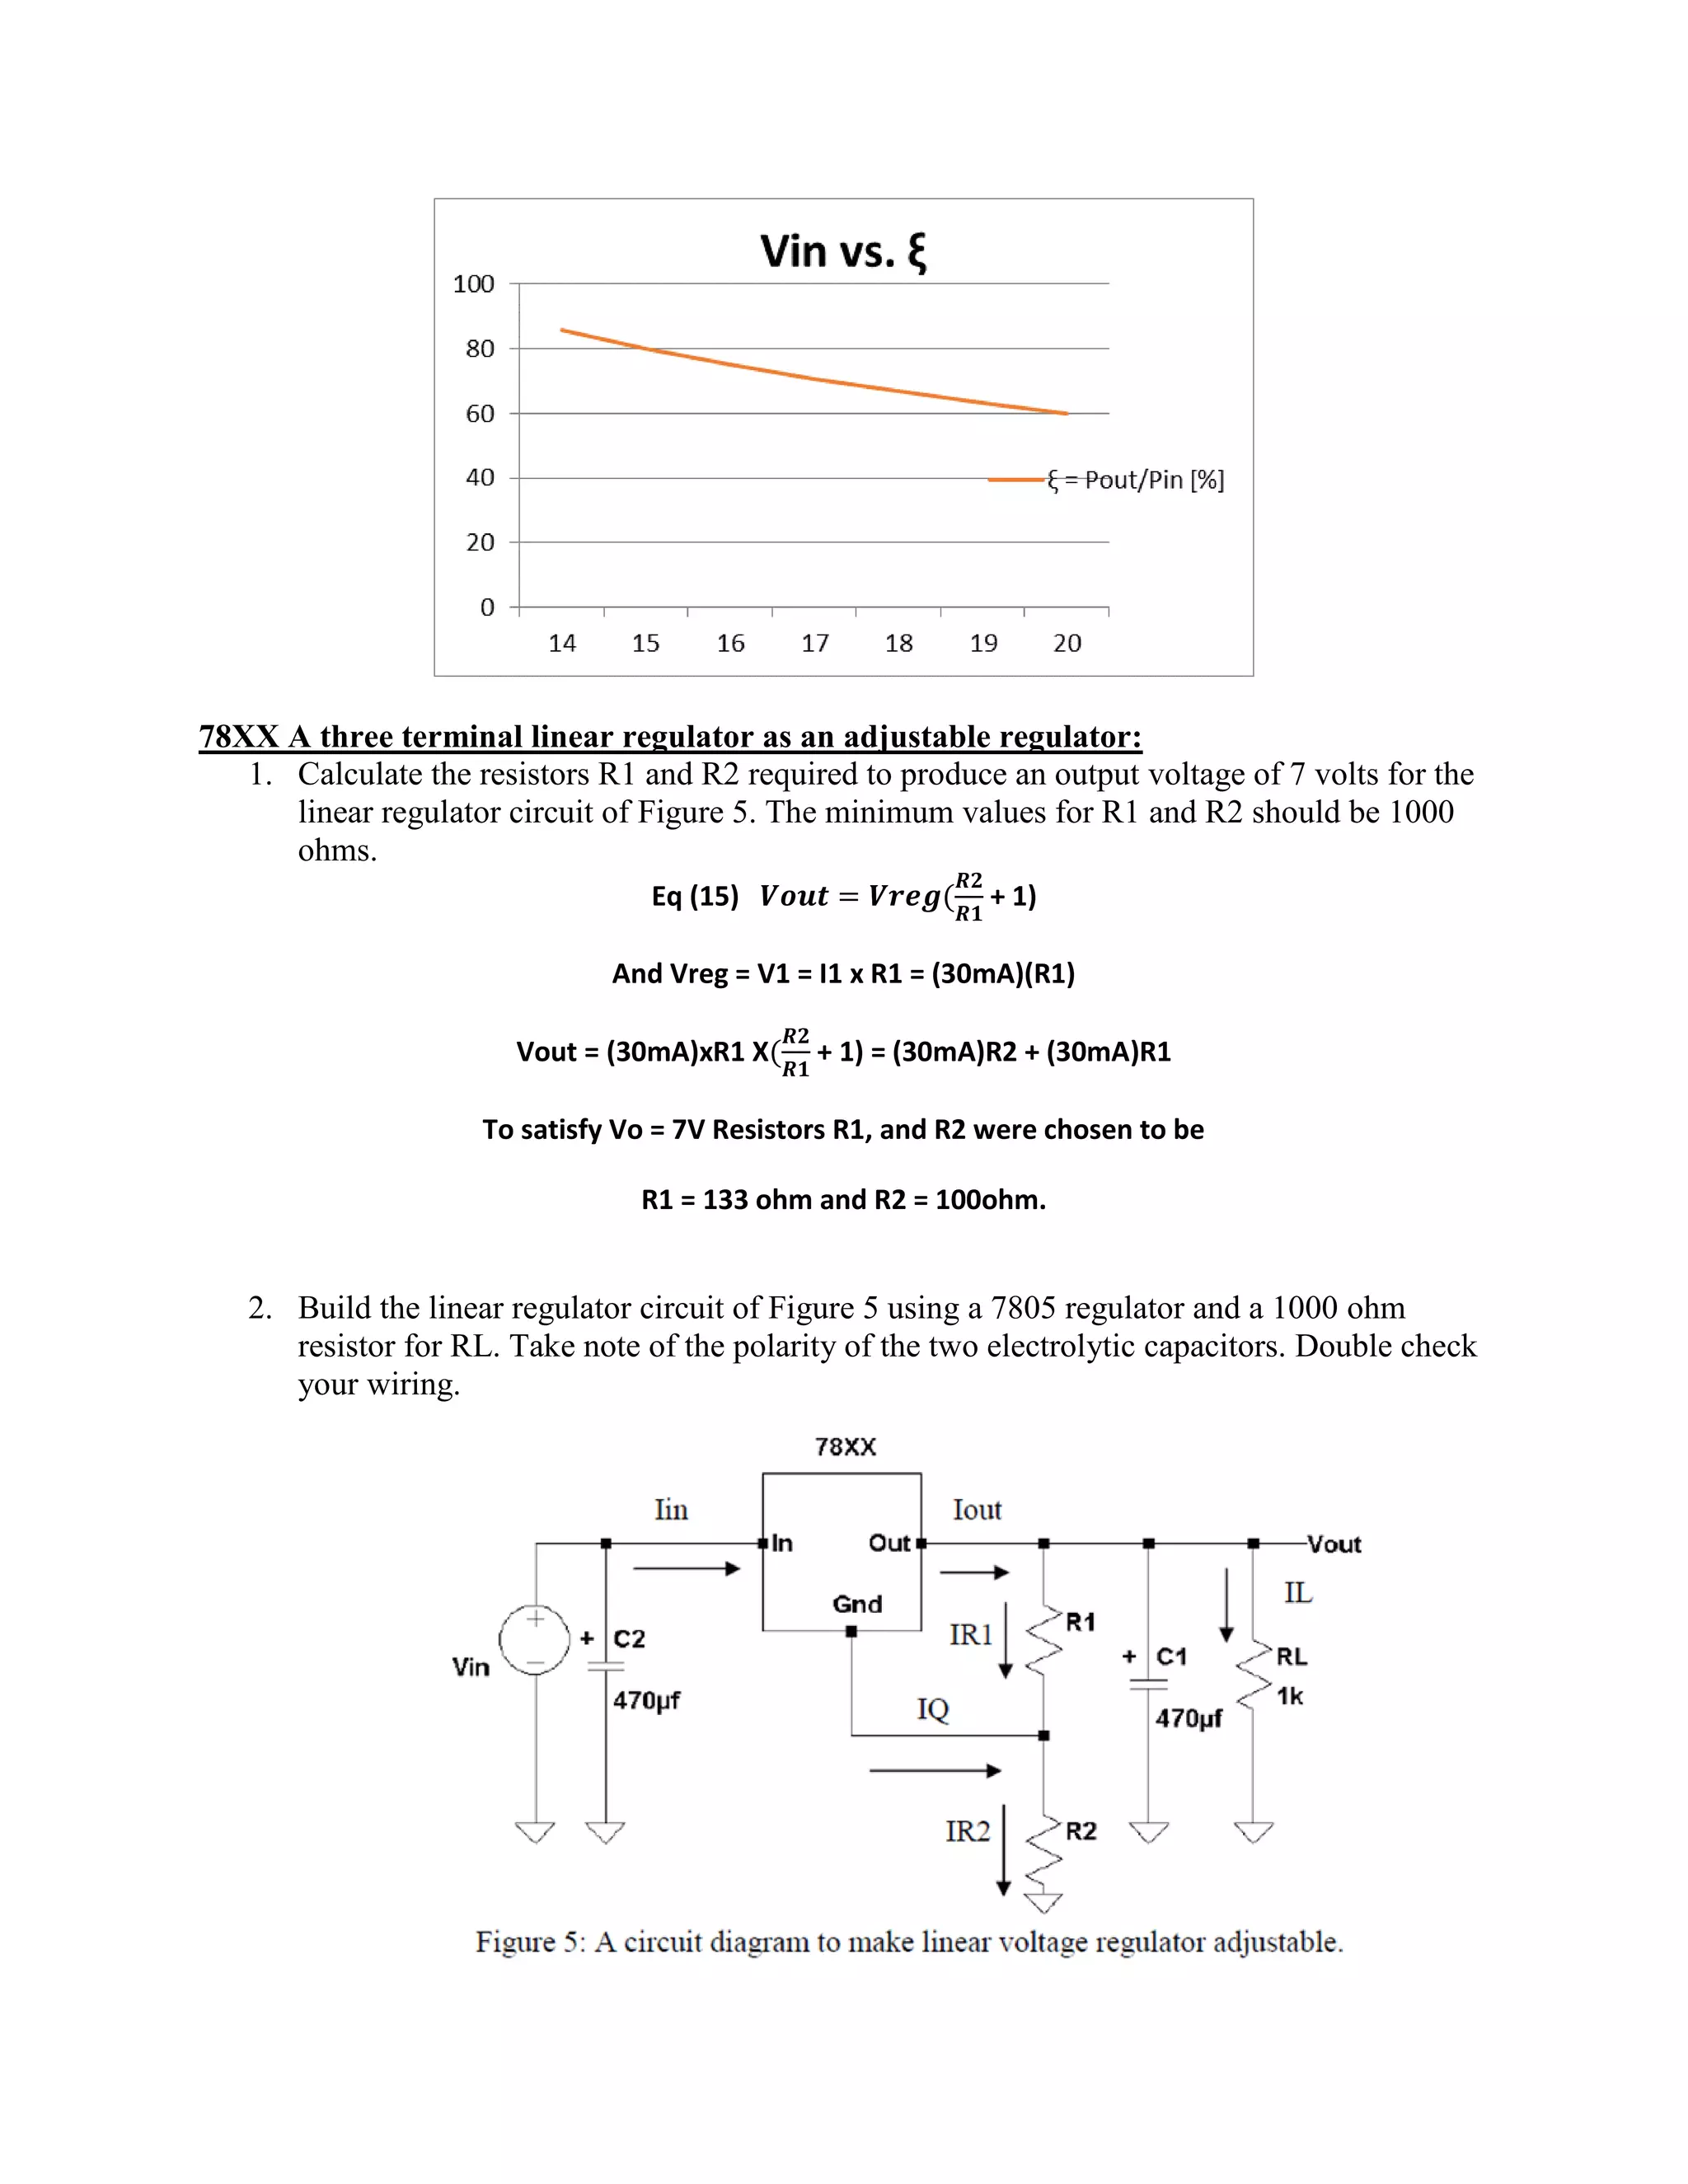
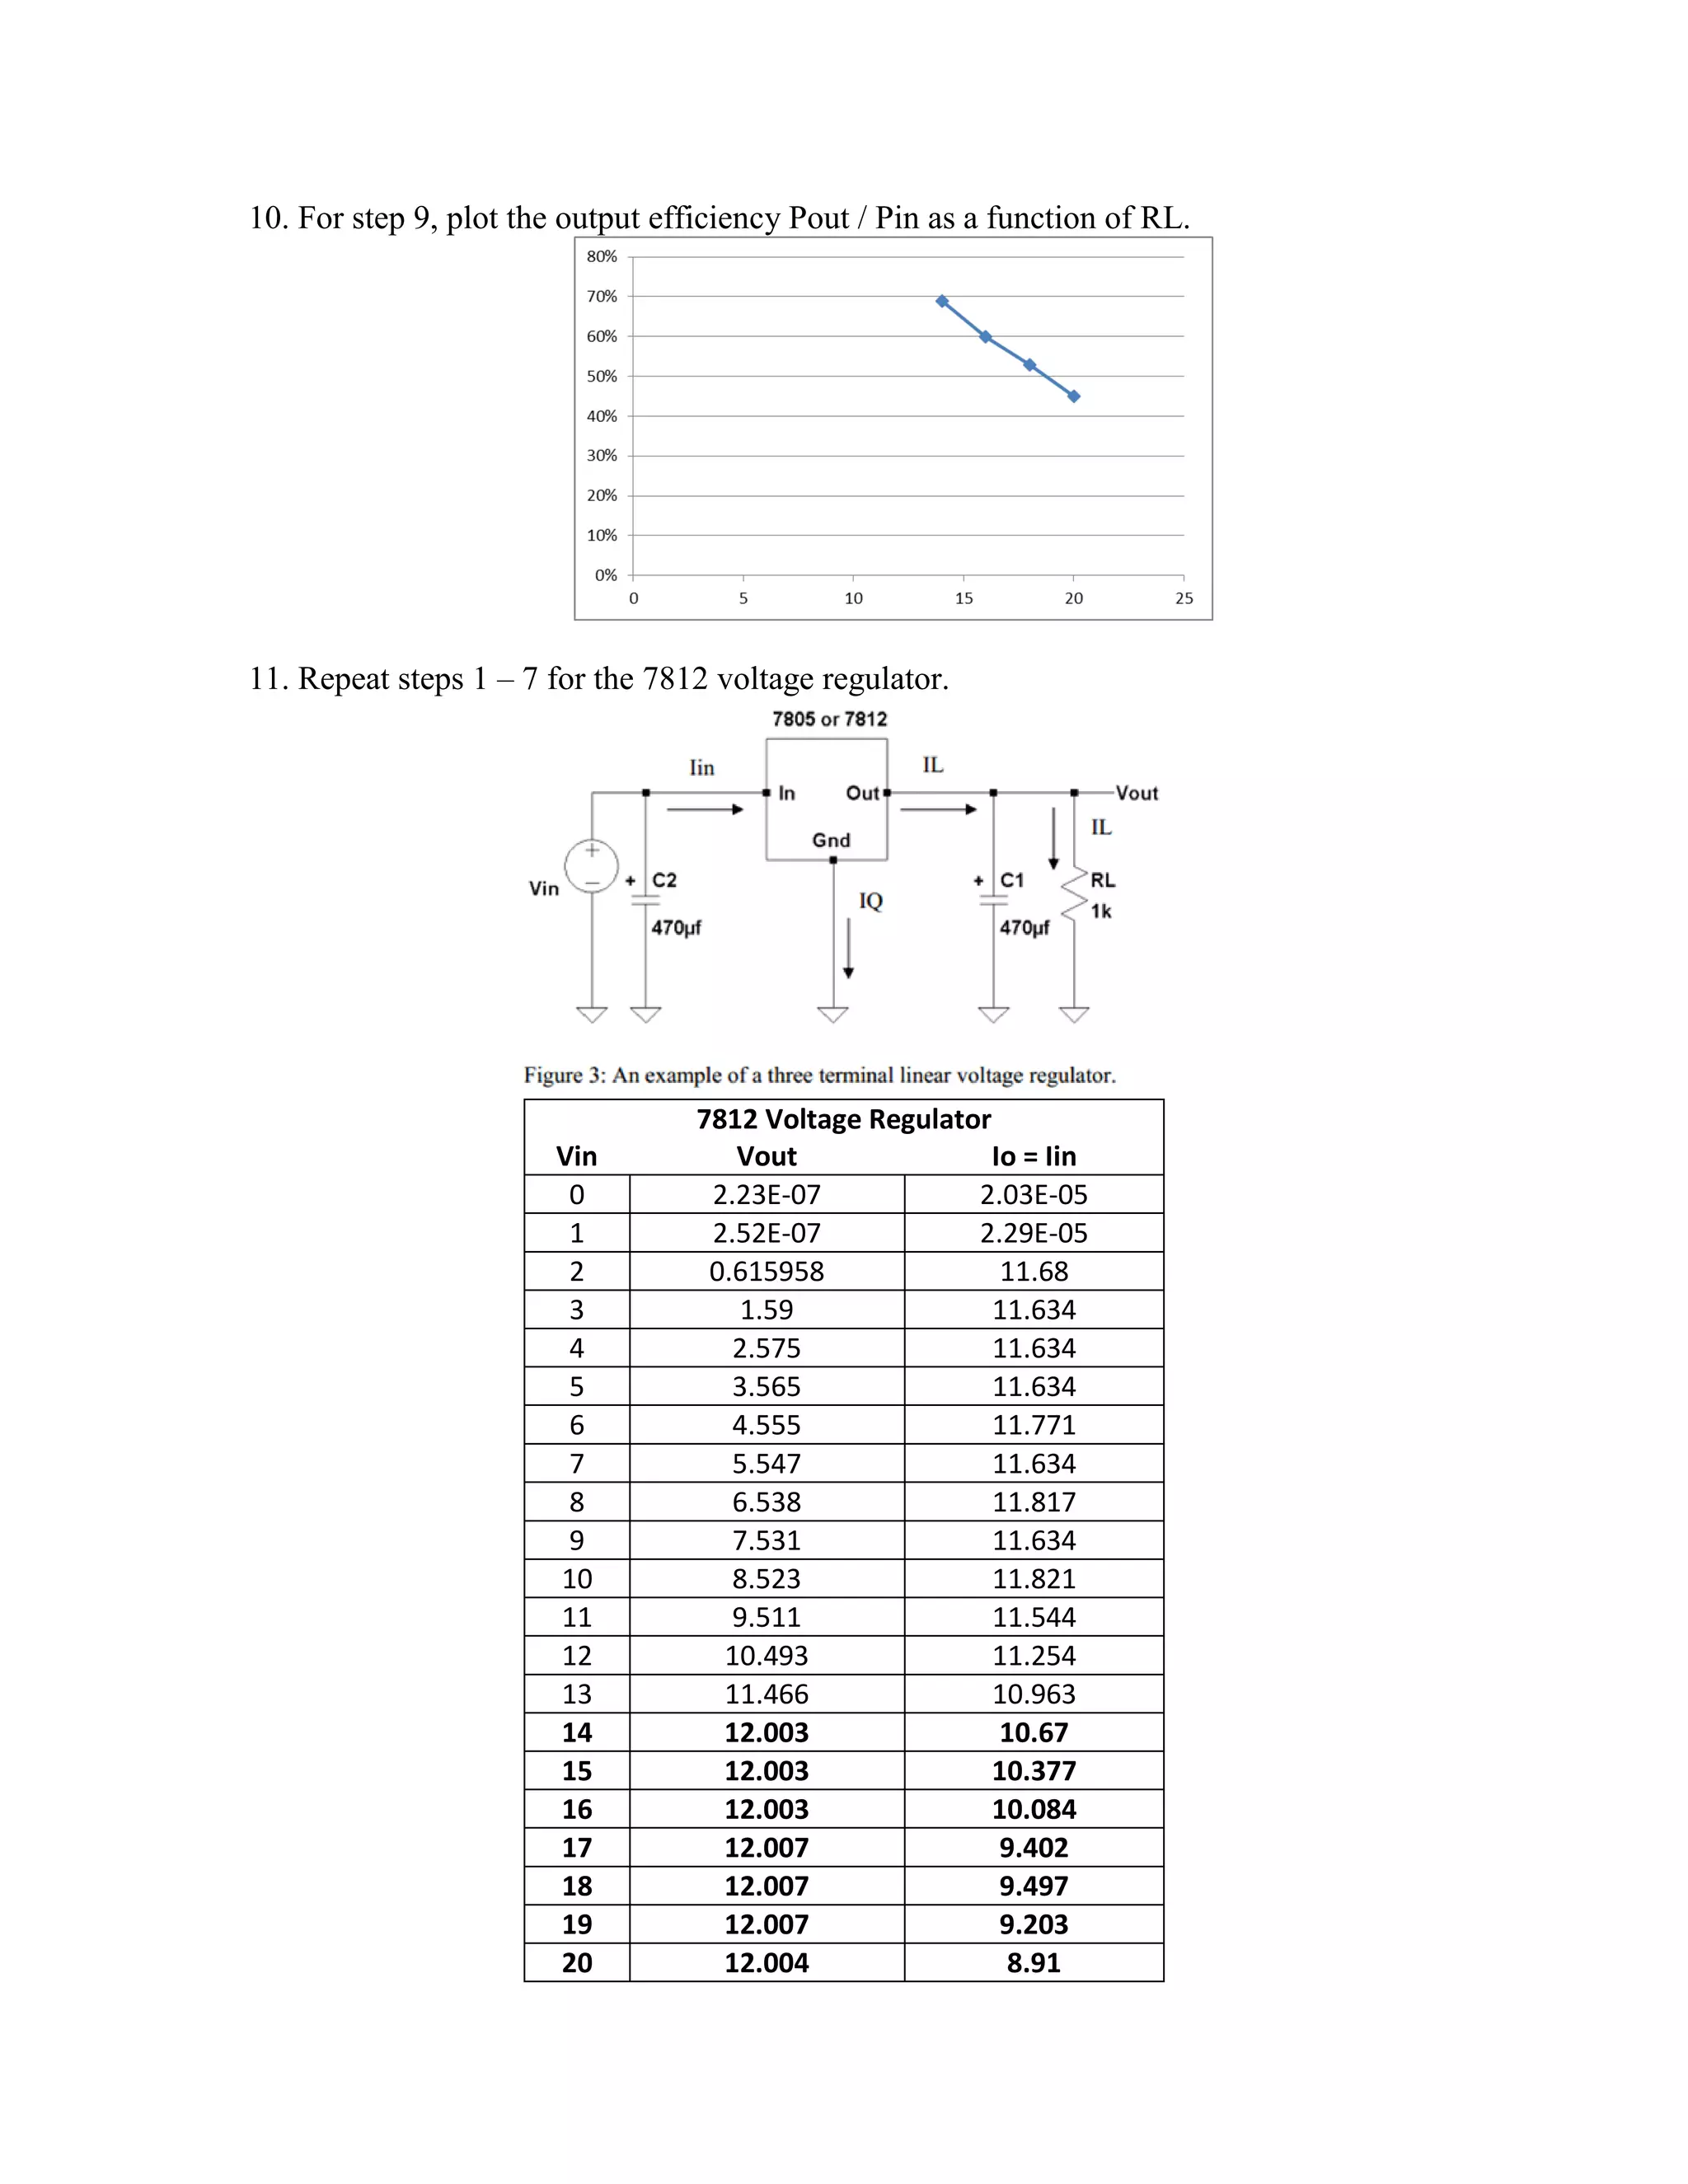
11. For step 5, plot the output efficiency Pout / Pin as a function of Vin once the output
voltage becomes constant.](https://image.slidesharecdn.com/lab3reportlinearvoltageregulators-180724131814/75/Lab-3-Report-Linear-Voltage-Regulators-6-2048.jpg)
![12. Keeping Vin at 6 volts and varying the RL between 100 and 10000 ohms and measure
Vout, Iout, and Iin as a function of Vin. Use 5 different load resistor values.
Vin = 6V
RL (kohm) Vo (V) Iout (mA) Iin
0.1 3.001 985.984 0
2.425 2.98 985.984 0
4.95 2.98 985.984 0
7.575 2.98 985.984 0
10 2.98 985.984 0
13. Calculate the load regulation.
[Vout(no load) – Vout(load)]/Vout(no load) (3-2.98)/3 = .0667%
14. For step 12, plot the output efficiency Pout / Pin as a function of RL.
78XX Three terminal linear regulator:
1. Build this linear regulator circuit of Figure 3 using the 7805 regulator and a 1000 ohm
resistor for RL. Take note of the polarity of the two electrolytic capacitors. Double check
your wiring.](https://image.slidesharecdn.com/lab3reportlinearvoltageregulators-180724131814/75/Lab-3-Report-Linear-Voltage-Regulators-7-2048.jpg)
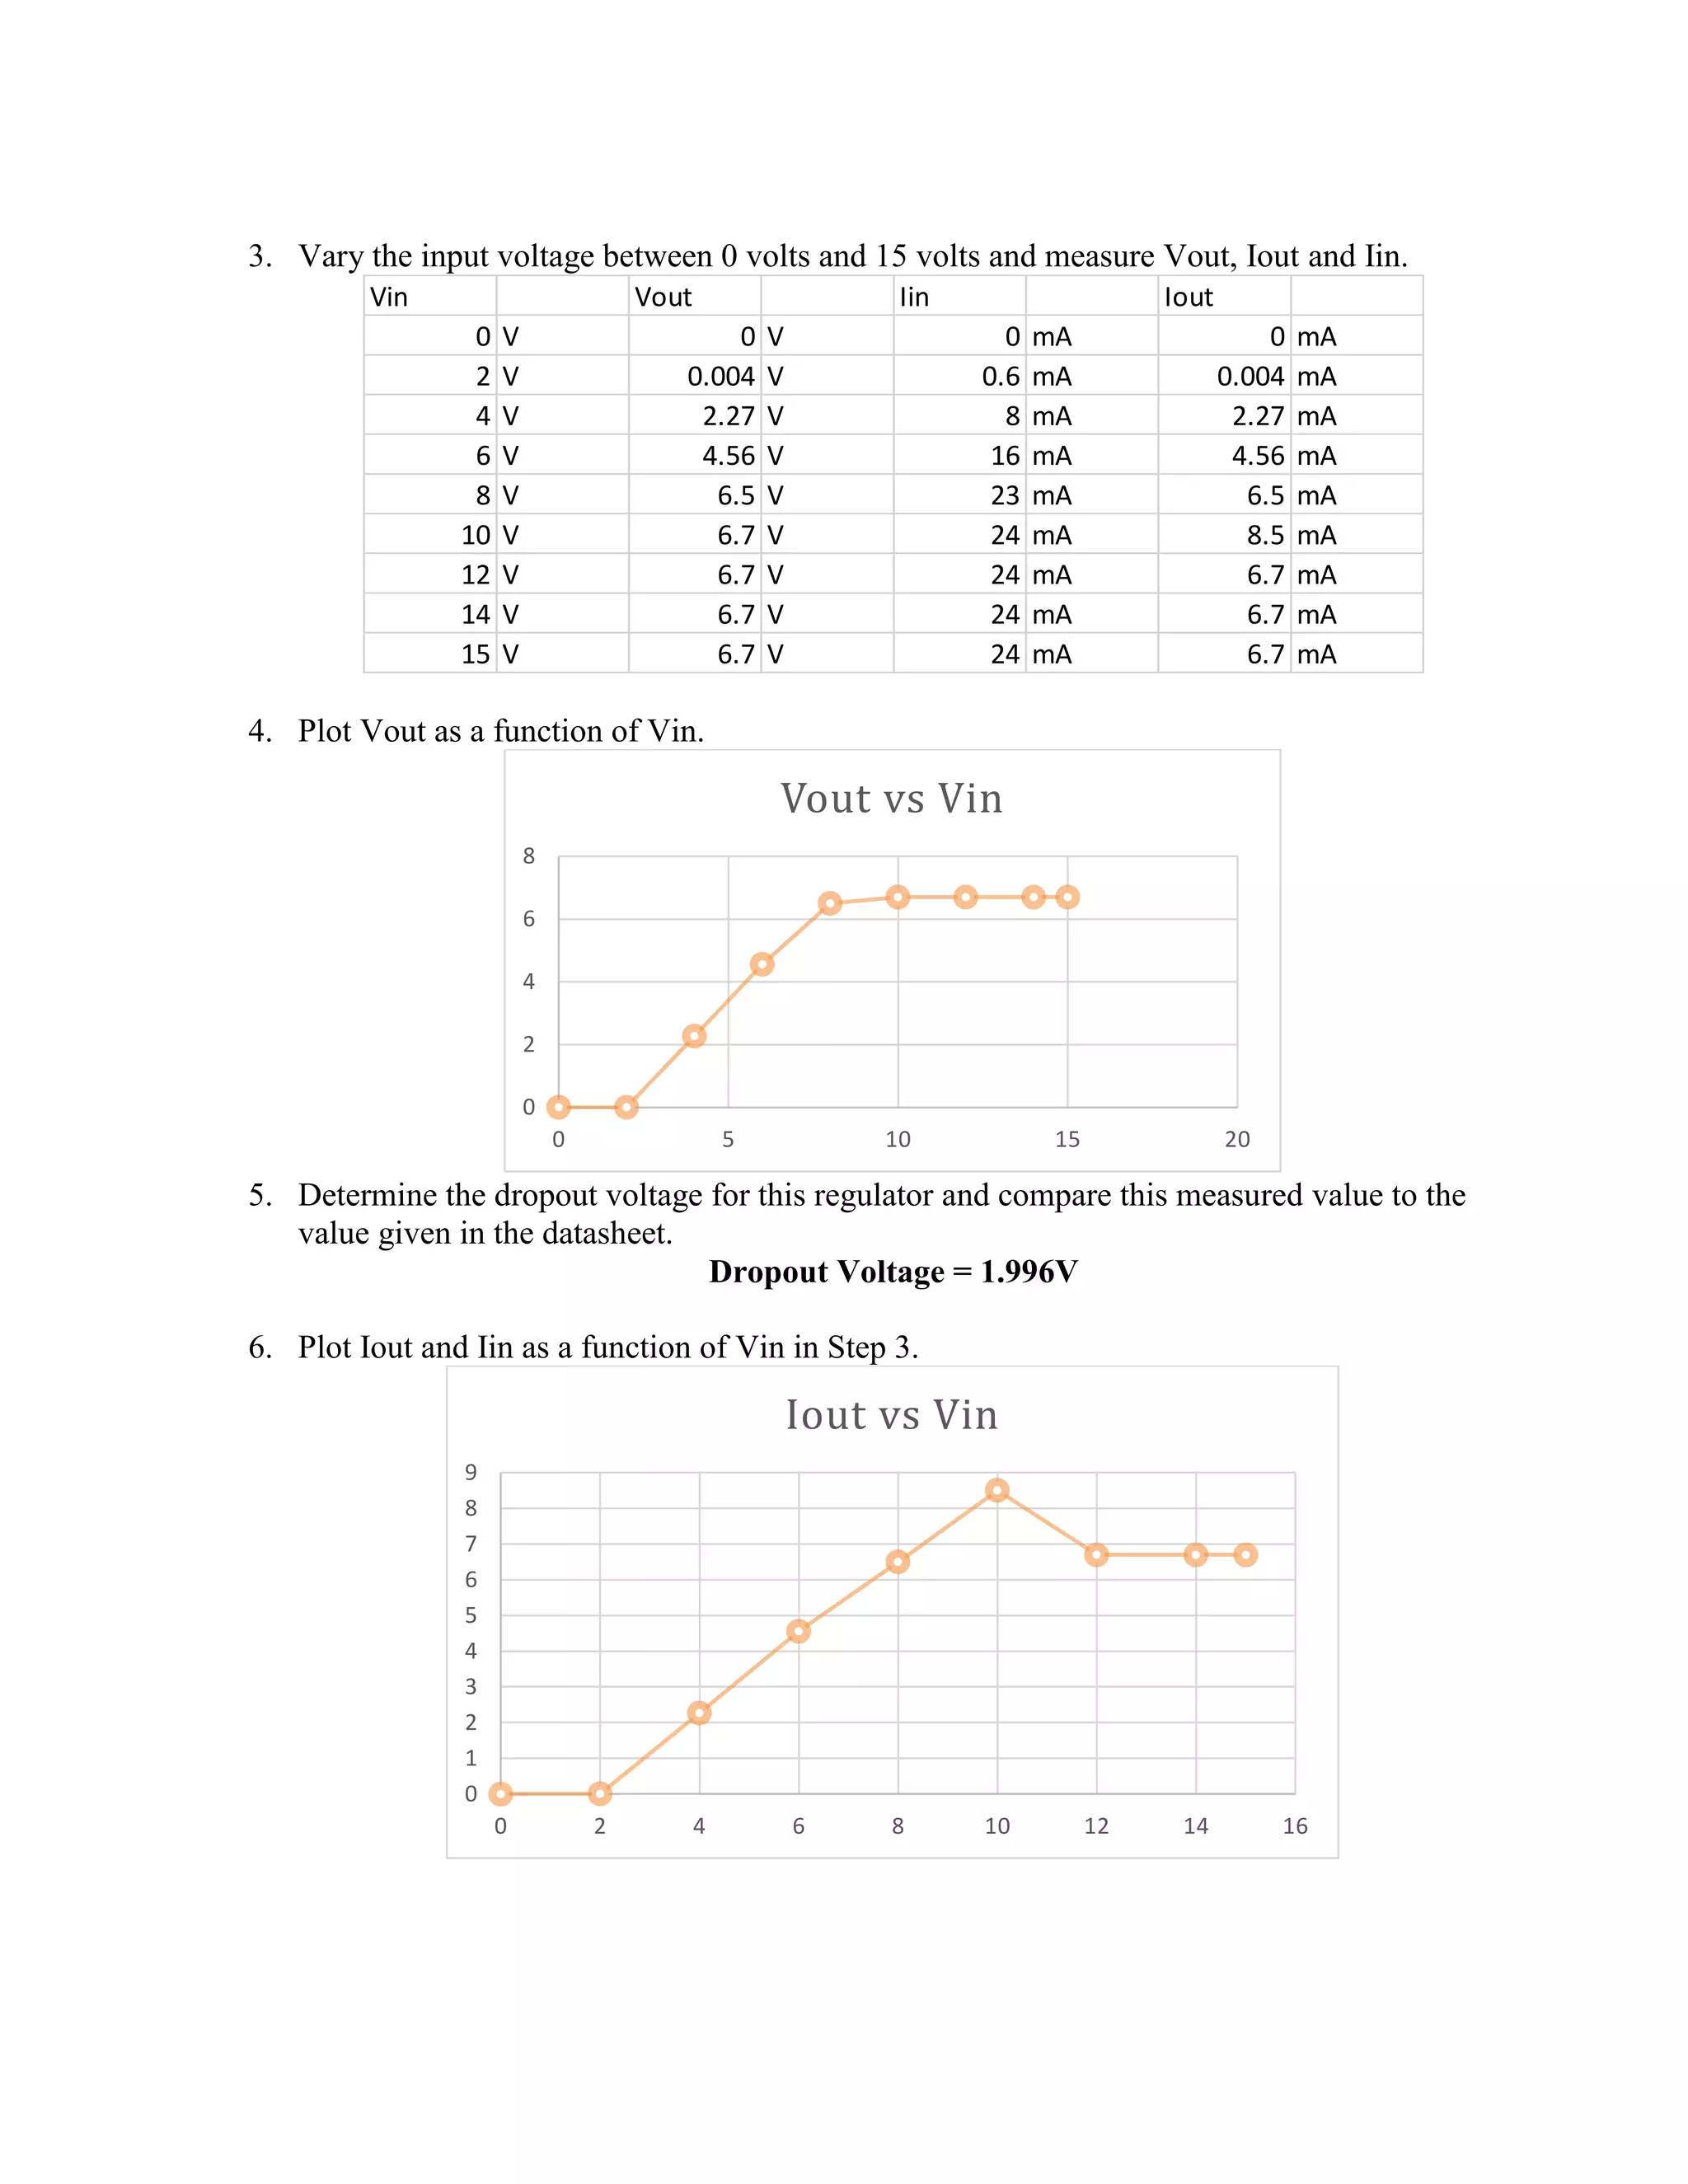
![2. Vary the input voltage between 0 and 20 volts and measure Vout, Iout and Iin.
Vin Vo [V] Io (A)
0 9.26E-08 1.23E-05
1 1.68E-07 2.60E-05
2 5.92E-01 7.11
3 1.561 7.11
4 2.54 7.11
5 3.519 7.11
6 4.485 7.11
7 5.001 7.11
8 5.001 7.11
9 5.001 7.11
10 5.002 7.085
11 5.002 6.901
12 5.002 6.71
13 5.002 6.518
14 5.002 6.325
15 5.003 6.132
16 5.003 5.939
17 5.003 5.746
18 5.003 5.552
19 5.003 5.359
20 5.004 5.166
3. Plot Vout as a function of Vin.
4. What is the dropout voltage for this regulator and compare this measured value to the
value given in the datasheet. 2V](https://image.slidesharecdn.com/lab3reportlinearvoltageregulators-180724131814/75/Lab-3-Report-Linear-Voltage-Regulators-8-2048.jpg)
![5. Plot Iout and Iin as a function of Vin in Step 2.
6. Compute Pin and Pout as a function Vin.
7805 Regulator
Vin Pin Po ξ = Pout/Pin [%]
0 0 1.14E-12 0
1 2.60E-05 4.36E-12 0
2 14.22 4.209 29.6
3 21.33 11.099 52.03
4 28.44 18.059 63.49
5 25.55 25.02 97.93
6 42.66 31.888 74.75
7 49.77 35.557 71.44
8 56.88 35.557 62.51
9 63.99 35.557 55.57
10 70.85 35.439 50.02
11 75.911 34.519 45.47
12 80.52 33.563 41.68
13 84.734 32.603 38.48
14 88.55 31.638 35.73
15 91.98 30.678 33.35
16 95.024 29.713 31.27
17 97.683 28.747 29.43
18 99.936 27.777 27.79
19 101.821 26.811 26.33
20 103.32 25.051 24.25](https://image.slidesharecdn.com/lab3reportlinearvoltageregulators-180724131814/75/Lab-3-Report-Linear-Voltage-Regulators-9-2048.jpg)
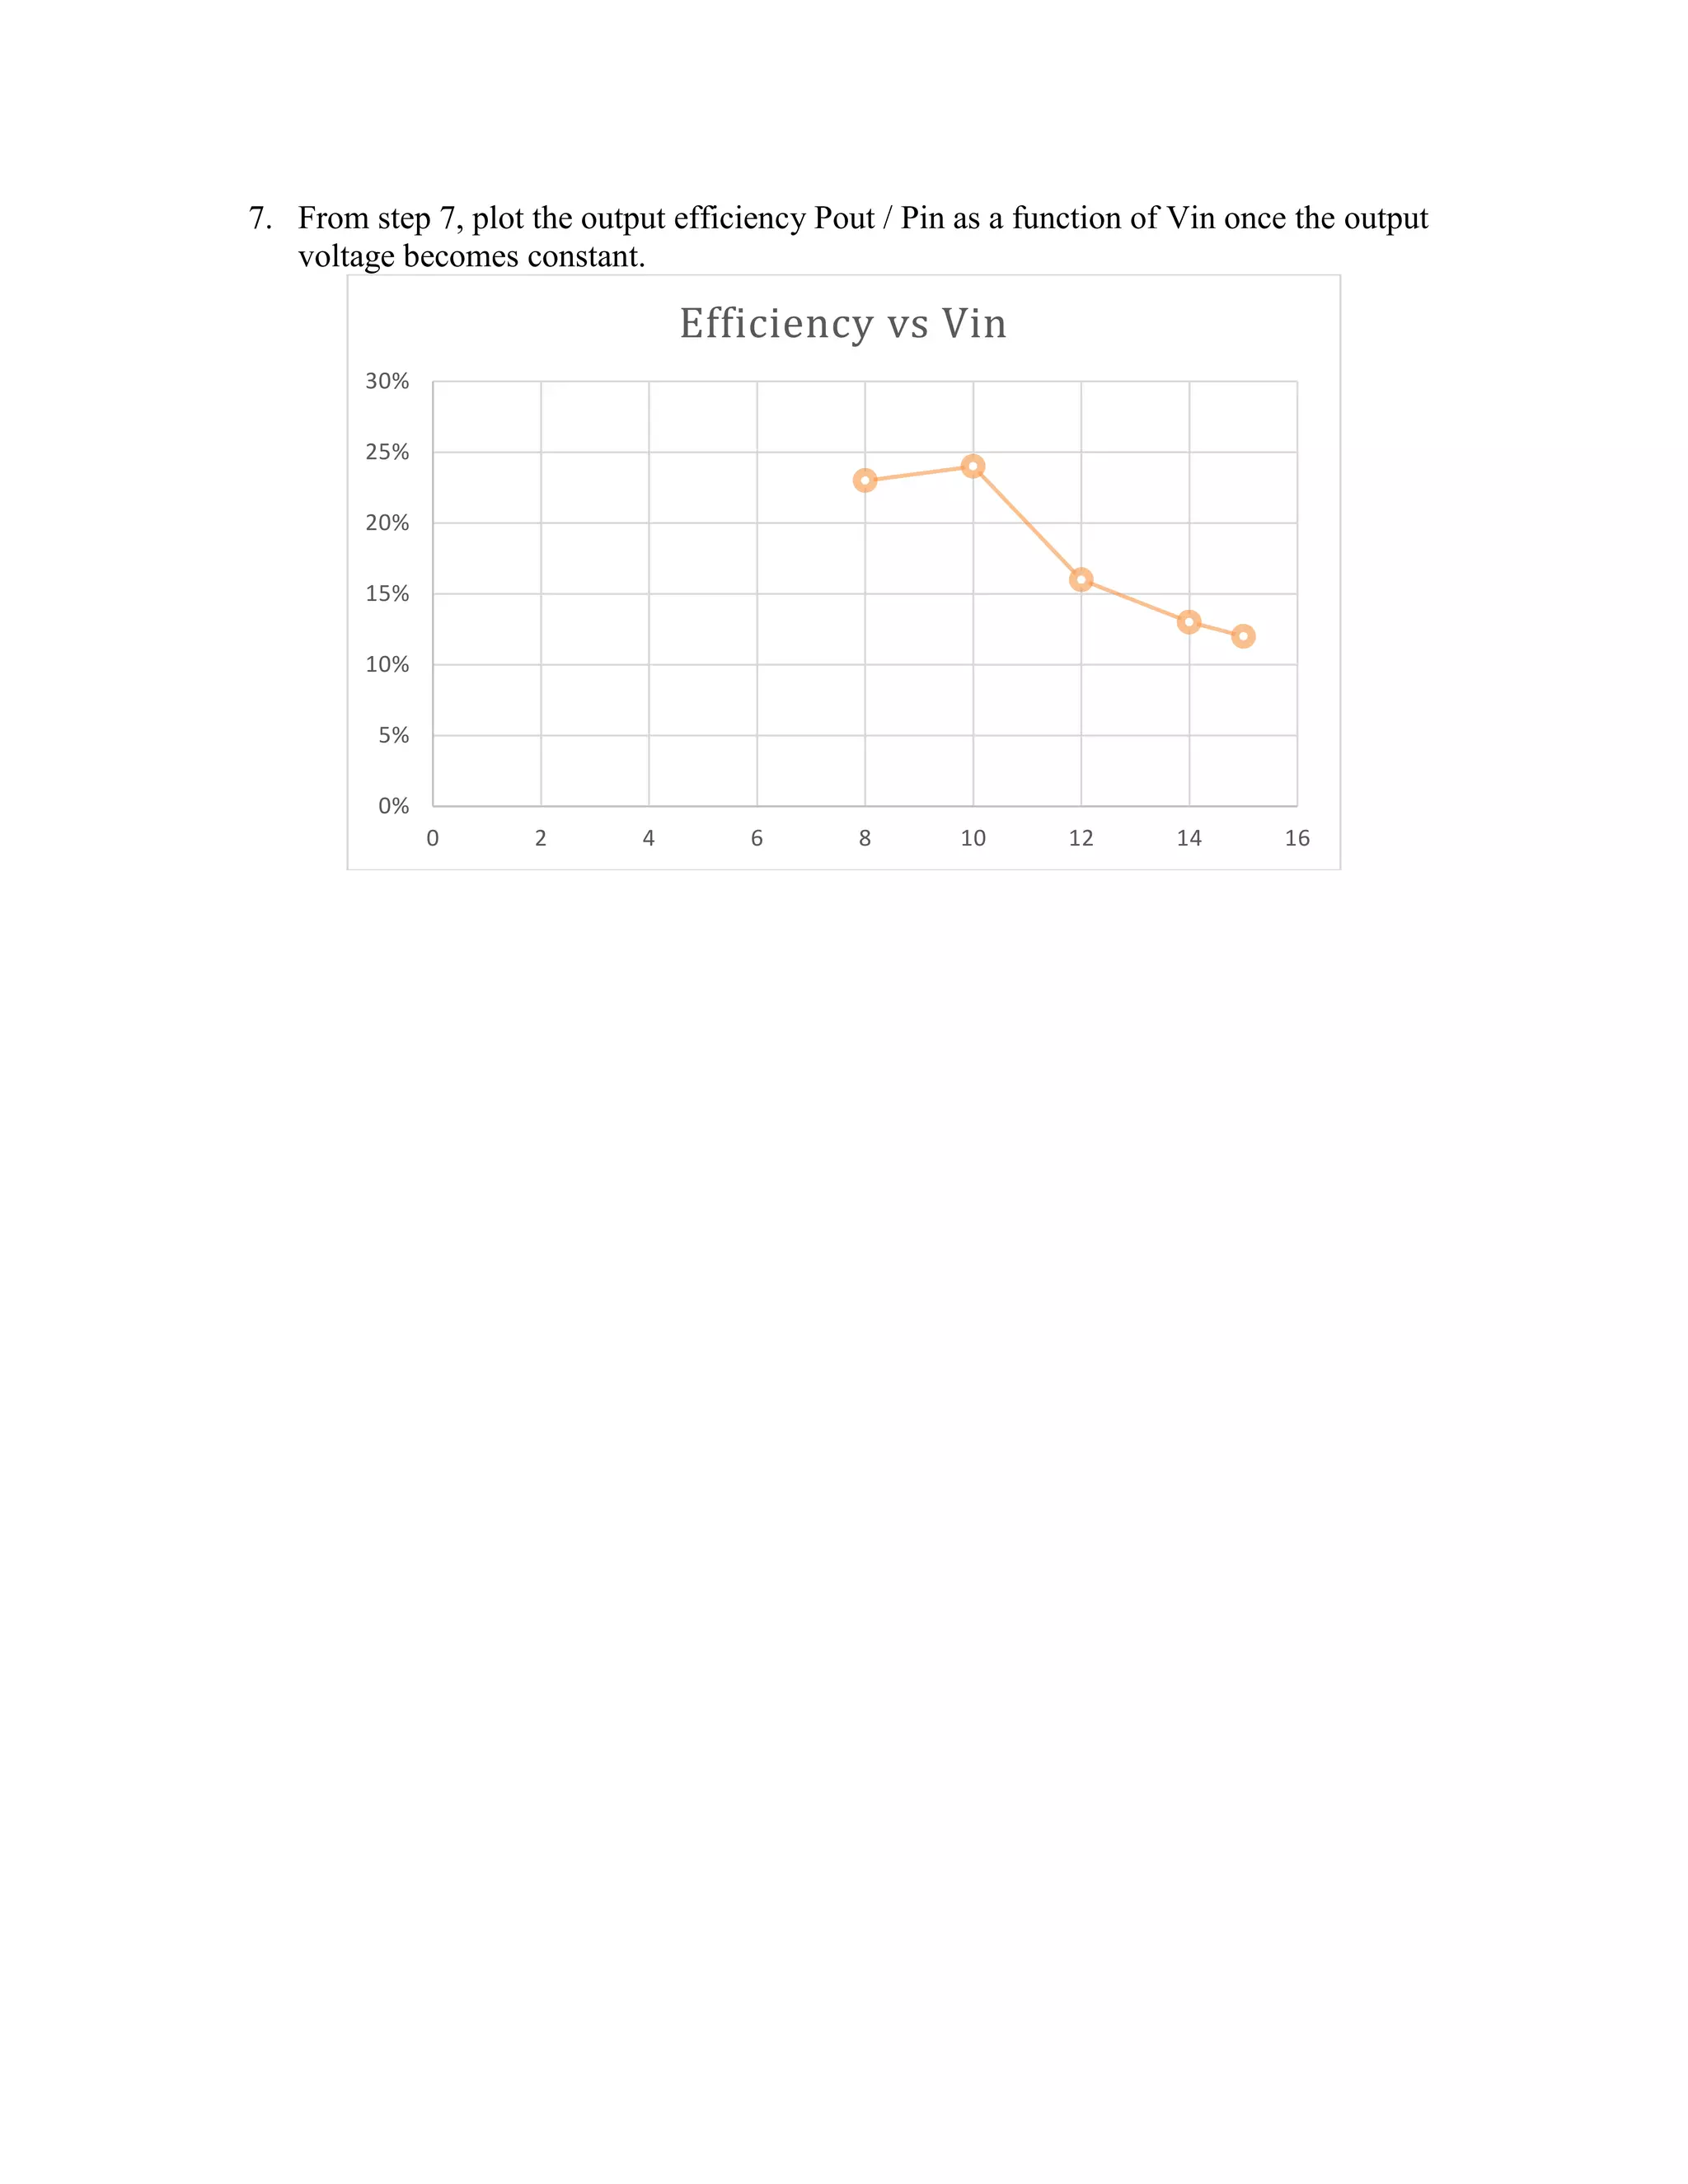
![7. From step 6, plot the output efficiency Pout / Pin as a function of Vin once the output
voltage becomes constant.
8. Keeping Vin at 15 volts and varying the RL between 100 and 10000 ohms, measure
Vout, Iout and Iin as a function of RL. Use 5 different load resistor values.
Vin = 15V
RL (kohm) Vo (V) Iout (mA) Iin
0.1 5.002 6.132 0
2.425 5.003 6.132 0
4.95 5.003 6.132 0
7.575 5.003 6.132 0
10 5.003 6.132 0
9. Compute Pin and Pout as a function RL
Vin = 15V
RL [kohm] Pin Po ξ = Pout/Pin [%]
0.1 91.98 30.672 33.35
2.425 " 30.678 33.35
4.95 " " "
7.575 " " "
10 " " "
0
10
20
30
40
50
60
70
80
7 8 9 10 11 12 13 14 15 16 17 18 19 20
Series2](https://image.slidesharecdn.com/lab3reportlinearvoltageregulators-180724131814/75/Lab-3-Report-Linear-Voltage-Regulators-10-2048.jpg)
![Vd = Vi – Vo = 14 – 12.003 = 1.997
7812 Voltage Regulator
Vin Pin Po ξ = Pout/Pin [%]
0 0 4.53E-12 0
1 2.29E-05 5.76E-12 0
2 23.36 7.194 31
3 34.902 18.498 53
4 46.536 29.958 64
5 58.17 41.475 71
6 70.626 53.617 76
7 81.438 64.534 79
8 94.536 77.26 82
9 104.706 87.616 84
10 118.21 100.75 85
11 126.984 109.795 86
12 135.048 118.088 87
13 142.519 125.702 88
14 149.38 128.072 85.74
15 155.655 124.555 80.02
16 161.344 121.038 75.02
17 159.834 112.89- 70.63
18 170.946 114.03 66.71
19 174.857 110.5 63.19
20 178.2 106.956 60.02](https://image.slidesharecdn.com/lab3reportlinearvoltageregulators-180724131814/75/Lab-3-Report-Linear-Voltage-Regulators-12-2048.jpg)