The document summarizes an experiment that tested and characterized first-order and fourth-order low pass filters. Key findings include:
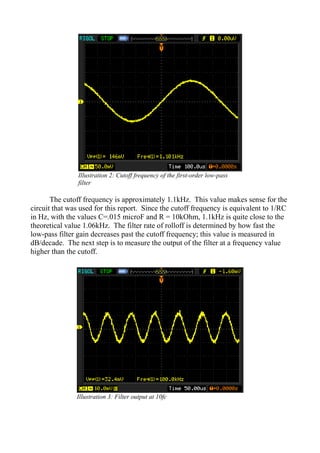
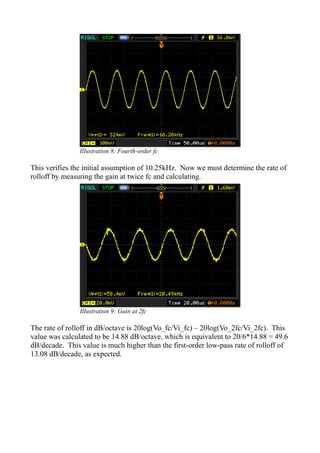
- The cutoff frequency was measured to be 1.1 kHz for the first-order filter and 10.2 kHz for the fourth-order filter, close to theoretical calculations.
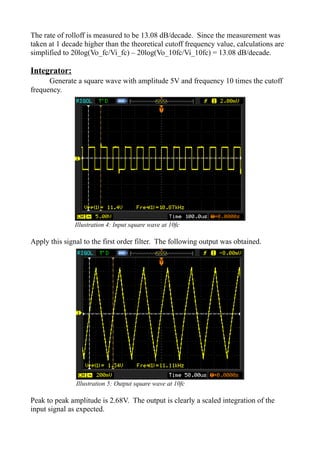
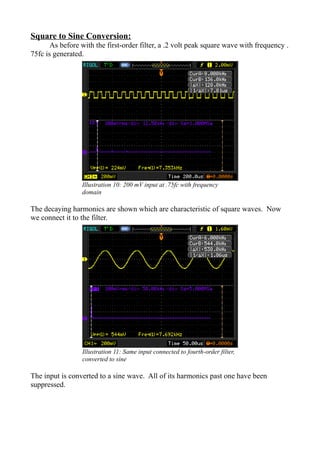
- The first-order filter had a rolloff rate of 13.08 dB/decade while the fourth-order was 49.6 dB/decade as expected for higher order filters.
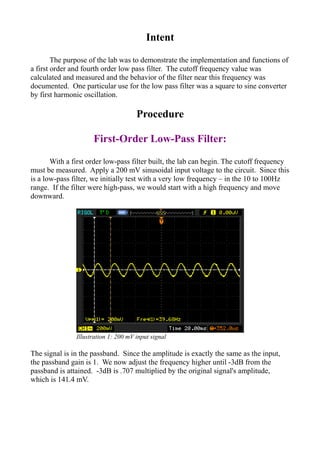
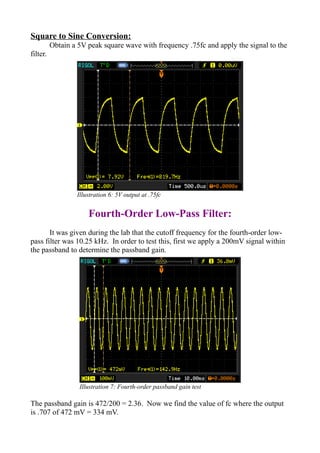
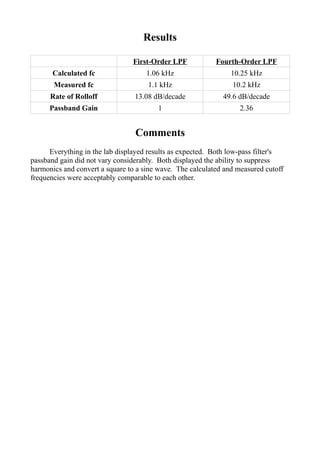
- Both filters were able to suppress harmonics and convert a square wave input to a sine wave output as intended applications of low pass filters.