SlideShare a Scribd company logo
L9b-1
Slides courtesy of Prof M L Kraft, Chemical & Biomolecular Engr Dept, University of Illinois, Urbana-Champaign.
Review: Analysis of Rate Data
• Constant-volume batch reactor for homogeneous reactions: make
concentration vs time measurements during unsteady-state operation
• Differential reactor for solid-fluid reactions: monitor product concentration
for different feed conditions during steady state operation
Goal: determine reaction order, a, and specific reaction rate constant, k
• Data collection is done in the lab so we can simplify BMB, stoichiometry,
and fluid dynamic considerations
• Want ideal conditions → well-mixed (data is easiest to interpret)
 Method of Excess
 Differential method
 Integral method
 Half-lives method
 Initial rate method
 Differential reactor
 More complex kinetics
L9b-2
Slides courtesy of Prof M L Kraft, Chemical & Biomolecular Engr Dept, University of Illinois, Urbana-Champaign.
A
A
dC
kC
dt
a
 
A  products
  1 1
A A0
1 1 1
t
k 1 C C
a a
a  
 
 
 
 
  
A A0 1 2
1
C C at t = t
2

 
1
1 2 1
A0
2 1 1
t
k 1 C
a
a
a


 

  
 
  
   
 
1
1 2 A0
2 1
ln t ln 1 lnC
k 1
a
a
a


  

ln (t1/2)
ln CA0
Slope = 1- a
A A
r kC a
 
Plot ln(t1/2) vs ln CA0. Get a straight
line with a slope of 1-α
Review: Method of Half-lives
Half-life of a reaction (t1/2): time it takes
for the concentration of the reactant to
drop to half of its initial value
L9b-3
Slides courtesy of Prof M L Kraft, Chemical & Biomolecular Engr Dept, University of Illinois, Urbana-Champaign.
Review: Method of Initial Rates
• When the reaction is reversible, the method of initial
rates can be used to determine the reaction order and
the specific rate constant
• Very little product is initially present, so rate of reverse
reaction is negligible
– A series of experiments is carried out at different initial
concentrations
– Initial rate of reaction is determined for each run
– Initial rate can be found by differentiating the data and
extrapolating to zero time
– By various plotting or numerical analysis techniques relating -rA0
to CA0, we can obtain the appropriate rate law:
A0 A0
r kC a
 
L9b-4
Slides courtesy of Prof M L Kraft, Chemical & Biomolecular Engr Dept, University of Illinois, Urbana-Champaign.
Conversion of reactants
& change in reactant
concentration in the bed
is extremely small
Review: Differential Catalyst Bed
FA0
Cp
CA0
FAe
Fp
W
L
r’A: rate of reaction per unit mass of catalyst
flow in - flow out + rate of gen = rate of accum.
A0 Ae A
F F r W 0

   
A0 Ae 0 A0 Ae
A
F F C C
r
W W
 
 

  
 
When constant flow rate, 0 = :
  0 p
0 A0 Ae
A
C
C C
r
W W

 

  
 
Product
concentration
The reaction rate is determined by measuring
product concentration, Cp
L9b-5
Slides courtesy of Prof M L Kraft, Chemical & Biomolecular Engr Dept, University of Illinois, Urbana-Champaign.
Review: Multiple Rxns & Selectivity
A B C
k1 k2
A
C
B
k2
k1
2) Series rxns
3) Complex rxns
1) Parallel / competing rxns
Desired product
A+B C+D A+C E
k1 k2
D
D U
U
F molar flow rate of desired product
S
F molar flow rate of undesir
Exit
E ed pr
x oduct
it
 
D
D U
U
N moles of desired product
S
N moles of undes
Fi
ir
nal
Fi ed pr u
nal od ct
 
instantaneous rate selectivity, SD/U
D
D U
U
r
rate of formation of D
S
rate of formation of U r
 
overall rate selectivity,
D U
S
D
D
A
r
rate of formation of D
Y
rate of consumption of A r
 

instantaneous yield, YD
(at any point or time in reactor)
overall yield,
D
Y
D
D
A0 A
F
Y
F F


flow
D
D
A0 A
N
Y
N N


batch
at
exit
at
tfinal
Maximize selectivity / yield to maximize production of desired product
L9b-6
Slides courtesy of Prof M L Kraft, Chemical & Biomolecular Engr Dept, University of Illinois, Urbana-Champaign.
Review: Maximizing SD/U for
Parallel Rxns
 
 
E E
D U
D RT 1 2 1 2
D U A B
U
A
S e C C
A
a a  
 
 

What reactor conditions and
configuration maximize selectivity?
a) If ED > EU
Specific rate of desired reaction kD increases:
Use higher temperature
b) If ED < EU
less rapidly with increasing T
Use lower temperature(not so low
that the reaction rate is tiny)
more rapidly with increasing T
To favor production of the desired product
1 2 1 2
a) 0
a a a a
   
Now evaluate concentration:
→ Use large CA
1 2 1 2
b) 0
a a a a
   
→ Use small CA
1 2 1 2
c) 0
   
   
→ Use large CB
1 2 1 2
d) 0
   
   
→ Use small CB
L9b-7
Slides courtesy of Prof M L Kraft, Chemical & Biomolecular Engr Dept, University of Illinois, Urbana-Champaign.
Concentration Requirements &
Reactor Selection
CA00
CB00
CA0
CB0
How do concentration requirements play
into reactor selection?
CSTR:
concentration is
always at its
lowest value
(that at outlet)
PFR
PFR (or PBR): concentration is
high at the inlet & progressively
drops to the outlet concentration
CA(t)
CB(t)
D
kD
A+B
U
kU
Batch:
concentration is
high at t=0 &
progressively drops
with increasing time
Semi-batch: concentration
of one reactant (A as
shown) is high at t=0 &
progressively drops with
increasing time, whereas
concentration of B can be
kept low at all times
CB0
CA
L9b-8
Slides courtesy of Prof M L Kraft, Chemical & Biomolecular Engr Dept, University of Illinois, Urbana-Champaign.
D
kD
A+B
U
kU
1  2
High CB
favors
desired
product
formation
1  2
High CB
favors
undesired
product
formation
(keep CB
low)
a1  a2
High CA favors desired
product formation
a1  a2
High CA favors undesired
product formation
(keep CA low)
PFR/PBR
Batch reactor
When CA & CB are low (end time
or position), all rxns will be slow
High P for gas-phase rxn, do not
add inert gas (dilutes reactants)
PFR/PBR w/ side streams feeding
low CB CB
←High CA
Semi-batch
reactor, slowly
feed B to large amount of A
CB
CB CB
CSTRs in
series
B consumed before leaving CSTRn
CA00
CB00
CA0
CB0
CSTR
PFR/PBR
PFR/PBR
w/ high
recycle
• Dilute feed with inerts that are
easily separated from product
• Low P if gas phase
PFR/PBR
Side streams feed low CA
←High CB
CA
Semi-batch
reactor slowly feed
A to large amt of B
CA
CA CA
CSTRs in
series
L9b-9
Slides courtesy of Prof M L Kraft, Chemical & Biomolecular Engr Dept, University of Illinois, Urbana-Champaign.
Different Types of Selectivity
instantaneous rate selectivity, SD/U
D
D U
U
r
rate of formation of D
S
rate of formation of U r
 
D
D U
U
F molar flow rate of desired product
S
F molar flow rate of undesir
Exit
E ed pr
x oduct
it
 
overall rate selectivity, D U
S
D
D U
U
N moles of desired product
S
N moles of undes
Fi
ir
nal
Fi ed pr u
nal od ct
 
D
D
A
r
rate of formation of D
Y
rate of consumption of A r
 

instantaneous yield, YD
(at any point or time in reactor)
overall yield, D
Y
D
D
A0 A
F
Y
F F


flow
D
D
A0 A
N
Y
N N


batch
Evaluated
at outlet
Evaluated
at tfinal
L9b-10
Slides courtesy of Prof M L Kraft, Chemical & Biomolecular Engr Dept, University of Illinois, Urbana-Champaign.
Series (Consecutive) Reactions
(desired) (undesired)
A D U
k1 k2
Time is the key factor here!!!
Spacetime t for a flow reactor Real time t for a batch reactor
To maximize the production of D, use:
Batch
or PFR/PBR or
n
CSTRs in series
and carefully select the time (batch) or spacetime (flow)
L9b-11
Slides courtesy of Prof M L Kraft, Chemical & Biomolecular Engr Dept, University of Illinois, Urbana-Champaign.
Concentrations in Series Reactions
A B C
k1 k2
-rA = k1CA
rB,net = k1CA – k2CB
k1
A A
1 A
A
0
0
A 1
A
dF dC
dV dV
C C e
k C k C 
       t

How does CA depend on t?
How does CB depend on t?
1 A
B
2 B
k C
dF
C
d
k
V
   
k1
A0
1
B
2 B
0 C e
k
dC
d
k C
V

  
t

 
k
B 1
1 A0 2 B
dC
k C e k C
d
t
t

  
Substitute
 
k
B 1
2 B 1 A0
dC
k C k C e
d
t
t

  
Use integrating
factor (reviewed
on Compass)
   
k2
B k k
2 1
1 A0
d C e
k C e
d
t
t
t

 
k k
1 2
B 1 A0
2 1
e e
C k C
k k
t t
 
 

   
 

 
0
V
t


C A0 A B
C C C C
  
L9b-12
Slides courtesy of Prof M L Kraft, Chemical & Biomolecular Engr Dept, University of Illinois, Urbana-Champaign.
The reactor V (for a given 0) and t that maximizes CB occurs when dCB/dt=0
 
k k
1 A0
B 1 2
1 2
2 1
k C
dC
k e k e 0
d k k
t t
t
 
 
   
 

 
1
opt
1 2 2
k
1
ln
k k k
t 

0
V
t

 so opt 0 opt
V  t

A
B
C
k1
A A0
C C e t


k k
1 2
B 1 A0
2 1
e e
C k C
k k
t t
 
 

  
 

 
C A0 A B
C C C C
  
topt
Reactions in Series: Cj & Yield
L9b-13
Slides courtesy of Prof M L Kraft, Chemical & Biomolecular Engr Dept, University of Illinois, Urbana-Champaign.
 
E E
D U1
D U D U
D T 1 1
A C
U1
A
e C C
A
a a  
 
 
 
  
 
What reactor/reactors scheme and conditions would you use to maximize
the selectivity parameters for the following parallel reaction?


2000
T 0.5
D A C
r C
00e C
8


300
T
U A C
1
10
r C C
e
D
D U1
U1
r
S
r

Need to maximize SD/U1
 
 
2000 300
0.5 1 1 1
T
D U A C
1
800
S e C C
10
 
 

Plug in
numbers:
1700
0.5
T
D U A
1
S 80e C


 
A+C D desired
kD
A+C U1 undesired
kU1
To maximize the production of the desired product, the temperature should be
a) As high as possible (without decomposing the reactant or product)
b) Neither very high or very low
c) As low as possible (but not so low the rate = 0)
d) Doesn’t matter, T doesn’t affect the selectivity
e) Not enough info to answer the question
 


E
RT
k T Ae
E/R
ED > EU, so use higher T
L9b-14
Slides courtesy of Prof M L Kraft, Chemical & Biomolecular Engr Dept, University of Illinois, Urbana-Champaign.
 
E E
D U1
D U D U
D T 1 1
A C
U1
A
e C C
A
a a  
 
 
 
  
 
What reactor/reactors scheme and conditions would you use to maximize
the selectivity parameters for the following parallel reaction?


2000
T 0.5
D A C
r C
00e C
8


300
T
U A C
1
10
r C C
e
D
D U1
U1
r
S
r

Need to maximize SD/U1
 
 
2000 300
0.5 1 1 1
T
D U A C
1
800
S e C C
10
 
 

Plug in
numbers:
1700
0.5
T
D U A
1
S 80e C


 
A+C D desired
kD
A+C U1 undesired
kU1
To maximize the production of the desired product, CA should be
a) As high as possible
b) Neither very high or very low
c) As low as possible
d) Doesn’t matter, CA doesn’t affect the selectivity
e) Not enough info to answer the question
 


E
RT
k T Ae
αD < αU1, so high CA favors undesired
product formation (keep CA low)
L9b-15
Slides courtesy of Prof M L Kraft, Chemical & Biomolecular Engr Dept, University of Illinois, Urbana-Champaign.
 
E E
D U1
D U D U
D T 1 1
A C
U1
A
e C C
A
a a  
 
 
 
  
 
What reactor/reactors scheme and conditions would you use to maximize
the selectivity parameters for the following parallel reaction?
2000
0.5
T
D A C
r 800e C C


300
T
U A C
1
r 10e C C


D
D U1
U1
r
S
r

Need to maximize SD/U1
 
 
2000 300
0.5 1 1 1
T
D U A C
1
800
S e C C
10
 
 

Plug in
numbers:
1700
0.5
T
D U A
1
S 80e C


 
• Since ED>EU1, kD increases faster than kU1 as the temperature increases
• aD<aU1, keep CA low to maximize CD with respect to CU1
• rD and rU1 are 1st order in CC, so changing CC does not influence selectivity
A+C D desired
kD
A+C U1 undesired
kU1
• Operate at a high temperature to maximize CD with respect to CU1
• HOWEVER, high CC will increase the reaction rate and offset the slow
reaction rate that is caused by low CA (that’s a good thing)
What reactor should we use?
L9b-16
Slides courtesy of Prof M L Kraft, Chemical & Biomolecular Engr Dept, University of Illinois, Urbana-Champaign.
What reactor/reactors scheme and conditions would you use to maximize
the selectivity parameters for the following parallel reaction?
2000
0.5
T
D A C
r 800e C C


300
T
U A C
1
r 10e C C


Need to maximize SD/U1
1700
0.5
T
D U A
1
S 80e C



• aD<aU1, keep CA low to maximize CD with respect to CU1
• rD and rU1 are 1st order in CC, so changing CC does not influence selectivity
A+C D desired
kD
A+C U1 undesired
kU1
• ED>EU1, operate at a high temperature to maximize CD with respect to CU1
• HOWEVER, high CC will increase the reaction rate and offset the slow
reaction rate that is caused by low CA (that’s a good thing)
What reactor should we use?
←High CC
Semi-batch reactor
slowly feed A to large
amount of C
CA
PFR/PBR w/ side streams feeding low CA
A
C PFR
L9b-17
Slides courtesy of Prof M L Kraft, Chemical & Biomolecular Engr Dept, University of Illinois, Urbana-Champaign.
How does the selection of reactor/reactors scheme and conditions
change if D can react with C and form another undesired product?
2000
0.5
T
D A C
r 800e C C


300
T
U A C
1
r 10e C C


Need to maximize SD/U1 and SD/U2
1700
0.5
T
D U A
1
S 80e C



A+C D desired
kD
A+C U1 undesired
kU1
D+C U2 undesired
kU2
8000
6 T
U C D
2
r 10 e C C


D
D U2
U2
r
S
r

2000
0.5
T
A C
8000
6 T
C D
800e C C
10 e C C



6000
4 0.5 1
T
D U A D
2
S 8 10 e C C
 
  
• aD<aU1, keep CA low
• ED>EU1, operate at a high T
• High CC increases rxn rate &
offsets slow rxn from low CA
• Since ED<EU21, kD increases slower than kU2 as T increases ⇨ operate at low
T to maximize CD
• aD>aU2, keep CA high to maximize CD
• rD, rU1 & rU2 are all 1st order in CC, so changing CC does not influence
selectivity, but high CC will offset the rate decrease due to low CA
• Low CD reduces the production of U2
Conflicts with maximizing SD/U1!
Conflicts with producing the product D!!!
L9b-18
Slides courtesy of Prof M L Kraft, Chemical & Biomolecular Engr Dept, University of Illinois, Urbana-Champaign.
A
C PFR, high T
Maximize SD/U1 & SD/U2
1700
0.5
T
D U A
1
S 80e C



A+C D desired
kD
A+C U1 undesired
kU1
D+C U2 undesired
kU2
6000
4 0.5 1
T
D U A D
2
S 8 10 e C C
 
 
• aD<aU1, keep CA low
• ED>EU1, operate at a high T
• Want to maximize CD
• ED<EU2, operate at low T
• aD>aU2, keep CA high
• Low CD reduces production of U2
• High CC increases rxn rate & offsets slow rate caused by low CA
Consider relative magnitude of SD/U1 and DD/U2 as a function of position in PFR
PFR w/ side streams feeding low CA
High T, CC is initially high, CA is low
→ high SD/U1
Initially CD=0 → rU2=0. Both gradually
increase down reactor
Initially high SD/U2 (because CD is low),
but SD/U2 gradually decreases down
reactor
• At some distance down the reactor,
significant amounts of D have formed
• SD/U2 becomes significant with respect
to SD/U1
• At this point, want low T, high CA &
low CC
PFR 2, low T
L9b-19
Slides courtesy of Prof M L Kraft, Chemical & Biomolecular Engr Dept, University of Illinois, Urbana-Champaign.
If a CSTR were used with CA = 1 mol/L and CD= 1 mol/L, at what
temperature should the reactor be operated?
2000
0.5
T
D A C
r 800e C C


300
T
U A C
1
r 10e C C


Need to maximize SD/(U1+U2)
A+C D desired
kD
A+C U1 undesired
kU1
D+C U2 undesired
kU2
8000
6 T
U C D
2
r 10 e C C


 
D
D U U
1 2
U U
1 2
r
S
r r
 

2000
0.5
T
A C
300 8000
6
T T
A C C D
800e C C
10e C C 10 e C C

  
 
 


 
   
2000
0.5
T
D 300 8000
6
U U
1 2 T T
800
e 1
10
S
10 10
e 1 e 1
10 10

  
 
  


CA=1
CD=1
2000
T
D 300 8000
U U 5
1 2 T T
80e
S
e 10 e

  
 
  
 

Plot SD/(U1+U2) vs temperature to find the temperature that maximizes SD/(U1+U2)
L9b-20
Slides courtesy of Prof M L Kraft, Chemical & Biomolecular Engr Dept, University of Illinois, Urbana-Champaign.
0
0.5
1
1.5
2
2.5
3
3.5
4
0 200 400 600 800 1000
Temperature (K)
If a CSTR were used with CA = 1 mol/L and CD= 1 mol/L, at what
temperature should the reactor be operated?
2000
0.5
T
D A C
r 800e C C


300
T
U A C
1
r 10e C C


Need to maximize SD/(U1+U2)
A+C D desired
kD
A+C U1 undesired
kU1
D+C U2 undesired
kU2
8000
6 T
U C D
2
r 10 e C C


2000
T
D 300 8000
U U 5
1 2 T T
80e
S
e 10 e

  
 
  


S
D/(U1+U2)
600K
L9b-21
Slides courtesy of Prof M L Kraft, Chemical & Biomolecular Engr Dept, University of Illinois, Urbana-Champaign.
Calculate the yield of forming B in a CSTR and PFR when the conversion
of A is 90% and CA0 = 4 mol/L. The following reactions occur in the reactor:
A B
kB
B B
mol
r k 2
L min
 

A C
kC
C C A
r k C
 1
C
k 1 min

What is the expression for the yield of B for a CSTR?
B
B
A0 A
F
Y
F F

 (overall yield)
B 0 B
B B
A0 0 A 0 A0 A
C C
Y Y
C C C C

 
  
 
We know CA0 and CA when XA=0.9. How do we get CB?
In - Out + Gen. = Accum.
B
B0 B B
dN
F F r V
dt
  
0 0
   
B
B r V
F 0   B 0
B
C
V
r

  B
B
C
r
t
B
B
C
mol
r 2
L min t
  

Use the mole balance on A to find t (at 90% conversion)
In - Out + Gen. = Accum.
   A
A
A0 A
d
V
F
N
r
F
dt 0
   
A0 A A
0 0 V
C C r
 
      
0
A0 A A A0 A A
C C r C C
V
r

t A0 A
A
C C
r
t

 

B
mol
2 C
L min
t
 

L9b-22
Slides courtesy of Prof M L Kraft, Chemical & Biomolecular Engr Dept, University of Illinois, Urbana-Champaign.
A B
kB
B B
mol
r k 2
L min
 

A C
kC
C C A
r k C
 1
C
k 1 min

B
A
B
A0
C
Y
C
C


A0 A
A
C C
r
t



What is –rA?
CA0 = 4 mol/L, and at
XA=0.9, CA= 0.4 mol/L
A B C
r r r
  
A B C A
r k k C
    A A
mol 1
r 2 C
L min min
   

A
A
A
A0 A0
A C
C C
mol 1
r
2 C
L min m
C
in
t t
 
  



Plug -rA back into
expression for t
mol 1 mol
2 0.4
L min mi
mol
4
L
mol
0.
L
n
4
L
t


 
  
  
1.5 min
t
  Residence time for XA = 0.9
B
mol
2
L min
C
t 

 
B
1.5min
mol
4
mol
2
L
L
mi
mo
L
n
4
Y
l
0.
 


B
Y 0.83
 
Calculate the yield of forming B in a CSTR and PFR when the conversion
of A is 90% and CA0 = 4 mol/L. The following reactions occur in the reactor:
B
A
B
A
0
r
C
C
Y
t


L9b-23
Slides courtesy of Prof M L Kraft, Chemical & Biomolecular Engr Dept, University of Illinois, Urbana-Champaign.
Calculate the yield of forming B in a CSTR and PFR when the conversion
of A is 90% and CA0 = 4 mol/L. The following reactions occur in the reactor:
A B
kB
B B
mol
r k 2
L min
 

A C
kC
C C A
r k C
 1
C
k 1 min

What is the expression for the yield of B for a PFR?
B
B
A0 A
F
Y
F F


(overall yield) B 0 B
B B
A0 0 A 0 A0 A
C C
Y Y
C C C C

 
  
 
Use the mass balance to get CB
B
B
dF
r
dV
 B 0
B
dC
r
dV

  B
B
dC
r
dt
  B
dC mol
2
d L min
t
 

CB
B
C 0
B0
mol
dC 2 d
L min
t
t
 
 

 
   

B B0
mol
C C 2 0
L min
t
Use the mole balance on A to find t (at 90% conversion)
A
A
dF
r
dV
 A 0
A
dC
r
dV

  A
A
dC
r
dt
 
A B C A
r k k C
    A A
mol 1
r 2 C
L min min
   

 
   
 

 
A
A
dC mol 1
2 C
d L min min
t
 
 
 
 
CA
A
A
C 0
A0
dC 1
d
2mol L C min
t
t
 
   
 
 
A
A
dC mol 1
2 C
d L min
t
B
mol
mi
C 2
L n
t

 
0
L9b-24
Slides courtesy of Prof M L Kraft, Chemical & Biomolecular Engr Dept, University of Illinois, Urbana-Champaign.
Calculate the yield of forming B in a CSTR and PFR when the conversion
of A is 90% and CA0 = 4 mol/L. The following reactions occur in the reactor:
A B
kB
B B
mol
r k 2
L min
 

A C
kC
C C A
r k C
 1
C
k 1 min

B
B
A0 A
C
Y
C C

 B
mol
in
C 2
L m
t

 Use mole balance on A to find t (at XA = 0.9)
A B C A
r k k C
    A A
mol 1
r 2 C
L min min
   

CA0 = 4 mol/L
CA = 0.4 mol/L
 
 
 
 
 
 
CA
A
C 0
A0 A
dC 1
d
mol min
2 C
L
t
t  
A0
A
mol
2
1
L
ln 0
m
C
ol min
2
L
C
t
 
 
 
 
  
 
 
 
 
mol
2
1
L
ln
mo mol
0.
mol
l mi
L
n
2
L L
4
4
t
 

 
 
 
 

 
 
0.92 min t
 
B B
A0 A0
A
B
A
B
B
mol
C C
0.4
L
0
Y Y Y 0
.92m
m
i
ol
n
mol
C C
4
.5
L
2
r L min
C
1
t 
     
 

Yield was better
in the CSTR, but
the residence
time was longer

More Related Content

Similar to L9b Selectivity example problems.pptx

Gc Chemical Kinetics
Gc Chemical KineticsGc Chemical Kinetics
Gc Chemical Kinetics
David Richardson
 
GC Chemical Kinetics
GC Chemical KineticsGC Chemical Kinetics
GC Chemical Kinetics
David Richardson
 
Gc Chemical Kinetics
Gc Chemical KineticsGc Chemical Kinetics
Gc Chemical Kinetics
David Richardson
 
Aspen Plus dynamic
Aspen Plus dynamicAspen Plus dynamic
Aspen Plus dynamic
EveryMiscellaneousTh
 
Energy Conversion Technology 2 - Binary power plant presentation
Energy Conversion Technology 2 - Binary power plant presentationEnergy Conversion Technology 2 - Binary power plant presentation
Energy Conversion Technology 2 - Binary power plant presentation
Riccardo Pagotto
 
Cre1
Cre1Cre1
Cre1
Ali Ali
 
Rea 1.ppt
Rea 1.pptRea 1.ppt
Rea 1.ppt
SurafelMustefa1
 
Stability kinetics and testing
Stability kinetics and testingStability kinetics and testing
Stability kinetics and testing
Kahnu charan panigrahi
 
ReactIR as a Diagnostic Tool for Developing Robust, Scalable Synthetic Processes
ReactIR as a Diagnostic Tool for Developing Robust, Scalable Synthetic ProcessesReactIR as a Diagnostic Tool for Developing Robust, Scalable Synthetic Processes
ReactIR as a Diagnostic Tool for Developing Robust, Scalable Synthetic Processes
placed1
 
Cab 3024 reactor synthesis problem exercise
Cab 3024 reactor synthesis   problem exerciseCab 3024 reactor synthesis   problem exercise
Cab 3024 reactor synthesis problem exercise
ayimsevenfold
 
Polymayh workshop.pptx
Polymayh workshop.pptxPolymayh workshop.pptx
Polymayh workshop.pptx
dayananana3
 
Reactor Design 9
Reactor Design 9Reactor Design 9
Reactor Design 9
Muhammad Zafar Iqbal
 
RD Lab - Exp-05 - G-A1.pdf
RD Lab - Exp-05 - G-A1.pdfRD Lab - Exp-05 - G-A1.pdf
RD Lab - Exp-05 - G-A1.pdf
Safeen Yaseen Ja'far
 
Non-Imaging Devices in Nuclear Medicine
Non-Imaging Devices in Nuclear MedicineNon-Imaging Devices in Nuclear Medicine
Non-Imaging Devices in Nuclear Medicine
Pawitra Masa-ah
 
Reaktor Alir Tangki Berpengaduk
Reaktor Alir Tangki BerpengadukReaktor Alir Tangki Berpengaduk
Reaktor Alir Tangki Berpengaduk
Leo Simanjuntak
 
Study of product distribution in parallel reaction in plug flow; DwSim.
Study of product distribution in parallel reaction in plug flow; DwSim.Study of product distribution in parallel reaction in plug flow; DwSim.
Study of product distribution in parallel reaction in plug flow; DwSim.
RankhambShubham
 
Unit Operations and water and wastewater treatment2 ideal reactor modeling.pdf
Unit Operations and water and wastewater treatment2 ideal reactor modeling.pdfUnit Operations and water and wastewater treatment2 ideal reactor modeling.pdf
Unit Operations and water and wastewater treatment2 ideal reactor modeling.pdf
amyw1990
 
rate of reaction ppt.ppt
rate of reaction ppt.pptrate of reaction ppt.ppt
rate of reaction ppt.ppt
Hari prasath
 
RD Lab - Exp-12 - G-A1.pdf
RD Lab - Exp-12 - G-A1.pdfRD Lab - Exp-12 - G-A1.pdf
RD Lab - Exp-12 - G-A1.pdf
Safeen Yaseen Ja'far
 
Reactors simulation note.pdf
Reactors simulation note.pdfReactors simulation note.pdf
Reactors simulation note.pdf
PaulosMekuria
 

Similar to L9b Selectivity example problems.pptx (20)

Gc Chemical Kinetics
Gc Chemical KineticsGc Chemical Kinetics
Gc Chemical Kinetics
 
GC Chemical Kinetics
GC Chemical KineticsGC Chemical Kinetics
GC Chemical Kinetics
 
Gc Chemical Kinetics
Gc Chemical KineticsGc Chemical Kinetics
Gc Chemical Kinetics
 
Aspen Plus dynamic
Aspen Plus dynamicAspen Plus dynamic
Aspen Plus dynamic
 
Energy Conversion Technology 2 - Binary power plant presentation
Energy Conversion Technology 2 - Binary power plant presentationEnergy Conversion Technology 2 - Binary power plant presentation
Energy Conversion Technology 2 - Binary power plant presentation
 
Cre1
Cre1Cre1
Cre1
 
Rea 1.ppt
Rea 1.pptRea 1.ppt
Rea 1.ppt
 
Stability kinetics and testing
Stability kinetics and testingStability kinetics and testing
Stability kinetics and testing
 
ReactIR as a Diagnostic Tool for Developing Robust, Scalable Synthetic Processes
ReactIR as a Diagnostic Tool for Developing Robust, Scalable Synthetic ProcessesReactIR as a Diagnostic Tool for Developing Robust, Scalable Synthetic Processes
ReactIR as a Diagnostic Tool for Developing Robust, Scalable Synthetic Processes
 
Cab 3024 reactor synthesis problem exercise
Cab 3024 reactor synthesis   problem exerciseCab 3024 reactor synthesis   problem exercise
Cab 3024 reactor synthesis problem exercise
 
Polymayh workshop.pptx
Polymayh workshop.pptxPolymayh workshop.pptx
Polymayh workshop.pptx
 
Reactor Design 9
Reactor Design 9Reactor Design 9
Reactor Design 9
 
RD Lab - Exp-05 - G-A1.pdf
RD Lab - Exp-05 - G-A1.pdfRD Lab - Exp-05 - G-A1.pdf
RD Lab - Exp-05 - G-A1.pdf
 
Non-Imaging Devices in Nuclear Medicine
Non-Imaging Devices in Nuclear MedicineNon-Imaging Devices in Nuclear Medicine
Non-Imaging Devices in Nuclear Medicine
 
Reaktor Alir Tangki Berpengaduk
Reaktor Alir Tangki BerpengadukReaktor Alir Tangki Berpengaduk
Reaktor Alir Tangki Berpengaduk
 
Study of product distribution in parallel reaction in plug flow; DwSim.
Study of product distribution in parallel reaction in plug flow; DwSim.Study of product distribution in parallel reaction in plug flow; DwSim.
Study of product distribution in parallel reaction in plug flow; DwSim.
 
Unit Operations and water and wastewater treatment2 ideal reactor modeling.pdf
Unit Operations and water and wastewater treatment2 ideal reactor modeling.pdfUnit Operations and water and wastewater treatment2 ideal reactor modeling.pdf
Unit Operations and water and wastewater treatment2 ideal reactor modeling.pdf
 
rate of reaction ppt.ppt
rate of reaction ppt.pptrate of reaction ppt.ppt
rate of reaction ppt.ppt
 
RD Lab - Exp-12 - G-A1.pdf
RD Lab - Exp-12 - G-A1.pdfRD Lab - Exp-12 - G-A1.pdf
RD Lab - Exp-12 - G-A1.pdf
 
Reactors simulation note.pdf
Reactors simulation note.pdfReactors simulation note.pdf
Reactors simulation note.pdf
 

Recently uploaded

Promoting Multilateral Cooperation for Sustainable Peatland management
Promoting Multilateral Cooperation for Sustainable Peatland managementPromoting Multilateral Cooperation for Sustainable Peatland management
Promoting Multilateral Cooperation for Sustainable Peatland management
Global Landscapes Forum (GLF)
 
在线办理(lboro毕业证书)拉夫堡大学毕业证学历证书一模一样
在线办理(lboro毕业证书)拉夫堡大学毕业证学历证书一模一样在线办理(lboro毕业证书)拉夫堡大学毕业证学历证书一模一样
在线办理(lboro毕业证书)拉夫堡大学毕业证学历证书一模一样
pjq9n1lk
 
world-environment-day-2024-240601103559-14f4c0b4.pptx
world-environment-day-2024-240601103559-14f4c0b4.pptxworld-environment-day-2024-240601103559-14f4c0b4.pptx
world-environment-day-2024-240601103559-14f4c0b4.pptx
mfasna35
 
Global Climate Change and global warming
Global Climate Change and global warmingGlobal Climate Change and global warming
Global Climate Change and global warming
ballkicker20
 
一比一原版(UMTC毕业证书)明尼苏达大学双城分校毕业证如何办理
一比一原版(UMTC毕业证书)明尼苏达大学双城分校毕业证如何办理一比一原版(UMTC毕业证书)明尼苏达大学双城分校毕业证如何办理
一比一原版(UMTC毕业证书)明尼苏达大学双城分校毕业证如何办理
zm9ajxup
 
Climate Change All over the World .pptx
Climate Change All over the World  .pptxClimate Change All over the World  .pptx
Climate Change All over the World .pptx
sairaanwer024
 
Evolving Lifecycles with High Resolution Site Characterization (HRSC) and 3-D...
Evolving Lifecycles with High Resolution Site Characterization (HRSC) and 3-D...Evolving Lifecycles with High Resolution Site Characterization (HRSC) and 3-D...
Evolving Lifecycles with High Resolution Site Characterization (HRSC) and 3-D...
Joshua Orris
 
Overview of the Global Peatlands Assessment
Overview of the Global Peatlands AssessmentOverview of the Global Peatlands Assessment
Overview of the Global Peatlands Assessment
Global Landscapes Forum (GLF)
 
DENR-PENRO-Bulacan-Presentation Philippine EIS
DENR-PENRO-Bulacan-Presentation Philippine EISDENR-PENRO-Bulacan-Presentation Philippine EIS
DENR-PENRO-Bulacan-Presentation Philippine EIS
MarlonJayBayag
 
Peatlands of Latin America and the Caribbean
Peatlands of Latin America and the CaribbeanPeatlands of Latin America and the Caribbean
Peatlands of Latin America and the Caribbean
Global Landscapes Forum (GLF)
 
Kinetic studies on malachite green dye adsorption from aqueous solutions by A...
Kinetic studies on malachite green dye adsorption from aqueous solutions by A...Kinetic studies on malachite green dye adsorption from aqueous solutions by A...
Kinetic studies on malachite green dye adsorption from aqueous solutions by A...
Open Access Research Paper
 
ENVIRONMENT~ Renewable Energy Sources and their future prospects.
ENVIRONMENT~ Renewable Energy Sources and their future prospects.ENVIRONMENT~ Renewable Energy Sources and their future prospects.
ENVIRONMENT~ Renewable Energy Sources and their future prospects.
tiwarimanvi3129
 
Enhanced action and stakeholder engagement for sustainable peatland management
Enhanced action and stakeholder engagement for sustainable peatland managementEnhanced action and stakeholder engagement for sustainable peatland management
Enhanced action and stakeholder engagement for sustainable peatland management
Global Landscapes Forum (GLF)
 
原版制作(Newcastle毕业证书)纽卡斯尔大学毕业证在读证明一模一样
原版制作(Newcastle毕业证书)纽卡斯尔大学毕业证在读证明一模一样原版制作(Newcastle毕业证书)纽卡斯尔大学毕业证在读证明一模一样
原版制作(Newcastle毕业证书)纽卡斯尔大学毕业证在读证明一模一样
p2npnqp
 
Optimizing Post Remediation Groundwater Performance with Enhanced Microbiolog...
Optimizing Post Remediation Groundwater Performance with Enhanced Microbiolog...Optimizing Post Remediation Groundwater Performance with Enhanced Microbiolog...
Optimizing Post Remediation Groundwater Performance with Enhanced Microbiolog...
Joshua Orris
 
Wildlife-AnIntroduction.pdf so that you know more about our environment
Wildlife-AnIntroduction.pdf so that you know more about our environmentWildlife-AnIntroduction.pdf so that you know more about our environment
Wildlife-AnIntroduction.pdf so that you know more about our environment
amishajha2407
 
Peatland Management in Indonesia, Science to Policy and Knowledge Education
Peatland Management in Indonesia, Science to Policy and Knowledge EducationPeatland Management in Indonesia, Science to Policy and Knowledge Education
Peatland Management in Indonesia, Science to Policy and Knowledge Education
Global Landscapes Forum (GLF)
 
Epcon is One of the World's leading Manufacturing Companies.
Epcon is One of the World's leading Manufacturing Companies.Epcon is One of the World's leading Manufacturing Companies.
Epcon is One of the World's leading Manufacturing Companies.
EpconLP
 
Global Peatlands Map and Hotspot Explanation Atlas
Global Peatlands Map and Hotspot Explanation AtlasGlobal Peatlands Map and Hotspot Explanation Atlas
Global Peatlands Map and Hotspot Explanation Atlas
Global Landscapes Forum (GLF)
 
Microbial characterisation and identification, and potability of River Kuywa ...
Microbial characterisation and identification, and potability of River Kuywa ...Microbial characterisation and identification, and potability of River Kuywa ...
Microbial characterisation and identification, and potability of River Kuywa ...
Open Access Research Paper
 

Recently uploaded (20)

Promoting Multilateral Cooperation for Sustainable Peatland management
Promoting Multilateral Cooperation for Sustainable Peatland managementPromoting Multilateral Cooperation for Sustainable Peatland management
Promoting Multilateral Cooperation for Sustainable Peatland management
 
在线办理(lboro毕业证书)拉夫堡大学毕业证学历证书一模一样
在线办理(lboro毕业证书)拉夫堡大学毕业证学历证书一模一样在线办理(lboro毕业证书)拉夫堡大学毕业证学历证书一模一样
在线办理(lboro毕业证书)拉夫堡大学毕业证学历证书一模一样
 
world-environment-day-2024-240601103559-14f4c0b4.pptx
world-environment-day-2024-240601103559-14f4c0b4.pptxworld-environment-day-2024-240601103559-14f4c0b4.pptx
world-environment-day-2024-240601103559-14f4c0b4.pptx
 
Global Climate Change and global warming
Global Climate Change and global warmingGlobal Climate Change and global warming
Global Climate Change and global warming
 
一比一原版(UMTC毕业证书)明尼苏达大学双城分校毕业证如何办理
一比一原版(UMTC毕业证书)明尼苏达大学双城分校毕业证如何办理一比一原版(UMTC毕业证书)明尼苏达大学双城分校毕业证如何办理
一比一原版(UMTC毕业证书)明尼苏达大学双城分校毕业证如何办理
 
Climate Change All over the World .pptx
Climate Change All over the World  .pptxClimate Change All over the World  .pptx
Climate Change All over the World .pptx
 
Evolving Lifecycles with High Resolution Site Characterization (HRSC) and 3-D...
Evolving Lifecycles with High Resolution Site Characterization (HRSC) and 3-D...Evolving Lifecycles with High Resolution Site Characterization (HRSC) and 3-D...
Evolving Lifecycles with High Resolution Site Characterization (HRSC) and 3-D...
 
Overview of the Global Peatlands Assessment
Overview of the Global Peatlands AssessmentOverview of the Global Peatlands Assessment
Overview of the Global Peatlands Assessment
 
DENR-PENRO-Bulacan-Presentation Philippine EIS
DENR-PENRO-Bulacan-Presentation Philippine EISDENR-PENRO-Bulacan-Presentation Philippine EIS
DENR-PENRO-Bulacan-Presentation Philippine EIS
 
Peatlands of Latin America and the Caribbean
Peatlands of Latin America and the CaribbeanPeatlands of Latin America and the Caribbean
Peatlands of Latin America and the Caribbean
 
Kinetic studies on malachite green dye adsorption from aqueous solutions by A...
Kinetic studies on malachite green dye adsorption from aqueous solutions by A...Kinetic studies on malachite green dye adsorption from aqueous solutions by A...
Kinetic studies on malachite green dye adsorption from aqueous solutions by A...
 
ENVIRONMENT~ Renewable Energy Sources and their future prospects.
ENVIRONMENT~ Renewable Energy Sources and their future prospects.ENVIRONMENT~ Renewable Energy Sources and their future prospects.
ENVIRONMENT~ Renewable Energy Sources and their future prospects.
 
Enhanced action and stakeholder engagement for sustainable peatland management
Enhanced action and stakeholder engagement for sustainable peatland managementEnhanced action and stakeholder engagement for sustainable peatland management
Enhanced action and stakeholder engagement for sustainable peatland management
 
原版制作(Newcastle毕业证书)纽卡斯尔大学毕业证在读证明一模一样
原版制作(Newcastle毕业证书)纽卡斯尔大学毕业证在读证明一模一样原版制作(Newcastle毕业证书)纽卡斯尔大学毕业证在读证明一模一样
原版制作(Newcastle毕业证书)纽卡斯尔大学毕业证在读证明一模一样
 
Optimizing Post Remediation Groundwater Performance with Enhanced Microbiolog...
Optimizing Post Remediation Groundwater Performance with Enhanced Microbiolog...Optimizing Post Remediation Groundwater Performance with Enhanced Microbiolog...
Optimizing Post Remediation Groundwater Performance with Enhanced Microbiolog...
 
Wildlife-AnIntroduction.pdf so that you know more about our environment
Wildlife-AnIntroduction.pdf so that you know more about our environmentWildlife-AnIntroduction.pdf so that you know more about our environment
Wildlife-AnIntroduction.pdf so that you know more about our environment
 
Peatland Management in Indonesia, Science to Policy and Knowledge Education
Peatland Management in Indonesia, Science to Policy and Knowledge EducationPeatland Management in Indonesia, Science to Policy and Knowledge Education
Peatland Management in Indonesia, Science to Policy and Knowledge Education
 
Epcon is One of the World's leading Manufacturing Companies.
Epcon is One of the World's leading Manufacturing Companies.Epcon is One of the World's leading Manufacturing Companies.
Epcon is One of the World's leading Manufacturing Companies.
 
Global Peatlands Map and Hotspot Explanation Atlas
Global Peatlands Map and Hotspot Explanation AtlasGlobal Peatlands Map and Hotspot Explanation Atlas
Global Peatlands Map and Hotspot Explanation Atlas
 
Microbial characterisation and identification, and potability of River Kuywa ...
Microbial characterisation and identification, and potability of River Kuywa ...Microbial characterisation and identification, and potability of River Kuywa ...
Microbial characterisation and identification, and potability of River Kuywa ...
 

L9b Selectivity example problems.pptx

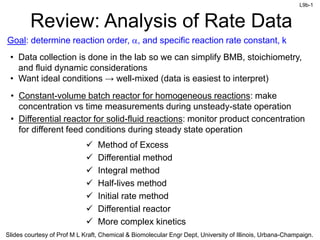
  • 1. L9b-1 Slides courtesy of Prof M L Kraft, Chemical & Biomolecular Engr Dept, University of Illinois, Urbana-Champaign. Review: Analysis of Rate Data • Constant-volume batch reactor for homogeneous reactions: make concentration vs time measurements during unsteady-state operation • Differential reactor for solid-fluid reactions: monitor product concentration for different feed conditions during steady state operation Goal: determine reaction order, a, and specific reaction rate constant, k • Data collection is done in the lab so we can simplify BMB, stoichiometry, and fluid dynamic considerations • Want ideal conditions → well-mixed (data is easiest to interpret)  Method of Excess  Differential method  Integral method  Half-lives method  Initial rate method  Differential reactor  More complex kinetics
  • 2. L9b-2 Slides courtesy of Prof M L Kraft, Chemical & Biomolecular Engr Dept, University of Illinois, Urbana-Champaign. A A dC kC dt a   A  products   1 1 A A0 1 1 1 t k 1 C C a a a              A A0 1 2 1 C C at t = t 2    1 1 2 1 A0 2 1 1 t k 1 C a a a                    1 1 2 A0 2 1 ln t ln 1 lnC k 1 a a a       ln (t1/2) ln CA0 Slope = 1- a A A r kC a   Plot ln(t1/2) vs ln CA0. Get a straight line with a slope of 1-α Review: Method of Half-lives Half-life of a reaction (t1/2): time it takes for the concentration of the reactant to drop to half of its initial value
  • 3. L9b-3 Slides courtesy of Prof M L Kraft, Chemical & Biomolecular Engr Dept, University of Illinois, Urbana-Champaign. Review: Method of Initial Rates • When the reaction is reversible, the method of initial rates can be used to determine the reaction order and the specific rate constant • Very little product is initially present, so rate of reverse reaction is negligible – A series of experiments is carried out at different initial concentrations – Initial rate of reaction is determined for each run – Initial rate can be found by differentiating the data and extrapolating to zero time – By various plotting or numerical analysis techniques relating -rA0 to CA0, we can obtain the appropriate rate law: A0 A0 r kC a  
  • 4. L9b-4 Slides courtesy of Prof M L Kraft, Chemical & Biomolecular Engr Dept, University of Illinois, Urbana-Champaign. Conversion of reactants & change in reactant concentration in the bed is extremely small Review: Differential Catalyst Bed FA0 Cp CA0 FAe Fp W L r’A: rate of reaction per unit mass of catalyst flow in - flow out + rate of gen = rate of accum. A0 Ae A F F r W 0      A0 Ae 0 A0 Ae A F F C C r W W           When constant flow rate, 0 = :   0 p 0 A0 Ae A C C C r W W          Product concentration The reaction rate is determined by measuring product concentration, Cp
  • 5. L9b-5 Slides courtesy of Prof M L Kraft, Chemical & Biomolecular Engr Dept, University of Illinois, Urbana-Champaign. Review: Multiple Rxns & Selectivity A B C k1 k2 A C B k2 k1 2) Series rxns 3) Complex rxns 1) Parallel / competing rxns Desired product A+B C+D A+C E k1 k2 D D U U F molar flow rate of desired product S F molar flow rate of undesir Exit E ed pr x oduct it   D D U U N moles of desired product S N moles of undes Fi ir nal Fi ed pr u nal od ct   instantaneous rate selectivity, SD/U D D U U r rate of formation of D S rate of formation of U r   overall rate selectivity, D U S D D A r rate of formation of D Y rate of consumption of A r    instantaneous yield, YD (at any point or time in reactor) overall yield, D Y D D A0 A F Y F F   flow D D A0 A N Y N N   batch at exit at tfinal Maximize selectivity / yield to maximize production of desired product
  • 6. L9b-6 Slides courtesy of Prof M L Kraft, Chemical & Biomolecular Engr Dept, University of Illinois, Urbana-Champaign. Review: Maximizing SD/U for Parallel Rxns     E E D U D RT 1 2 1 2 D U A B U A S e C C A a a        What reactor conditions and configuration maximize selectivity? a) If ED > EU Specific rate of desired reaction kD increases: Use higher temperature b) If ED < EU less rapidly with increasing T Use lower temperature(not so low that the reaction rate is tiny) more rapidly with increasing T To favor production of the desired product 1 2 1 2 a) 0 a a a a     Now evaluate concentration: → Use large CA 1 2 1 2 b) 0 a a a a     → Use small CA 1 2 1 2 c) 0         → Use large CB 1 2 1 2 d) 0         → Use small CB
  • 7. L9b-7 Slides courtesy of Prof M L Kraft, Chemical & Biomolecular Engr Dept, University of Illinois, Urbana-Champaign. Concentration Requirements & Reactor Selection CA00 CB00 CA0 CB0 How do concentration requirements play into reactor selection? CSTR: concentration is always at its lowest value (that at outlet) PFR PFR (or PBR): concentration is high at the inlet & progressively drops to the outlet concentration CA(t) CB(t) D kD A+B U kU Batch: concentration is high at t=0 & progressively drops with increasing time Semi-batch: concentration of one reactant (A as shown) is high at t=0 & progressively drops with increasing time, whereas concentration of B can be kept low at all times CB0 CA
  • 8. L9b-8 Slides courtesy of Prof M L Kraft, Chemical & Biomolecular Engr Dept, University of Illinois, Urbana-Champaign. D kD A+B U kU 1  2 High CB favors desired product formation 1  2 High CB favors undesired product formation (keep CB low) a1  a2 High CA favors desired product formation a1  a2 High CA favors undesired product formation (keep CA low) PFR/PBR Batch reactor When CA & CB are low (end time or position), all rxns will be slow High P for gas-phase rxn, do not add inert gas (dilutes reactants) PFR/PBR w/ side streams feeding low CB CB ←High CA Semi-batch reactor, slowly feed B to large amount of A CB CB CB CSTRs in series B consumed before leaving CSTRn CA00 CB00 CA0 CB0 CSTR PFR/PBR PFR/PBR w/ high recycle • Dilute feed with inerts that are easily separated from product • Low P if gas phase PFR/PBR Side streams feed low CA ←High CB CA Semi-batch reactor slowly feed A to large amt of B CA CA CA CSTRs in series
  • 9. L9b-9 Slides courtesy of Prof M L Kraft, Chemical & Biomolecular Engr Dept, University of Illinois, Urbana-Champaign. Different Types of Selectivity instantaneous rate selectivity, SD/U D D U U r rate of formation of D S rate of formation of U r   D D U U F molar flow rate of desired product S F molar flow rate of undesir Exit E ed pr x oduct it   overall rate selectivity, D U S D D U U N moles of desired product S N moles of undes Fi ir nal Fi ed pr u nal od ct   D D A r rate of formation of D Y rate of consumption of A r    instantaneous yield, YD (at any point or time in reactor) overall yield, D Y D D A0 A F Y F F   flow D D A0 A N Y N N   batch Evaluated at outlet Evaluated at tfinal
  • 10. L9b-10 Slides courtesy of Prof M L Kraft, Chemical & Biomolecular Engr Dept, University of Illinois, Urbana-Champaign. Series (Consecutive) Reactions (desired) (undesired) A D U k1 k2 Time is the key factor here!!! Spacetime t for a flow reactor Real time t for a batch reactor To maximize the production of D, use: Batch or PFR/PBR or n CSTRs in series and carefully select the time (batch) or spacetime (flow)
  • 11. L9b-11 Slides courtesy of Prof M L Kraft, Chemical & Biomolecular Engr Dept, University of Illinois, Urbana-Champaign. Concentrations in Series Reactions A B C k1 k2 -rA = k1CA rB,net = k1CA – k2CB k1 A A 1 A A 0 0 A 1 A dF dC dV dV C C e k C k C         t  How does CA depend on t? How does CB depend on t? 1 A B 2 B k C dF C d k V     k1 A0 1 B 2 B 0 C e k dC d k C V     t    k B 1 1 A0 2 B dC k C e k C d t t     Substitute   k B 1 2 B 1 A0 dC k C k C e d t t     Use integrating factor (reviewed on Compass)     k2 B k k 2 1 1 A0 d C e k C e d t t t    k k 1 2 B 1 A0 2 1 e e C k C k k t t               0 V t   C A0 A B C C C C   
  • 12. L9b-12 Slides courtesy of Prof M L Kraft, Chemical & Biomolecular Engr Dept, University of Illinois, Urbana-Champaign. The reactor V (for a given 0) and t that maximizes CB occurs when dCB/dt=0   k k 1 A0 B 1 2 1 2 2 1 k C dC k e k e 0 d k k t t t              1 opt 1 2 2 k 1 ln k k k t   0 V t   so opt 0 opt V  t  A B C k1 A A0 C C e t   k k 1 2 B 1 A0 2 1 e e C k C k k t t              C A0 A B C C C C    topt Reactions in Series: Cj & Yield
  • 13. L9b-13 Slides courtesy of Prof M L Kraft, Chemical & Biomolecular Engr Dept, University of Illinois, Urbana-Champaign.   E E D U1 D U D U D T 1 1 A C U1 A e C C A a a              What reactor/reactors scheme and conditions would you use to maximize the selectivity parameters for the following parallel reaction?   2000 T 0.5 D A C r C 00e C 8   300 T U A C 1 10 r C C e D D U1 U1 r S r  Need to maximize SD/U1     2000 300 0.5 1 1 1 T D U A C 1 800 S e C C 10      Plug in numbers: 1700 0.5 T D U A 1 S 80e C     A+C D desired kD A+C U1 undesired kU1 To maximize the production of the desired product, the temperature should be a) As high as possible (without decomposing the reactant or product) b) Neither very high or very low c) As low as possible (but not so low the rate = 0) d) Doesn’t matter, T doesn’t affect the selectivity e) Not enough info to answer the question     E RT k T Ae E/R ED > EU, so use higher T
  • 14. L9b-14 Slides courtesy of Prof M L Kraft, Chemical & Biomolecular Engr Dept, University of Illinois, Urbana-Champaign.   E E D U1 D U D U D T 1 1 A C U1 A e C C A a a              What reactor/reactors scheme and conditions would you use to maximize the selectivity parameters for the following parallel reaction?   2000 T 0.5 D A C r C 00e C 8   300 T U A C 1 10 r C C e D D U1 U1 r S r  Need to maximize SD/U1     2000 300 0.5 1 1 1 T D U A C 1 800 S e C C 10      Plug in numbers: 1700 0.5 T D U A 1 S 80e C     A+C D desired kD A+C U1 undesired kU1 To maximize the production of the desired product, CA should be a) As high as possible b) Neither very high or very low c) As low as possible d) Doesn’t matter, CA doesn’t affect the selectivity e) Not enough info to answer the question     E RT k T Ae αD < αU1, so high CA favors undesired product formation (keep CA low)
  • 15. L9b-15 Slides courtesy of Prof M L Kraft, Chemical & Biomolecular Engr Dept, University of Illinois, Urbana-Champaign.   E E D U1 D U D U D T 1 1 A C U1 A e C C A a a              What reactor/reactors scheme and conditions would you use to maximize the selectivity parameters for the following parallel reaction? 2000 0.5 T D A C r 800e C C   300 T U A C 1 r 10e C C   D D U1 U1 r S r  Need to maximize SD/U1     2000 300 0.5 1 1 1 T D U A C 1 800 S e C C 10      Plug in numbers: 1700 0.5 T D U A 1 S 80e C     • Since ED>EU1, kD increases faster than kU1 as the temperature increases • aD<aU1, keep CA low to maximize CD with respect to CU1 • rD and rU1 are 1st order in CC, so changing CC does not influence selectivity A+C D desired kD A+C U1 undesired kU1 • Operate at a high temperature to maximize CD with respect to CU1 • HOWEVER, high CC will increase the reaction rate and offset the slow reaction rate that is caused by low CA (that’s a good thing) What reactor should we use?
  • 16. L9b-16 Slides courtesy of Prof M L Kraft, Chemical & Biomolecular Engr Dept, University of Illinois, Urbana-Champaign. What reactor/reactors scheme and conditions would you use to maximize the selectivity parameters for the following parallel reaction? 2000 0.5 T D A C r 800e C C   300 T U A C 1 r 10e C C   Need to maximize SD/U1 1700 0.5 T D U A 1 S 80e C    • aD<aU1, keep CA low to maximize CD with respect to CU1 • rD and rU1 are 1st order in CC, so changing CC does not influence selectivity A+C D desired kD A+C U1 undesired kU1 • ED>EU1, operate at a high temperature to maximize CD with respect to CU1 • HOWEVER, high CC will increase the reaction rate and offset the slow reaction rate that is caused by low CA (that’s a good thing) What reactor should we use? ←High CC Semi-batch reactor slowly feed A to large amount of C CA PFR/PBR w/ side streams feeding low CA A C PFR
  • 17. L9b-17 Slides courtesy of Prof M L Kraft, Chemical & Biomolecular Engr Dept, University of Illinois, Urbana-Champaign. How does the selection of reactor/reactors scheme and conditions change if D can react with C and form another undesired product? 2000 0.5 T D A C r 800e C C   300 T U A C 1 r 10e C C   Need to maximize SD/U1 and SD/U2 1700 0.5 T D U A 1 S 80e C    A+C D desired kD A+C U1 undesired kU1 D+C U2 undesired kU2 8000 6 T U C D 2 r 10 e C C   D D U2 U2 r S r  2000 0.5 T A C 8000 6 T C D 800e C C 10 e C C    6000 4 0.5 1 T D U A D 2 S 8 10 e C C      • aD<aU1, keep CA low • ED>EU1, operate at a high T • High CC increases rxn rate & offsets slow rxn from low CA • Since ED<EU21, kD increases slower than kU2 as T increases ⇨ operate at low T to maximize CD • aD>aU2, keep CA high to maximize CD • rD, rU1 & rU2 are all 1st order in CC, so changing CC does not influence selectivity, but high CC will offset the rate decrease due to low CA • Low CD reduces the production of U2 Conflicts with maximizing SD/U1! Conflicts with maximizing SD/U1! Conflicts with producing the product D!!!
  • 18. L9b-18 Slides courtesy of Prof M L Kraft, Chemical & Biomolecular Engr Dept, University of Illinois, Urbana-Champaign. A C PFR, high T Maximize SD/U1 & SD/U2 1700 0.5 T D U A 1 S 80e C    A+C D desired kD A+C U1 undesired kU1 D+C U2 undesired kU2 6000 4 0.5 1 T D U A D 2 S 8 10 e C C     • aD<aU1, keep CA low • ED>EU1, operate at a high T • Want to maximize CD • ED<EU2, operate at low T • aD>aU2, keep CA high • Low CD reduces production of U2 • High CC increases rxn rate & offsets slow rate caused by low CA Consider relative magnitude of SD/U1 and DD/U2 as a function of position in PFR PFR w/ side streams feeding low CA High T, CC is initially high, CA is low → high SD/U1 Initially CD=0 → rU2=0. Both gradually increase down reactor Initially high SD/U2 (because CD is low), but SD/U2 gradually decreases down reactor • At some distance down the reactor, significant amounts of D have formed • SD/U2 becomes significant with respect to SD/U1 • At this point, want low T, high CA & low CC PFR 2, low T
  • 19. L9b-19 Slides courtesy of Prof M L Kraft, Chemical & Biomolecular Engr Dept, University of Illinois, Urbana-Champaign. If a CSTR were used with CA = 1 mol/L and CD= 1 mol/L, at what temperature should the reactor be operated? 2000 0.5 T D A C r 800e C C   300 T U A C 1 r 10e C C   Need to maximize SD/(U1+U2) A+C D desired kD A+C U1 undesired kU1 D+C U2 undesired kU2 8000 6 T U C D 2 r 10 e C C     D D U U 1 2 U U 1 2 r S r r    2000 0.5 T A C 300 8000 6 T T A C C D 800e C C 10e C C 10 e C C                 2000 0.5 T D 300 8000 6 U U 1 2 T T 800 e 1 10 S 10 10 e 1 e 1 10 10            CA=1 CD=1 2000 T D 300 8000 U U 5 1 2 T T 80e S e 10 e             Plot SD/(U1+U2) vs temperature to find the temperature that maximizes SD/(U1+U2)
  • 20. L9b-20 Slides courtesy of Prof M L Kraft, Chemical & Biomolecular Engr Dept, University of Illinois, Urbana-Champaign. 0 0.5 1 1.5 2 2.5 3 3.5 4 0 200 400 600 800 1000 Temperature (K) If a CSTR were used with CA = 1 mol/L and CD= 1 mol/L, at what temperature should the reactor be operated? 2000 0.5 T D A C r 800e C C   300 T U A C 1 r 10e C C   Need to maximize SD/(U1+U2) A+C D desired kD A+C U1 undesired kU1 D+C U2 undesired kU2 8000 6 T U C D 2 r 10 e C C   2000 T D 300 8000 U U 5 1 2 T T 80e S e 10 e            S D/(U1+U2) 600K
  • 21. L9b-21 Slides courtesy of Prof M L Kraft, Chemical & Biomolecular Engr Dept, University of Illinois, Urbana-Champaign. Calculate the yield of forming B in a CSTR and PFR when the conversion of A is 90% and CA0 = 4 mol/L. The following reactions occur in the reactor: A B kB B B mol r k 2 L min    A C kC C C A r k C  1 C k 1 min  What is the expression for the yield of B for a CSTR? B B A0 A F Y F F   (overall yield) B 0 B B B A0 0 A 0 A0 A C C Y Y C C C C         We know CA0 and CA when XA=0.9. How do we get CB? In - Out + Gen. = Accum. B B0 B B dN F F r V dt    0 0     B B r V F 0   B 0 B C V r    B B C r t B B C mol r 2 L min t     Use the mole balance on A to find t (at 90% conversion) In - Out + Gen. = Accum.    A A A0 A d V F N r F dt 0     A0 A A 0 0 V C C r          0 A0 A A A0 A A C C r C C V r  t A0 A A C C r t     B mol 2 C L min t   
  • 22. L9b-22 Slides courtesy of Prof M L Kraft, Chemical & Biomolecular Engr Dept, University of Illinois, Urbana-Champaign. A B kB B B mol r k 2 L min    A C kC C C A r k C  1 C k 1 min  B A B A0 C Y C C   A0 A A C C r t    What is –rA? CA0 = 4 mol/L, and at XA=0.9, CA= 0.4 mol/L A B C r r r    A B C A r k k C     A A mol 1 r 2 C L min min      A A A A0 A0 A C C C mol 1 r 2 C L min m C in t t         Plug -rA back into expression for t mol 1 mol 2 0.4 L min mi mol 4 L mol 0. L n 4 L t           1.5 min t   Residence time for XA = 0.9 B mol 2 L min C t     B 1.5min mol 4 mol 2 L L mi mo L n 4 Y l 0.     B Y 0.83   Calculate the yield of forming B in a CSTR and PFR when the conversion of A is 90% and CA0 = 4 mol/L. The following reactions occur in the reactor: B A B A 0 r C C Y t  
  • 23. L9b-23 Slides courtesy of Prof M L Kraft, Chemical & Biomolecular Engr Dept, University of Illinois, Urbana-Champaign. Calculate the yield of forming B in a CSTR and PFR when the conversion of A is 90% and CA0 = 4 mol/L. The following reactions occur in the reactor: A B kB B B mol r k 2 L min    A C kC C C A r k C  1 C k 1 min  What is the expression for the yield of B for a PFR? B B A0 A F Y F F   (overall yield) B 0 B B B A0 0 A 0 A0 A C C Y Y C C C C         Use the mass balance to get CB B B dF r dV  B 0 B dC r dV    B B dC r dt   B dC mol 2 d L min t    CB B C 0 B0 mol dC 2 d L min t t             B B0 mol C C 2 0 L min t Use the mole balance on A to find t (at 90% conversion) A A dF r dV  A 0 A dC r dV    A A dC r dt   A B C A r k k C     A A mol 1 r 2 C L min min                 A A dC mol 1 2 C d L min min t         CA A A C 0 A0 dC 1 d 2mol L C min t t           A A dC mol 1 2 C d L min t B mol mi C 2 L n t    0
  • 24. L9b-24 Slides courtesy of Prof M L Kraft, Chemical & Biomolecular Engr Dept, University of Illinois, Urbana-Champaign. Calculate the yield of forming B in a CSTR and PFR when the conversion of A is 90% and CA0 = 4 mol/L. The following reactions occur in the reactor: A B kB B B mol r k 2 L min    A C kC C C A r k C  1 C k 1 min  B B A0 A C Y C C   B mol in C 2 L m t   Use mole balance on A to find t (at XA = 0.9) A B C A r k k C     A A mol 1 r 2 C L min min      CA0 = 4 mol/L CA = 0.4 mol/L             CA A C 0 A0 A dC 1 d mol min 2 C L t t   A0 A mol 2 1 L ln 0 m C ol min 2 L C t                    mol 2 1 L ln mo mol 0. mol l mi L n 2 L L 4 4 t                 0.92 min t   B B A0 A0 A B A B B mol C C 0.4 L 0 Y Y Y 0 .92m m i ol n mol C C 4 .5 L 2 r L min C 1 t           Yield was better in the CSTR, but the residence time was longer