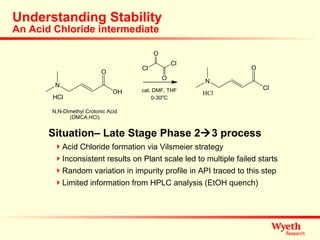
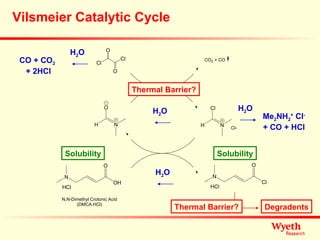
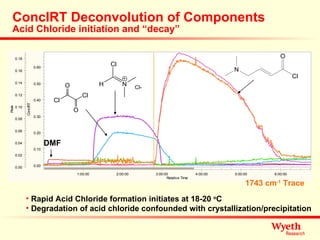
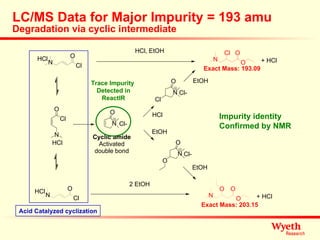
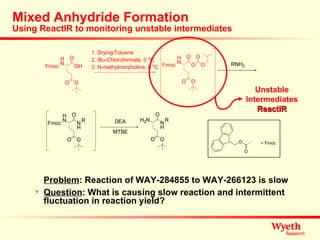
David W. Place Scientific Update Basel, Switzerland ReactIR as a Diagnostic Tool for Developing Robust, Scalable Synthetic Processes 29-OCT-2007 InPACT
InPACT ( In tegrated  P arallel   A utomated  C hemistry  T echnologies) 8 dedicated personnel on 2 sites High throughput screening Rapidly screen multiple combinations of reaction parameters utilizing state-of-the-art automated reactor technologies. Reaction optimization screening Quickly generate data on improved reaction conditions to assist SRD’s timely development and optimization of processing conditions. Technology assessment  (ReactIR) Identify and evaluate new process screening and development technologies and demonstrate their application to SRD’s process research & development.
Outline Brief Introduction Some Definitions and Arguments Systems, Software and Techniques ReactIR for Process Monitoring Solvent Exchange Unit Operations Atmospheric Azeotropic Distillation ReactIR as Reaction Diagnostic Case Study #1: Vilsmeier Reaction Case Study #2: Unstable in-situ intermediates Case Study #3: A Peek into Chiral Resolution Summary
“ Robust” Wikipedia – “ Healthy, strong, durable, often adaptable, innovative, flexible” “ Statistics: Robust statistical test performs even if its  assumptions  are violated…” “ Engineering: …the design is capable of functioning correctly (or at the very minimum, not failing catastrophically) under a great many conditions” How to achieve robustness in a process Myth busting Definition/Challenge of assumptions Rigour through Repetition Definition of Tolerances (Fail points vs. Fail safe) ReactIR DoE
Creation of Process Myths It is often difficult to define reaction response when inadequate analytical techniques are available to study that response The # of myths created for a given reaction or process increases as the # of simple and rapid analytical methods to study that reaction decreases ReactIR helps fill the gap
InPACT - ReactIR ( In tegrated  P arrallel  A utomated  C hemistry  T echnologies) ReactIR Technology Attentuated Total Reflectance (ATR) In-situ monitoring Non-perturbational Mobile Fiber optics (iC10 below) ReactIR Capabilities Max IR Range 4000-600 cm -1 pH Range 0-14 Temperature Range –80 to 200  o C SiComp Detector K6 Conduit IR Source And Data Collector iCIR software And ConcIRT ReactIR™ iC10
ConcIRT and ConcIRT Live! Deconvolution Software  Any Spectrum at any given point in time is a composite of all IR active components What do you do when a single isolated band is not available?    ConcIRT  A1 A2 A3 A4 A5 A6 A7  A8
ConcIRT A users observations Things to be aware of: Equimolar amounts of chemicals in a reaction mixture that change at the same rate will not be deconvoluted into separate components by ConcIRT A mixture of chemicals charged into the reactor prior to initiating IR collection will not be deconvoluted into separate components by ConcIRT Take reference spectra of all known materials if possible Wet Sensor with solvent to be used  Initiate ReactIR data collection Add solid(s) to reactor allowing time for dissolution/equilibration -OR- Add liquids/solutions via syringe pump at a rate 5x collection interval For each change/addition made to the reaction allow 5x the collection interval when feasible. Continue with the rest of the experiment. A + B  C ConcIRT is useful for monitoring  change To ensure proper deconvolution by  ConcIRT
David Place ReactIR and Unit operations 10-APR-2007
Solvent Exchange  A Practical Approach to Process Monitoring Problem : Solvent A is replaced with Solvent B before final crystallization of API. Residual Solvent A inhibits final crystallization of API Question : Is there a way to monitor the solvent exchange and determine when Solvent A  concentration < specification without GC? Benefit : Able to pinpoint when a confirmation sample should be taken.
Peak Selection
Depletion of Ethanol from 1:1 Ethanol/Ethyl Acetate Mixture GC Assay = 0.5 wt% EtOH ATR Assay (reflux)= 4.4 wt% EtOH ATR Assay (r.t.) = 1.4 wt% EtOH
Depletion of Ethyl Acetate from 1:1 Ethanol/ Ethyl Acetate mixture with 0.16M “API” “ API” 1513 cm -1 GC Endpoint Assay = 0.23 wt% EtOAc ATR Endpoint Assay (raw) = 2.1 wt% EtOAc ATR Endpoint Assay (ConcIRT) = 0.3 wt% EtOAc 1740 cm -1  EtOAc depletion 883 cm -1  EtOH enrichment ATR Spectra 1740 cm -1  (EtOAc)
A Real Example TBME/EtOH solvent Swap ConcIRT Analysis (a) (b) (c) 610 mL EtOH Charge Distillation starts Best TBME/EtOH ratio
Summary ReactIR 4000 can be used to monitor solvent exchanges ReactIR Data agrees with GC data in determination of endpoint concentration for Ethyl Acetate depletion The detection limit will depend on Peak absorbativity, spectral overlap, and “thermal baseline” Study of exchange process will be required before implementation into large scale operations ATR Calibration to solvent system Temperature sensitivity of solvents used  Small Scale simulation ConcIRT will be necessary to monitor more complex mixtures
Azeotropic Distillation  A Practical Approach to Process Monitoring Problem : Reagent in next step will be destroyed by residual water > 0.03wt%  Question : Can ReactIR be used to follow the removal of H 2 O by azeotropic distillation with Toluene to ensure consistent removal?
Azoetrpoic Distillation Unit Operation ConcIRT Deconvolution Component Profiles Charge 30g FMoc Glutamate mono hydrate and 150 mL Toluene;  Start heating to Tj = 140C, dissolution of FMoc Glutamate monohydrate during heat ramp between 24C and 71C;  Distillation commences Tj = 140C, Tr = 111C;  Distillation stopped collected 132mL distillate; (e) Tj = -15C, Tr = -11.5C  (a) (b) (c) (d) (e)
Comparison to KF data Simple azeotropic distillation to remove water Fmoc Glutamate Deconvoluted ReactIR Data agrees with KF at the distillation endpoint Component trace for H 2 O disagrees with KF data during distillation
Solvent Assisted Dehydration? Stable Hot Unstable Cold? C=O 1733 cm -1 C=O 1725 cm -1 C=O 1729, 1702 cm -1
ConcIRT Components Signal due to Toluene Signal due to Toluene Signal due to Toluene C=O str FMOC Glutamate
Summary ReactIR can be used to monitor azeotropic distillation Detection of free Water down to the ppm level appears to be possible Endpoint detection using ConcIRT ReactIR techniques give you physio-mechanistic information even for “simple” operations Define interrelationships and interdependencies of reaction components ReactIR as PAT empowers you to: Pinpoint physical changes in the system relative to process observations Cross-correlate process steps with real-time changes Generate a “snapshot” of your entire process for Process Validation
David Place Case Study #1: Vilsmeier Reaction 10-APR-2007
Understanding Stability An Acid Chloride intermediate Situation– Late Stage Phase 2  3 process Acid Chloride formation via Vilsmeier strategy Inconsistent results on Plant scale led to multiple failed starts Random variation in impurity profile in API traced to this step Limited information from HPLC analysis (EtOH quench)
Vilsmeier Catalytic Cycle Me 2 NH 2 +  Cl - + CO + HCl H 2 O H 2 O CO + CO 2   + 2HCl H 2 O H 2 O Thermal Barrier? Degradents Thermal Barrier? Solubility Solubility
Observations Reaction is completely suppressed at 0 o C DMF + Oxalyl chloride requires >0  o C to initiate catalytic cycle forming Acid Chloride DMF is required to form Acid Chloride DMCA.HCl + Oxalyl chloride at >0  o C leads to degradation of Oxalyl chloride w/o acid chloride formation Rapid Acid Chloride formation initiates at 18-20  o C Degradation of acid chloride confounded with crystallization/precipitation SM hygroscopic Successive attempts to produce Acid chloride with same lot    less and less acid chloride is formed
Product Formation vs. Oxalyl Chloride Decay Possible explanation of Scaleup disconnect At 0C no reaction with or destruction of Oxalyl chloride is observed Heat ramp    set to maximize acid chloride, minimize Oxalyl degradation
ConcIRT Deconvolution of Components Acid Chloride initiation and “decay” DMF Rapid Acid Chloride formation initiates at 18-20  o C Degradation of acid chloride confounded with crystallization/precipitation 1743 cm -1  Trace
Acid Chloride Quench with Water Not as unstable in presence of water as suspected THF * Water has been subtracted from this data Myth: The acid chloride will react immediately with water to form SM
LC/MS Data for Major Impurity = 193 amu Degradation via cyclic intermediate Acid Catalyzed cyclization Trace Impurity  Detected in ReactIR Impurity identity Confirmed by NMR
Acid Catalyzed isomerization Isomers can be detected with the SiCOMP   ConcIRT Component Spectra: IR “Footprint region”  Cis- C=C-H 744, 667 cm -1
Summary In-situ or unstable intermediates can be monitored empowering process chemists to: Fine tune addition rates of reagents Optimize reaction times based on real-time measurements Diagnose and circumvent undesirable side reactions Eliminate a vast majority of trial-and-error experimentation in process optimization
David Place Case Study #2: Unstable In-Situ Intermediates 10-APR-2007
Mixed Anhydride Formation Using ReactIR to monitoring unstable intermediates Problem : Reaction of WAY-284855 to WAY-266123 is slow Question : What is causing slow reaction and intermittent fluctuation in reaction yield? Unstable Intermediates ReactIR
Mixed anhydride formation at 0  o C Mixed anhydride is not stable at 0 o C  At end of N-methylmorpholine (NMM) addition, consumption of SMs slows Process for anhydride formation is not robust! NMM addition  rate = 450 mL/h 4.1 mole/h 9 equiv/h
Mixed anhydride formation at -8  o C Mixed anhydride  IS  stable at -8 o C over at least 90 minutes 20% residual SMs after NMM addition means there is not enough base added to catalyze anhydride formation. This is possible cause of slow formation of amide in the next step NMM addition  rate = 12 mL/h 0.11 mole/h 6 equiv/h
Mixed anhydride formation using 20% more NMM at -8  o C Excess of NMM does not appear to effect stability of the anhydride Complete conversion to mixed anhydride is achieved with 1.2 equiv of base when the NMM addition rate is slow. NMM addition  rate = 6 mL/h 0.05 mole/h 3.6 equiv/h
Scaling Reaction Degradation vs. Addition time Problem : Reaction exotherms during addition of NMM and RNH 2 Calculated that addition rate on scale    >2h This will enable control over exotherm in large scale equipment Question : Will the mixed anhydride survive during this extended addition time? To test for worst case, addition of NMM and RNH 2  over 3h was studied. Use ReactIR to monitor formation during telescoped process. Simulated in 250 mL Jacketed reactor at –11 o C (limit of system capability)
Scaleup: Mixed anhydride Formation Stressed 3h  (0.04 mole/h, 0.6 equiv/h) addition to avoid exotherm on scaleup (a) (b) (e) (f) (g) (d) (c) (a) To (b) IBCF Addition over 10 min (c) To (e) NMM addition over 3 h  (f) To (g) RNH 2  addition over 3 h HPLC assay @ 220 nm Inflection at  ~1 equiv NMM Incomplete reaction?
3-D Contour Reveals More Info NMM.HCl is evident in solution R 3 N + -H Str. Vibrations Consumption Of IBCF Mixed anhydride Dissolved NMM.HCl was not observed with NMM Addition over 30 minutes
Dissolved NMM.HCl Kinetic Profile Addition of RNH 2 Dissolved NMM.HCl detected ~20 minutes after inflection point Upon addition of RNH 2  to mixed anhydride soln IBCF is consumed NMM.HCl component increases Slight exotherm detected
Possible Mechanistic Explanation X 1 2 Route 1 dominates until ~1 equiv NMM Route 2 activated with excess NMM  k1 < k2 reason for inflection
Summary NMM mol equiv/unit time is important in formation of the mixed anhydride Lab scale reactions Base can be added faster with more control over exotherm Equiv NMM per unit time is higher  Less base required Large Scale simulation Base must be added slower to control exotherm Equiv NMM per unit time is lower  More base required A study of this type without ReactIR technique would have been much more difficult.
David Place Case Study #3: A Peek into Chiral Resolution 10-APR-2007
Chiral Resolution Case Study Using ReactIR’s “limitation” to your advantage Problem : Chiral resolution gives variable recovery and enantiometric purities on 1L + scales. Question : Can ReactIR be used to follow the resolution, define endpoints or give further insight into the resolution vs. time? Use ReactIR to monitor dissolved components and monitor solid/solution equilibrium.
Process Assumptions Acid and both enantiomers of the Substrate react quickly to form the salt Salt crystallizes out of solution due to differential solubility of the salt vs. its free base in ethanol The least soluable diastereomeric salt crystallizes first 50/50 mixture of enantiomers will require 0.5 equiv resolving agent to recover desired enantiomer in 50% maximum yield. Major salt product is the mono salt.
Establishing Components Comparison of ConcIRT detected component spectra An important first step in the use of ConcIRT data Not detected As a component
Chiral Resolution Unit Operations Charges Chiral Resolving agent (75C) Cooled to 60C (solution becomes turbid) Seeded reaction Cooled to 50C Cooled to room temp. (a) (b) (c) (d) (e)
Equilibration of Salt Forms Monitoring what is in solution vs. what is not Cool to RT    Complete ejection of Form A RT Hold    Form A/B equilibration Cannot rule out Form B crystallization during equilibration This all happens with little change to overall SM signal 96.7 %ee, 38.4% yield
Summary Two forms of the diasteriomeric salts and their proportionation appear to be factors in resolution outcome 2h for proportionation    96.7 %ee, 38% yield No proportionation    90.3 %ee, 41% yield Difficult to assign specific cause from experiment but Identified a competative process between salt forms  a key to defining robustness? If process is accelerated    leads to unpredictable results ReactIR as a tool for process understanding
Future Plan: Implementing in Large Scale Lab Scale work Study and understand dynamics of process through references and reactions Establish components of reaction; Relate these to Unit operations Repeat experiment to generate confidence and Identify critical observables Determine how well process endpoints correlate with other assay techniques Demo Scale (1L-5L) Repeat best process at larger scale to identify discrepancies from Lab scale Determine best sensor technology and positioning Compare critical observables to those generated in Lab scale (Same?) Cross reference to other assay techniques Kilo Lab Scale (10L – 250 L) Purchase/Design interchangeable ways to introduce technology Repeat Best Demo Process and compare critical observables
Conclusions ReactIR is a powerful tool to obtain qualitative information about chemical processes Implement this tool    Augment process understanding    Maximize knowledge from every experiment Use technique to Challenge or Confirm Process Myths (untested hypotheses) Make better decisions and ask better questions based real-time AND assay data
Acknowledgements Unit Operations Case Study Silvio Iera Case Study #1 Kan Eng Alex Gontcharov Warren Chew Qing Yu Karen Sutherland Sylvain Daigneault Case Study #2 Alice Sebastian Peter Wehrenberg Case Study #3 Sreeni Megati Robert Tinder Lisa Routel Mettler Toledo Will Kowalchyck Carlo Tripodi Tom Holmberg Wyeth InPACT group Cyril Benhaim, Haris Durutlic, Misato Konishi, Mike Macewan, Luc Richard, Rob Tinder Martin Guinn Mike O’Brien

ReactIR as a Diagnostic Tool for Developing Robust, Scalable Synthetic Processes

  • 1.
    David W. PlaceScientific Update Basel, Switzerland ReactIR as a Diagnostic Tool for Developing Robust, Scalable Synthetic Processes 29-OCT-2007 InPACT
  • 2.
    InPACT ( Integrated P arallel A utomated C hemistry T echnologies) 8 dedicated personnel on 2 sites High throughput screening Rapidly screen multiple combinations of reaction parameters utilizing state-of-the-art automated reactor technologies. Reaction optimization screening Quickly generate data on improved reaction conditions to assist SRD’s timely development and optimization of processing conditions. Technology assessment (ReactIR) Identify and evaluate new process screening and development technologies and demonstrate their application to SRD’s process research & development.
  • 3.
    Outline Brief IntroductionSome Definitions and Arguments Systems, Software and Techniques ReactIR for Process Monitoring Solvent Exchange Unit Operations Atmospheric Azeotropic Distillation ReactIR as Reaction Diagnostic Case Study #1: Vilsmeier Reaction Case Study #2: Unstable in-situ intermediates Case Study #3: A Peek into Chiral Resolution Summary
  • 4.
    “ Robust” Wikipedia– “ Healthy, strong, durable, often adaptable, innovative, flexible” “ Statistics: Robust statistical test performs even if its assumptions are violated…” “ Engineering: …the design is capable of functioning correctly (or at the very minimum, not failing catastrophically) under a great many conditions” How to achieve robustness in a process Myth busting Definition/Challenge of assumptions Rigour through Repetition Definition of Tolerances (Fail points vs. Fail safe) ReactIR DoE
  • 5.
    Creation of ProcessMyths It is often difficult to define reaction response when inadequate analytical techniques are available to study that response The # of myths created for a given reaction or process increases as the # of simple and rapid analytical methods to study that reaction decreases ReactIR helps fill the gap
  • 6.
    InPACT - ReactIR( In tegrated P arrallel A utomated C hemistry T echnologies) ReactIR Technology Attentuated Total Reflectance (ATR) In-situ monitoring Non-perturbational Mobile Fiber optics (iC10 below) ReactIR Capabilities Max IR Range 4000-600 cm -1 pH Range 0-14 Temperature Range –80 to 200 o C SiComp Detector K6 Conduit IR Source And Data Collector iCIR software And ConcIRT ReactIR™ iC10
  • 7.
    ConcIRT and ConcIRTLive! Deconvolution Software Any Spectrum at any given point in time is a composite of all IR active components What do you do when a single isolated band is not available?  ConcIRT  A1 A2 A3 A4 A5 A6 A7  A8
  • 8.
    ConcIRT A usersobservations Things to be aware of: Equimolar amounts of chemicals in a reaction mixture that change at the same rate will not be deconvoluted into separate components by ConcIRT A mixture of chemicals charged into the reactor prior to initiating IR collection will not be deconvoluted into separate components by ConcIRT Take reference spectra of all known materials if possible Wet Sensor with solvent to be used Initiate ReactIR data collection Add solid(s) to reactor allowing time for dissolution/equilibration -OR- Add liquids/solutions via syringe pump at a rate 5x collection interval For each change/addition made to the reaction allow 5x the collection interval when feasible. Continue with the rest of the experiment. A + B C ConcIRT is useful for monitoring change To ensure proper deconvolution by ConcIRT
  • 9.
    David Place ReactIRand Unit operations 10-APR-2007
  • 10.
    Solvent Exchange A Practical Approach to Process Monitoring Problem : Solvent A is replaced with Solvent B before final crystallization of API. Residual Solvent A inhibits final crystallization of API Question : Is there a way to monitor the solvent exchange and determine when Solvent A concentration < specification without GC? Benefit : Able to pinpoint when a confirmation sample should be taken.
  • 11.
  • 12.
    Depletion of Ethanolfrom 1:1 Ethanol/Ethyl Acetate Mixture GC Assay = 0.5 wt% EtOH ATR Assay (reflux)= 4.4 wt% EtOH ATR Assay (r.t.) = 1.4 wt% EtOH
  • 13.
    Depletion of EthylAcetate from 1:1 Ethanol/ Ethyl Acetate mixture with 0.16M “API” “ API” 1513 cm -1 GC Endpoint Assay = 0.23 wt% EtOAc ATR Endpoint Assay (raw) = 2.1 wt% EtOAc ATR Endpoint Assay (ConcIRT) = 0.3 wt% EtOAc 1740 cm -1 EtOAc depletion 883 cm -1 EtOH enrichment ATR Spectra 1740 cm -1 (EtOAc)
  • 14.
    A Real ExampleTBME/EtOH solvent Swap ConcIRT Analysis (a) (b) (c) 610 mL EtOH Charge Distillation starts Best TBME/EtOH ratio
  • 15.
    Summary ReactIR 4000can be used to monitor solvent exchanges ReactIR Data agrees with GC data in determination of endpoint concentration for Ethyl Acetate depletion The detection limit will depend on Peak absorbativity, spectral overlap, and “thermal baseline” Study of exchange process will be required before implementation into large scale operations ATR Calibration to solvent system Temperature sensitivity of solvents used Small Scale simulation ConcIRT will be necessary to monitor more complex mixtures
  • 16.
    Azeotropic Distillation A Practical Approach to Process Monitoring Problem : Reagent in next step will be destroyed by residual water > 0.03wt% Question : Can ReactIR be used to follow the removal of H 2 O by azeotropic distillation with Toluene to ensure consistent removal?
  • 17.
    Azoetrpoic Distillation UnitOperation ConcIRT Deconvolution Component Profiles Charge 30g FMoc Glutamate mono hydrate and 150 mL Toluene; Start heating to Tj = 140C, dissolution of FMoc Glutamate monohydrate during heat ramp between 24C and 71C; Distillation commences Tj = 140C, Tr = 111C; Distillation stopped collected 132mL distillate; (e) Tj = -15C, Tr = -11.5C (a) (b) (c) (d) (e)
  • 18.
    Comparison to KFdata Simple azeotropic distillation to remove water Fmoc Glutamate Deconvoluted ReactIR Data agrees with KF at the distillation endpoint Component trace for H 2 O disagrees with KF data during distillation
  • 19.
    Solvent Assisted Dehydration?Stable Hot Unstable Cold? C=O 1733 cm -1 C=O 1725 cm -1 C=O 1729, 1702 cm -1
  • 20.
    ConcIRT Components Signaldue to Toluene Signal due to Toluene Signal due to Toluene C=O str FMOC Glutamate
  • 21.
    Summary ReactIR canbe used to monitor azeotropic distillation Detection of free Water down to the ppm level appears to be possible Endpoint detection using ConcIRT ReactIR techniques give you physio-mechanistic information even for “simple” operations Define interrelationships and interdependencies of reaction components ReactIR as PAT empowers you to: Pinpoint physical changes in the system relative to process observations Cross-correlate process steps with real-time changes Generate a “snapshot” of your entire process for Process Validation
  • 22.
    David Place CaseStudy #1: Vilsmeier Reaction 10-APR-2007
  • 23.
    Understanding Stability AnAcid Chloride intermediate Situation– Late Stage Phase 2  3 process Acid Chloride formation via Vilsmeier strategy Inconsistent results on Plant scale led to multiple failed starts Random variation in impurity profile in API traced to this step Limited information from HPLC analysis (EtOH quench)
  • 24.
    Vilsmeier Catalytic CycleMe 2 NH 2 + Cl - + CO + HCl H 2 O H 2 O CO + CO 2 + 2HCl H 2 O H 2 O Thermal Barrier? Degradents Thermal Barrier? Solubility Solubility
  • 25.
    Observations Reaction iscompletely suppressed at 0 o C DMF + Oxalyl chloride requires >0 o C to initiate catalytic cycle forming Acid Chloride DMF is required to form Acid Chloride DMCA.HCl + Oxalyl chloride at >0 o C leads to degradation of Oxalyl chloride w/o acid chloride formation Rapid Acid Chloride formation initiates at 18-20 o C Degradation of acid chloride confounded with crystallization/precipitation SM hygroscopic Successive attempts to produce Acid chloride with same lot  less and less acid chloride is formed
  • 26.
    Product Formation vs.Oxalyl Chloride Decay Possible explanation of Scaleup disconnect At 0C no reaction with or destruction of Oxalyl chloride is observed Heat ramp  set to maximize acid chloride, minimize Oxalyl degradation
  • 27.
    ConcIRT Deconvolution ofComponents Acid Chloride initiation and “decay” DMF Rapid Acid Chloride formation initiates at 18-20 o C Degradation of acid chloride confounded with crystallization/precipitation 1743 cm -1 Trace
  • 28.
    Acid Chloride Quenchwith Water Not as unstable in presence of water as suspected THF * Water has been subtracted from this data Myth: The acid chloride will react immediately with water to form SM
  • 29.
    LC/MS Data forMajor Impurity = 193 amu Degradation via cyclic intermediate Acid Catalyzed cyclization Trace Impurity Detected in ReactIR Impurity identity Confirmed by NMR
  • 30.
    Acid Catalyzed isomerizationIsomers can be detected with the SiCOMP ConcIRT Component Spectra: IR “Footprint region” Cis- C=C-H 744, 667 cm -1
  • 31.
    Summary In-situ orunstable intermediates can be monitored empowering process chemists to: Fine tune addition rates of reagents Optimize reaction times based on real-time measurements Diagnose and circumvent undesirable side reactions Eliminate a vast majority of trial-and-error experimentation in process optimization
  • 32.
    David Place CaseStudy #2: Unstable In-Situ Intermediates 10-APR-2007
  • 33.
    Mixed Anhydride FormationUsing ReactIR to monitoring unstable intermediates Problem : Reaction of WAY-284855 to WAY-266123 is slow Question : What is causing slow reaction and intermittent fluctuation in reaction yield? Unstable Intermediates ReactIR
  • 34.
    Mixed anhydride formationat 0 o C Mixed anhydride is not stable at 0 o C At end of N-methylmorpholine (NMM) addition, consumption of SMs slows Process for anhydride formation is not robust! NMM addition rate = 450 mL/h 4.1 mole/h 9 equiv/h
  • 35.
    Mixed anhydride formationat -8 o C Mixed anhydride IS stable at -8 o C over at least 90 minutes 20% residual SMs after NMM addition means there is not enough base added to catalyze anhydride formation. This is possible cause of slow formation of amide in the next step NMM addition rate = 12 mL/h 0.11 mole/h 6 equiv/h
  • 36.
    Mixed anhydride formationusing 20% more NMM at -8 o C Excess of NMM does not appear to effect stability of the anhydride Complete conversion to mixed anhydride is achieved with 1.2 equiv of base when the NMM addition rate is slow. NMM addition rate = 6 mL/h 0.05 mole/h 3.6 equiv/h
  • 37.
    Scaling Reaction Degradationvs. Addition time Problem : Reaction exotherms during addition of NMM and RNH 2 Calculated that addition rate on scale  >2h This will enable control over exotherm in large scale equipment Question : Will the mixed anhydride survive during this extended addition time? To test for worst case, addition of NMM and RNH 2 over 3h was studied. Use ReactIR to monitor formation during telescoped process. Simulated in 250 mL Jacketed reactor at –11 o C (limit of system capability)
  • 38.
    Scaleup: Mixed anhydrideFormation Stressed 3h (0.04 mole/h, 0.6 equiv/h) addition to avoid exotherm on scaleup (a) (b) (e) (f) (g) (d) (c) (a) To (b) IBCF Addition over 10 min (c) To (e) NMM addition over 3 h (f) To (g) RNH 2 addition over 3 h HPLC assay @ 220 nm Inflection at ~1 equiv NMM Incomplete reaction?
  • 39.
    3-D Contour RevealsMore Info NMM.HCl is evident in solution R 3 N + -H Str. Vibrations Consumption Of IBCF Mixed anhydride Dissolved NMM.HCl was not observed with NMM Addition over 30 minutes
  • 40.
    Dissolved NMM.HCl KineticProfile Addition of RNH 2 Dissolved NMM.HCl detected ~20 minutes after inflection point Upon addition of RNH 2 to mixed anhydride soln IBCF is consumed NMM.HCl component increases Slight exotherm detected
  • 41.
    Possible Mechanistic ExplanationX 1 2 Route 1 dominates until ~1 equiv NMM Route 2 activated with excess NMM k1 < k2 reason for inflection
  • 42.
    Summary NMM molequiv/unit time is important in formation of the mixed anhydride Lab scale reactions Base can be added faster with more control over exotherm Equiv NMM per unit time is higher  Less base required Large Scale simulation Base must be added slower to control exotherm Equiv NMM per unit time is lower  More base required A study of this type without ReactIR technique would have been much more difficult.
  • 43.
    David Place CaseStudy #3: A Peek into Chiral Resolution 10-APR-2007
  • 44.
    Chiral Resolution CaseStudy Using ReactIR’s “limitation” to your advantage Problem : Chiral resolution gives variable recovery and enantiometric purities on 1L + scales. Question : Can ReactIR be used to follow the resolution, define endpoints or give further insight into the resolution vs. time? Use ReactIR to monitor dissolved components and monitor solid/solution equilibrium.
  • 45.
    Process Assumptions Acidand both enantiomers of the Substrate react quickly to form the salt Salt crystallizes out of solution due to differential solubility of the salt vs. its free base in ethanol The least soluable diastereomeric salt crystallizes first 50/50 mixture of enantiomers will require 0.5 equiv resolving agent to recover desired enantiomer in 50% maximum yield. Major salt product is the mono salt.
  • 46.
    Establishing Components Comparisonof ConcIRT detected component spectra An important first step in the use of ConcIRT data Not detected As a component
  • 47.
    Chiral Resolution UnitOperations Charges Chiral Resolving agent (75C) Cooled to 60C (solution becomes turbid) Seeded reaction Cooled to 50C Cooled to room temp. (a) (b) (c) (d) (e)
  • 48.
    Equilibration of SaltForms Monitoring what is in solution vs. what is not Cool to RT  Complete ejection of Form A RT Hold  Form A/B equilibration Cannot rule out Form B crystallization during equilibration This all happens with little change to overall SM signal 96.7 %ee, 38.4% yield
  • 49.
    Summary Two formsof the diasteriomeric salts and their proportionation appear to be factors in resolution outcome 2h for proportionation  96.7 %ee, 38% yield No proportionation  90.3 %ee, 41% yield Difficult to assign specific cause from experiment but Identified a competative process between salt forms  a key to defining robustness? If process is accelerated  leads to unpredictable results ReactIR as a tool for process understanding
  • 50.
    Future Plan: Implementingin Large Scale Lab Scale work Study and understand dynamics of process through references and reactions Establish components of reaction; Relate these to Unit operations Repeat experiment to generate confidence and Identify critical observables Determine how well process endpoints correlate with other assay techniques Demo Scale (1L-5L) Repeat best process at larger scale to identify discrepancies from Lab scale Determine best sensor technology and positioning Compare critical observables to those generated in Lab scale (Same?) Cross reference to other assay techniques Kilo Lab Scale (10L – 250 L) Purchase/Design interchangeable ways to introduce technology Repeat Best Demo Process and compare critical observables
  • 51.
    Conclusions ReactIR isa powerful tool to obtain qualitative information about chemical processes Implement this tool  Augment process understanding  Maximize knowledge from every experiment Use technique to Challenge or Confirm Process Myths (untested hypotheses) Make better decisions and ask better questions based real-time AND assay data
  • 52.
    Acknowledgements Unit OperationsCase Study Silvio Iera Case Study #1 Kan Eng Alex Gontcharov Warren Chew Qing Yu Karen Sutherland Sylvain Daigneault Case Study #2 Alice Sebastian Peter Wehrenberg Case Study #3 Sreeni Megati Robert Tinder Lisa Routel Mettler Toledo Will Kowalchyck Carlo Tripodi Tom Holmberg Wyeth InPACT group Cyril Benhaim, Haris Durutlic, Misato Konishi, Mike Macewan, Luc Richard, Rob Tinder Martin Guinn Mike O’Brien

Editor's Notes

  • #8 Any spectra at any given point in time is a composite of all IR active components. Due to this, monitoring of a specific species in solution at a set wavenumber gives a kinetic profile that is a composite of all kinetic profiles of all species absorbing at that wavenumber. Best case scenario is when there is an isolated IR band to monitor. Then the kinetic profile obtained from monitoring that band is simply achieved by subtraction of a baseline in the system (usually solvent). In many cases however this scenario does not exist for all components of interest in a reaction mixture. Depending on the severity of spectral overlap certain information, such as endpoint determination and or establishing functional group assignments to specific components, may be skewed or difficult to pinpoint. As an analogy, the IR spectrum is the same as drawing the structures of all the components one on top of the other. You can see from the garbled mass that there are amine and carbonyl functional groups but you cannot with certainty assign them to any spectific component of the reaction. This is where deconvolution software is useful. By using statistics to analyze the changes in the IR spectrum over time, establishing component spectra that better describe the components and relating them to specific kinetic profiles eliminate some (but not all) of the uncertainty and make the technique more powerful and useful for mapping out reaction relationships and interdependencies.
  • #13 *ATR Raw intensity data correlation to GC is limited by Thermal Background and Baseline Absorption by EtOAc *Detection Limit for Ethanol in Ethyl Acetate is 1.36 wt% at room temperature. *Detection limits will depend on spectral overlap and band absorbativity
  • #25 Can we use ReactIR to help define the dependencies of the Vilsmeier catalytic cycle. First start with what is known: the suspected catalytic cycle. *Is there and operational window of temperatures that enables the control of the catalytic cycle and eliminates decomposition? How do we monitor this though? Conventional HPLC or GC techniques will give you almost no useful information. NMR techniques may provide useful information but we will have to operate in either special solvents or in a system that really does not simulate the reaction environment as it will be run. Can you really bring an NMR to the reactor? Some very distinct functional groups exist in all the anticipated components of the catalytic cycle, this gives us a hand hold onto following the fate of each species and defining the interconversions between reactive species. *Water contamination: We can infer certain decay pathways by derivatizing the acid chloride to its ester or amide, but this tells us limited information about what is actually happening in the reactor. Can use ReactIR to confirm or identify the most critical step that is responsible for inefficient conversions due to this parameter. *Solubility: Is a concern for using ReactIR. We need to understand the conversion process to acid chloride, but the starting material HCl salt is not soluable in the reaction solvent. Also solubility of acid chloride is not known.
  • #27 Example shows that there is a thermal operational window for this process. If heat ramp control is inadequate or uncontrolled could lead to less acid chloride. May be a reason why lab scale reactions work consistently and large batch reactions show variability.
  • #28 From Report on 07/13/2006. Initial temp was set to 0C during oxalyl chloride addition.
  • #29 Reaction mixture is a slurry at the start of the experiment. Almost no Product acid chloride is soluable at the point of quenching with water. The “sinusoidal” waves in the data are due to the partial immiscibility od water in THF. As a globual of water passes by the IR sensor the acid and acid chloride component concentrations increase indicating a higher conc of these components dissolved in the water phase. Eventually the mixture homogenized.
  • #39 Simplified display of ConcIRT deconvolution showing only major components: (a) Charge 10.53mL Isobutyl chloroformate (IBCF) over 10 minutes at Tr = -11.5C; (b) End IBCF charge; (c) Charge NMM over 3 h at Tr = -11.5C; (d) Sampled L34669-183-1#5; (e) End NMM charge sampled L34669-183-1#6; (f) Start FluoroPhenylDMPA Addition over 3 h at Tr = -8.5C; (g) End FluoroPhenylDMPA charge, Julabo Setpoint changed to –5C. NMM addition set to 1.8 equiv not enough when addition times are long. ~10% more NMM is required.
  • #47 Establishing the components in a reaction is the most important first step when using ConcIRT algorythm to analyze your data. This will usually require processing that data in multiple ways (all spectra collected vs. broken into logical unit operations, processing with and without solvent subtraction from the entire data set, using 1 of 4 baselining techniques, changing the spectral range to incorporate key vibrational bands or exclude large bands due to solvents) By doing this, certain characteristic Component spectra become evident and inefficiencies in the deconvolution of known and unknown components can be evaluated.
  • #48 Salt form A is produced immediately after mandelic acid is introduced (reaction &lt;2 minutes) having featureless absorption at 1616 cm-1 and broad absorption at 2200-2800 cm-1 (indicative of a COO- NH+ salt). Salt form A converts to Salt Form B upon cooling to 50C or Form A crystallizes out and the rise in Form B is due to effective concentration in solution (the former is the more likely explanation). After point (e) the disappearance of form A can be attributed to crystallization out of solution.
  • #51 Critical observables should typically be kinetic profiles of reaction components like the product, starting material impurities of interest, solvents or any combination of those.