Download as PDF, PPTX


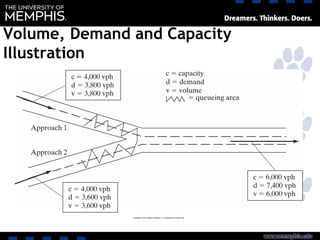
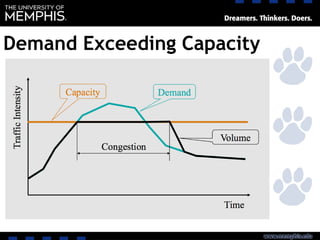
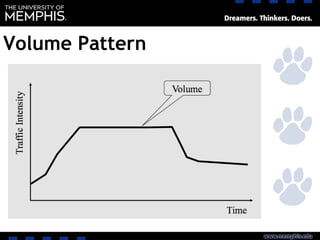

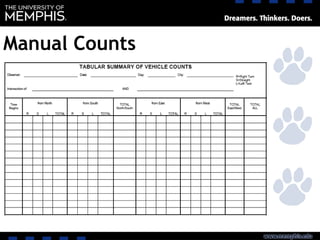

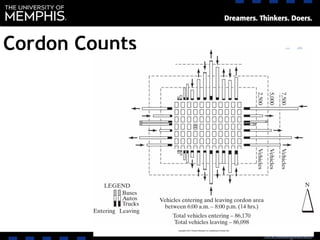
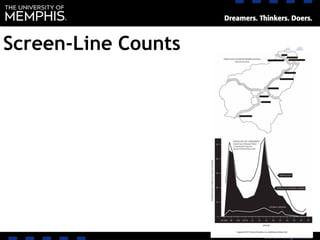

This document discusses various methods for conducting traffic volume studies. It describes key parameters like volume, rate of flow, demand, and capacity. It explains the purpose of volume studies for transportation planning, operations analysis, and impact assessments. Different study types are outlined, including intersection counts, cordon counts, screenline counts, and origin-destination studies. Methods for adjusting raw counts and estimating annual average daily traffic are also summarized.


![11 Geometric Design of Railway Track [Vertical Alignment] (Railway Engineerin...](https://cdn.slidesharecdn.com/ss_thumbnails/geometricdesignofrailwaytrack-ii-200415172410-thumbnail.jpg?width=640&height=640&fit=bounds)
![10 Geometric Design of Railway Track [Horizontal Alignment] (Railway Engineer...](https://cdn.slidesharecdn.com/ss_thumbnails/geometricdesignofrailwaytrack-i-200415171932-thumbnail.jpg?width=640&height=640&fit=bounds)


