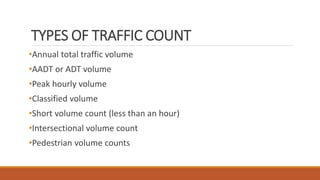
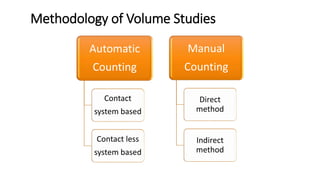
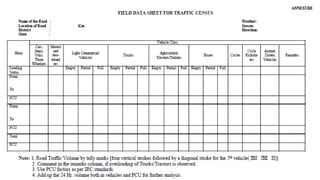
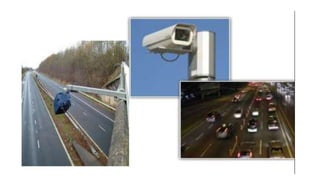
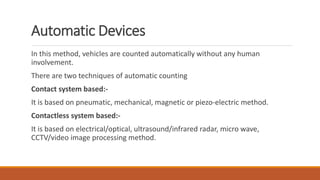
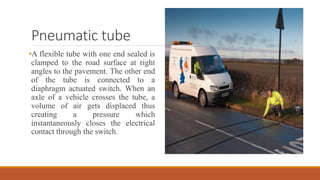
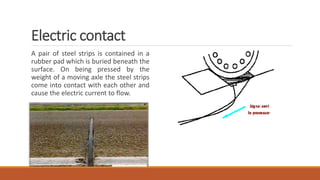
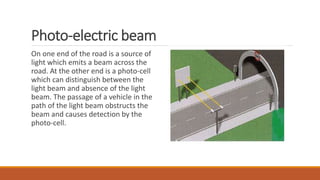
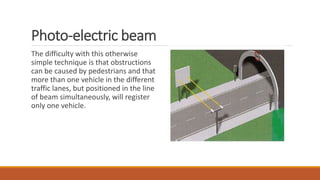
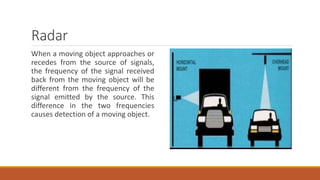
2. Introduction
• The fundamental measures of traffic on a road system is the volume of traffic
using the roadway in a given interval of time.
• Conducted to collect the data of vehicles/pedestrian that pass a particular
point on road facilities in a given time period ( from 15 min to even a year).
• It is also termed as flow and it is expressed in vehicles per hour or vehicles per
day.
• Counting technique to produce volume, rate of flow, demand & capacity.
3. Why Volume study….????
•To understand the efficiency at which a system works at present and LOS offered by the road
network.
•Planning and designing road facilities.
•A reasonable indication of the future rate of growth of traffic is made possible.
•To determine the vehicle composition in a stream.
•To estimate the ADT/AADT on a particular link.
•To determine the directional distribution(DD).
•To draw fluctuation curves.
•Calibrating and validating the traffic model.
5. Design purposes
•Structural and geometric design of pavements, bridge, and other
highway facilities.
•Intersection design including minimum turning path, channelization,
flaring, and traffic control devices.
• Pedestrian volume study is useful for designing side-walks,
pedestrian crossing etc.
6. Dynamic Traffic Management Purposes
Up to date and continuous flow/congestion information is essential
for optimizing - Traffic signal design and thereby improving junction
performance and Network productivity by providing information to
the road user.
7. Other Purposes
•Estimation of highway usage
•Measurement of current demand of a facility
•Estimation of trends
•Economic feasibility evaluation
8. Keywords Related to volume study
Volume
Rate of flow
Passenger Car Unit (PCU)
Average Daily Traffic (ADT )
Average Annual Daily Traffic (AADT)
Design Hourly Volume
Service flow rate
Directional Distribution
9. Factors affecting PCU
• Vehicles characteristics
• Driver characteristics
• Traffic stream characteristic
• Regulation and control of traffic
• Roadway characteristics
10. Vehicle type
Equivalent PCU factors
%Composition of vehicle type in stream
5 % 10 %
Fast Vehicles
1. Two wheelers 0.5 0.75
2. Car, Van 1.0 1.0
3. Rickshaw 1.2 1.0
4. Light commercial vehicle 1.4 2.0
5. Bus and Truck 2.2 3.7
6. Tractor Trailers 4.0 5.0
Slow Vehicles
7. Cycles 0.4 0.5
8. Cycle Rickshaw 1.5 2.0
9. Tonga (Horse drawn) 1.5 2.0
10. Hand Cart 2.0 3.0
Source: IRC: 106-1990
11. TYPES OF TRAFFIC COUNT
•Annual total traffic volume
•AADT or ADT volume
•Peak hourly volume
•Classified volume
•Short volume count (less than an hour)
•Intersectional volume count
•Pedestrian volume counts
12. Methodology of Volume Studies
Automatic
Counting
Contact
system based
Contact less
system based
Manual
Counting
Direct
method
Indirect
method
13. Manual Counting
Human involvement
There are two types of manual counting
• Direct method
• Indirect method
Direct method: Data is counted by using hand tally manual counter.
Indirect method: In this method, data is collected using video
camera. Video is captured for long time and data is collected later by
rewinding.
14. Manual Counting - Directly
Equipment needed are:
1. A watch
2. Pencils, eraser and sharpener
3. Blank field data sheets
4. Clip board.
17. Road features and Counting
requirements
No. of vehicles/hr that can be counted
by single trained observer
1. 2 lane - 2 way road with separate
observer on both sides; vehicles to be
counted & classified
500 vehicles per hr in one direction
1. 2 lane - 2 way road with one observer for
both sides; vehicles to be counted &
classified for each direction separately
200 vehicles per hr in one direction
1. 2 lane - 2 way road with separate
observer on both sides; vehicles to be
counted & classified
800 vehicles per hr in one direction
NUMBER OF OBSERVERS REQUIRED IN MANUAL COUNT
18. Combination of Manual and Mechanical
•Involves the services of field personnel
who operate mechanical device to
count and record the arrival of vehicles
across a road.
•Electronic counting boards are battery-
operated, hand-held devices used in
collecting traffic count data.
19. Manual Counting - Indirectly
•Video cameras are
mounted to record the
traffic condition on
road.
20. Manual Counting - Indirectly
The instrumentation consists of the following components:
• Video camera to take photographs of traffic, from a moving vehicle or a
stationary position.
• Video recorder and player to record the images taken from the camera on to
video cassettes and to-play back the recorded cassettes at any time later.
• Monitors (TV Screens).
21.
22. Automatic Devices
In this method, vehicles are counted automatically without any human
involvement.
There are two techniques of automatic counting
Contact system based:-
It is based on pneumatic, mechanical, magnetic or piezo-electric method.
Contactless system based:-
It is based on electrical/optical, ultrasound/infrared radar, micro wave,
CCTV/video image processing method.
23. Pneumatic tube
•A flexible tube with one end sealed is
clamped to the road surface at right
angles to the pavement. The other end
of the tube is connected to a
diaphragm actuated switch. When an
axle of a vehicle crosses the tube, a
volume of air gets displaced thus
creating a pressure which
instantaneously closes the electrical
contact through the switch.
24. Electric contact
A pair of steel strips is contained in a
rubber pad which is buried beneath the
surface. On being pressed by the
weight of a moving axle the steel strips
come into contact with each other and
cause the electric current to flow.
25. Photo-electric beam
On one end of the road is a source of
light which emits a beam across the
road. At the other end is a photo-cell
which can distinguish between the
light beam and absence of the light
beam. The passage of a vehicle in the
path of the light beam obstructs the
beam and causes detection by the
photo-cell.
26. Photo-electric beam
The difficulty with this otherwise
simple technique is that obstructions
can be caused by pedestrians and that
more than one vehicle in the different
traffic lanes, but positioned in the line
of beam simultaneously, will register
only one vehicle.
27. Infra-red and ultrasonic
Infra-red sensors can detect the heat radiated from a vehicle or can react to the
reflection from the vehicle of infra-red radiation emitted by the sensors.
An ultrasonic sensor is also used for vehicle detection. Those devices emit sound
waves to detect vehicles by measuring the time for the signal to return to the
device.
28. Radar
When a moving object approaches or
recedes from the source of signals,
the frequency of the signal received
back from the moving object will be
different from the frequency of the
signal emitted by the source. This
difference in the two frequencies
causes detection of a moving object.
29. Data Representation
Volume flow diagram at
intersection either drawn to a
certain scale or indicating traffic
volume as shown in this figure
and it showing the details of
crossing and turning traffic,
these data is needed for
intersection design.
30. DESIGN TRAFFIC VOLUME
A procedure for selecting an appropriate hourly volume is needed to
compute the level of service and to determine the number of lanes
that need to be provided in a new roadway design to achieve some
specified level of service.
The selection of an appropriate hourly volume is complicated by two
issues.
31.
32.
33. PEAK HOUR VOLUME
•The peak hour volume is the volume of traffic that uses the approach, lane, or
lane group in question during the hour of the day that observes the highest
traffic volumes for that intersection.
•The peak hour volume would be the volume of passenger car units that used the
ramps during rush hour.
•The peak hour volume is normally given in terms of passenger car units, since
changing turning all vehicles into passenger car units makes these volume
calculations more representative of what is actually going on.
34. PEAK HOUR VOLUME
•The peak hour factor (PHF) is derived from the peak hour volume.
It is simply the ratio of the peak hour volume to four times the peak fifteen-
minute volume.
𝑷𝑯𝑭 =
𝑷𝒆𝒂𝒌 𝒉𝒐𝒖𝒓 𝒗𝒐𝒍𝒖𝒎𝒆
𝟒 × 𝑷𝒆𝒂𝒌 𝒇𝒊𝒇𝒕𝒆𝒆𝒏 𝒎𝒊𝒏𝒖𝒕𝒆 𝒗𝒐𝒍𝒖𝒎𝒆
•Design Flow Rate: The design flow rate or the actual flow rate, for an approach,
lane, or lane group is the peak hour volume (flow rate) for that entity divided by
the peak hour factor.
35. DESIGN HOURLY VOLUME
•The design hourly volume (DHV) is usually the 30th highest hourly
volume for the design year, commonly 20 years from the time of
construction completion.
Directional Distribution (D): Traffic tends to be more equally
divided by direction near the center of an urban area or on loop
facilities. For other facilities, D factors of 60 to 70 percent frequently
occur.
𝑫𝑫𝑯𝑽 = 𝑲 × 𝑫 × 𝑨𝑨𝑫𝑻
36. INDIAN PRACTICE
Some of the findings from the Indian continuous are summarized below:
1. The peak hour traffic is generally in the range of 6-10 percent of the AADT.
2. The variation is daily traffic is marginal. Weekends attract higher volumes.
3. Monsoons and winter seasons have less traffic.
4. The composition of traffic varies from site to site. The percent of fast traffic is
generally higher than that of slow traffic.
5. Of the fast traffic trucks account a big share 50-70 percent, buses account for 10-20
percent, cars account for 5-20 percent, and the balance consists of motorized two
wheelers, 3 wheelers, tractors etc.
6. Cycles constitute a big share of slow traffic, about 70-90 percent.
37. REFERENCES
• Indian Road Congress, IRC 09-1972, Traffic Census on Non-urban roads New Delhi-1972.
• Kadiyali L R, Traffic Engineering and Transport Planning, Khanna Publication, New Delhi-2009.
• Indian Road Congress, IRC 106-1990, Capacity of roads in urban area, New Delhi-1990.
• Khanna S K & Justo C.E.G, Highway Engineering, Nem Chand & bros., New delhi-2015.
• C A O’Flaherty, Transport planning and Traffic engineering, Wiley publication-1996
• Fred l Mannering, Scott S. Washburn and Walter P. Kilareski, Highway engineering and Traffic
analysis, Wiley India publication-2012.