Download as PDF, PPTX

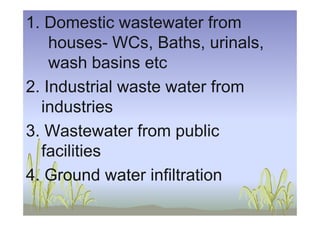
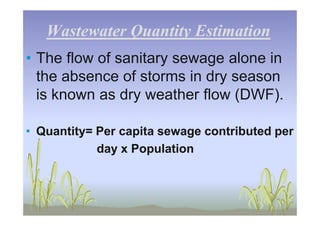
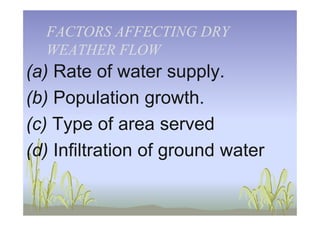
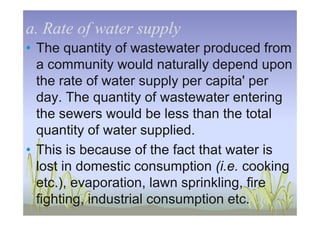
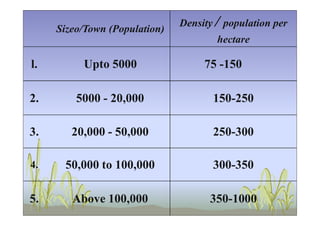
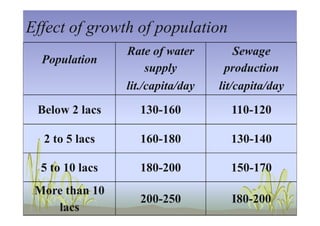
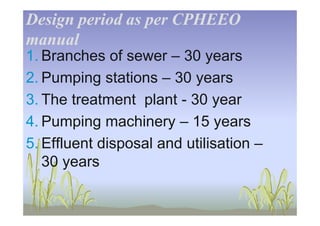
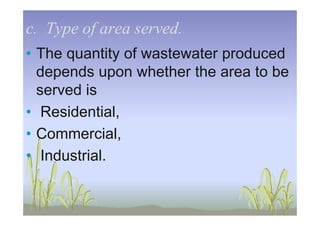
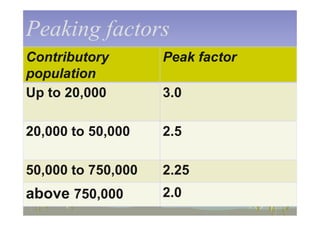
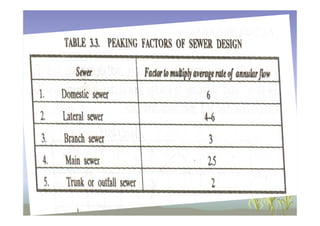
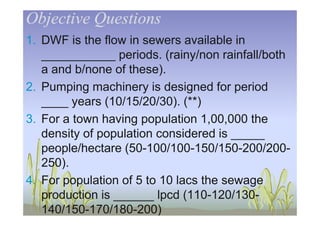
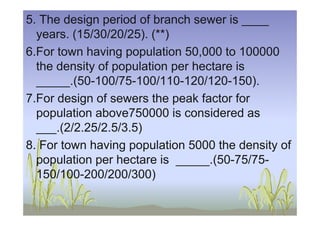


The document discusses wastewater flow rates, categorizing them into dry weather flow (DWF) and storm water flow, and examines the factors influencing DWF which include water supply rate, population growth, area type, and ground water infiltration. It outlines how to estimate sewage production based on parameters like population density and per capita water consumption during dry periods. Additionally, the document provides insights on design periods for sewer infrastructure and the calculation of peak flow factors based on population size.