Download as PDF, PPTX


![Erbil Polytechnic University Civil Engineering Department Saad.bilbas@epu.edu.iq 53
Example 2:
• DESIGN OF WET WELL
Given: Qmax = 14742.1m3/day = 10.237 m3/min
Solution:
Pumping capacity
So, P = Qmax = 10.237 m3/min
Minimum cycle time Design of Sewer System
Thus Minimum Cycle time must not be less than 5-minutes
For smaller pumps t min = 15 min
∗ ( )
]
. ∗
]= 38.39m3
• DIMENSIONS OF WET WELL
Assume Length = 3.6 m Design of Sewer System
Width = 3.6m
38.39 = 3.6*3.6*height
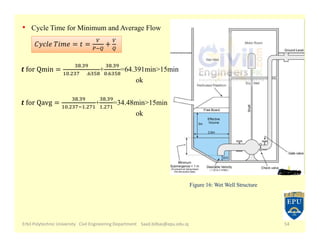
Hence, height = 3 m](https://image.slidesharecdn.com/ct2052ndlecturepdf22222-220910180858-1c6e0a82/85/Sewage-Sewer-system-and-elevations-Module-17-320.jpg)

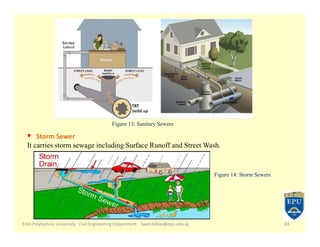
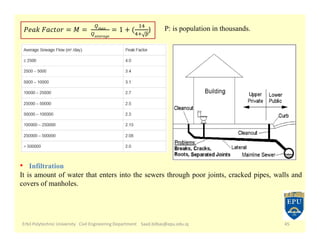
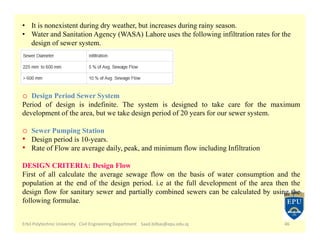
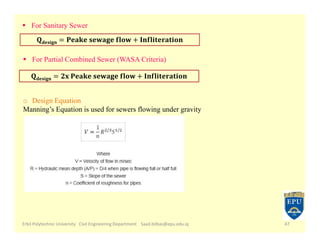
The document provides a comprehensive overview of sewer system design, emphasizing the importance of effective sewage management for public health and environmental protection. It discusses various types of sewer systems (separate, combined, sanitary, storm, etc.), sources of wastewater, flow variation, and design considerations including minimum and maximum velocity requirements, manhole placement, and infiltration rates. Additionally, it includes examples of population forecasting and the design of wet wells for effective sewage flow management.


