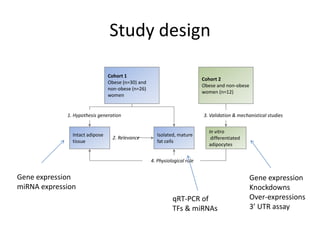
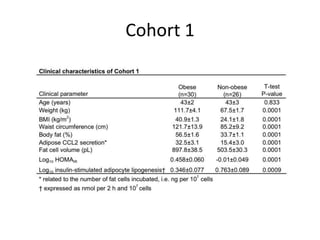
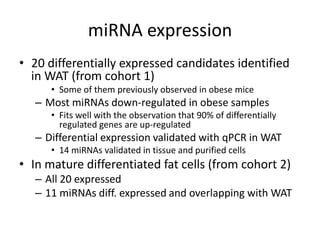
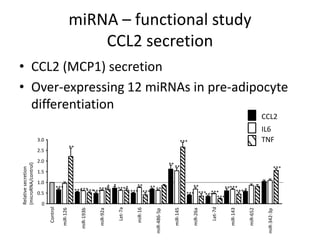
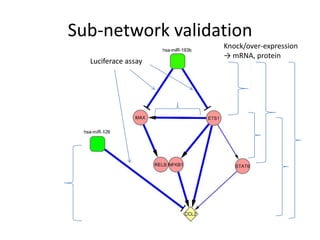
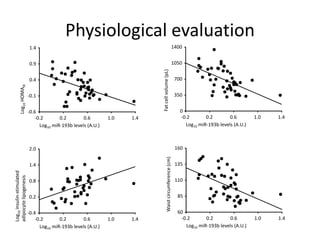
Sequencing the transcriptome
reveals complex levels of regulation

           Carsten O. Daub
     Copenhagenomics 2012-06-15
RIKEN – Omics Science Center (OSC)
Karolinska Institute


Science for Life Laboratory – SciLifeLab   Department of Biosciences and Nutrition
              Technology                                  Hospital
Outline
• Characterize cells on the molecular level

• Finding regulators of gene expression
  – We observe gene expression
  – What are the regulatory elements causing the
    observed changes in gene expression?

• Example: Inflammation of adipocytes in
  obesity
Cap Analysis of Gene Expression method
                   RNA extraction
                                                           RNA
                                                     5’
                                                          Gene
            CAGE library preparation
                                                                                                                      3’
    1.   CAP trapper                                             遺伝子
                                                                 Gene                         Gene
                                                                                                                   Genome
    2.   Trehalose extension method
    3.   CAGE library                                            RNA
                                                                                                RNA


                                                                                       CAP
                      Sequence
Tag sequencing with the next-generation sequencer
1.    Genome Sequencer FLX (Roche/454)
2.    Genome Analyzer System (illumina/ Solexa)
3.    SOLiD (Applied Biosystems)


                   Data processing
    Quality control
    Statistical variation of the obtained sequence
    Extraction of tag sequences
    Clustering
    Mapping
    Statistical variation of the mapping result
    Visualization with “genome browser”
    Statistical analysis                                         T. Shiraki et al, PNAS, 100, 15776-15781 (2003)
Traditional CAGE method
                 RNA extraction


           CAGE library preparation                                       CGCATGGTCGATAGACTTG
   1.    CAP trapper
   2.    Trehalose extension method
   3.    CAGE library                                                     GTGCGCGTCGAATATCGAT


                     Sequence                                             CGAATATCGATAGACTTG
Tag sequencing with the next generation sequencer
1.    Genome Sequencer FLX (Roche/454)
2.    Genome Analyzer System (illumina/ Solexa)
3.    SOLiD (Applied Biosystems)


                 Data processing
   Quality control
   Statistical variation of the obtained sequence
   Extraction of tag sequences
   Clustering
   Mapping
   Statistical variation of the mapping result
   Visualization with “genome browser”
   Statistical analysis
                                                    T. Shiraki et al, PNAS, 100, 15776-15781 (2003)
Traditional CAGE method
                  RNA extraction
                                                    Genome


           CAGE library preparation
   1.    CAP trapper
   2.    Trehalose extension method
   3.    CAGE library


                     Sequence
Tag sequencing with the next generation sequencer
1.    Genome Sequencer FLX (Roche/454)
2.    Genome Analyzer System (illumina/ Solexa)
3.    SOLiD (Applied Biosystems)


                 Data processing                             GTGCGCGTCGAATATCGAT

   Quality control
   Statistical variation of the obtained sequence
   Extraction of tag sequences
   Clustering
   Mapping
   Statistical variation of the mapping result
   Visualization with “genome browser”
   Statistical analysis
CAGE – Promoter Types


               Nature reviews Genetics, 8(6), 424–436. doi:10.1038/nrg2026
FANTOM4 – A Systems Approach
Monoblast-like THP-1 cells were stimulated by PMA to differentiate them into monocyte-like cells.
10 time point samples were collected during differentiation.


                Monoblast-like                                        Monocyte-like


      0    1      2       4        6       12         24      48        72          96 hour
       PMA


  Replicates                  Microarray check
                                                                             Deep CAGE

  RIKEN1
  RIKEN3                                                                                        TF qRT-PCR
  RIKEN5                                           Not good
  RIKEN6
                           Illumina (47K probes)                             miRNA microarray
                           10 time points
Motif Activity Response Analysis (MARA)
                                  Promoter Analysis & Motif Activity
                                   29,857 promoters were identified.
                     Out of these promoters 23,403 were associated with 9026 genes.
Genome                                                                            eps
                                                                                              CAGE tag

                                   Promoter1   m1 m1 m1 m2 m3
 PMA                               Promoter2                m1         m4

                                       ・・・・
       0h 1h 2h 4h   6h     12h                   48h                    72h                 96h
                                   Promoter
                                   29,857                   m1      m5

            Number of CAGE tags that
            mapped on the same site


                             e ps                   m
                                                      R pm Ams
                          Reaction efficiency
                •    Number of possible binding sites               Effective concentration
                •
   THP-1 cells are a Degree of conservation cell line which upon PMA treatment can differentiate into an
                     monoblastic leukemia of the motif
                •
   adherent monocyte like cell (CD14+, CSF1R+)
                     Chromatin status
                                          Suzuki, Forrest, van Nimwegen et al. Nature Genetics 2009, 41:5
Transcription regulation network consisting of 30 core motifs (F4)
            55 out of 86 edges were supported by experiments/in the literature. (Novel prediction works well!!)
            Enriched GO: from cell growth related to cell function related                           Motif activity

                             Immune             Inflammatory
                             response                                                                     Up
Monocyte                                          response


                                                     Cell adhesion                                        Down


                                                                                                          Transient


                                                                                                Size of nodes:
                                                                                                Significance of motifs


                                                                                                   Edge support
                                                                                                   Green: siRNA
Monoblast                                                 Microtubele                              Red: literature
                       Mitosis                   Cell cycle cytoskele                              Blue: ChIP

                                                                                                    :enriched GO
                                                                                                    for regulated
                          H. Suzuki et al. Nature Genetics, 41:5, 553-562 (2009)                    genes
FANTOM5
              Static networks        Time-courses

                   iPS
      Stem          ES


                                                              State Transition
      basins

       Endo        Meso    Ecto


Differentiated
states                                 FANTOM4
                                                    FANTOM5
Defining a cell (F5)
                                     •Surface markers
                                     •Morphology (shape, volume, polarity)
                                     •Single or multinucleated, enucleated
                                     •Ploidy
                                     •Motility (adherent, resident,
                                     migratory)
                                     •Differentiation potential
                                     •Self renewal potential
                                     •Developmental/lineage history
                                     •Tissue of origin
                                     •Developmental age (doublings?)
                                     •Doubling time
                             Defined outputs (eg growth factors)


                                   Response to inputs


Self reinforcing stable internal network
Defining a cell (F5)
            Chr1 Chr2                                    Chr22   ChrX   ChrY

                                             •Surface markers
Human 1bp                                    •Morphology (shape, volume, polarity)
                                                                        3x10⁹bp
genome                                       •Single or multinucleated, enucleated
                                             •Ploidy
              All promoters on human genome will be revealed.
                                             •Motility (adherent, resident,
                                             migratory)
                                             •Differentiation potential
       The                                   •Self renewal potential
              most objective definition of the cell !!
                                             •Developmental/lineage history
                                             •Tissue of origin
                                             •Developmental age (doublings?)
                                             •Doubling time
                                         Defined outputs (eg growth factors)


                                              Response to inputs


             Self reinforcing stable internal network Transcriptional regulatory NW
High reproducibility of Helicos-CAGE (FANTOM5)


         Heliscope doesn't use PCR, then avoids amplification bias.


r=0.99                    r=0.98        r=0.89            r=0.69


         HeliScope CAGE
Promoters at unexpected area(1)
PUM2


            In adipocyte, this is the only one promoter in this gene

NCOA1


        In adipocyte, this is the only one promoter in this gene
                                                  The 2nd example has good EST evidence
                                                  Both are annotated in Gencode
                                                  Some orphans are NOT orphans
Expression profile (F5)
NKX2-5

            This profile is useful
   for biomarker development
                          Tissue-specific
         Heart-fetal
Selfish DNA
• Transposable elements (TEs)
  – the DNA sequence spreads by forming additional
    copies of itself within the genome
  – makes no specific contribution to the reproductive
    success of its host organism.
  – transposition can be "copy and paste" or "cut and
    paste"
• Nobel prize in 1983 to Barbara McClintock
Expression of Repeat Elements
    Mouse         Human
Nat Genet. 2009 May;41(5):563-71.

Enrichment of TE near TSS
 mouse              human              mouse               human


     Mapping bias                           Over-expression
 Unrelated to expression                   when close to genes
FANTOM Collaborators,                                               Thanks!
Australia          Western Australian Institute for Medical Research
                   Peter KLINKEN, Louise WINTERINGHAM
Canada             McGill University
                   Hisashi MIURA, Josee DOSTIE
            The University of British Columbia, Center for Molecular Medecine and Therapeutics
                   Thomas Jonghyun HA
Denmark            University of Copenhagen, Department of Biology
                   Robin ANDERSSON, Albin SANDELIN, Eivind VALEN
Finland     University of Helsinki, Department of Medical Genetics
                   Alessandro BONETTI
France      University Pierre & Marie Curie, Laboratoire Microorganisms Genomics
                   Hugues RICHARD
Germany            Charité - Universitätsmedizin Berlin, Allergy Center
                   Magda BABINA
            University Hospital Regensburg
                   Christian SCHMIDL, Michael REHLI
Italy       Dulbecco Telethon Institute
                   Valerio ORLANDO, Beatrice BODEGA
            Fondazione Bruno Kessler (FBK)
                   Marco CHIERICI, Cesare FURLANELLO, Marco RONCADOR
            International School for Advanced Studies (SISSA)
                   Stefano GUSTINICH, Silvia ZUCCHELLI
            National Lab of Italian Consortium for Biotechnology (L.N.C.I.B.)
                   Silvano PIAZZA, Claudio SCHNEIDER,            Roberto VERARDO
                                                                                 Thank you.
Japan       Database Center for Life Science
                   Hidemasa BONO
            Keio University, School of Medicine
                   Shigeo KOYASU, Kazuyo MORO, Jun-ichi FURUSAWA               General Organizer
            Kyushu University
                   Daisuke SUGIYAMA                                          Yoshihide HAYASHIZAKI
            National Institute of Advanced Industrial Science and Technology (AIST), Computational Biology   Research Center
(CBRC)
Transcriptional regulation of
adipogenesis is perturbed in obesity
Obesity – Molecular basis
• Medical condition with excess of body fat
• Increased fat mass is associated with a low-grade
  inflammatory state in white adipose tissue
• Adipocytes secrete key inflammatory proteins
  – TNFa, IL6, CCL2 (MCP1)
  – Markedly increased expression in obesity
• CCL2 attracts macrophages from the blood
  stream
• Mechanism of CCL2 expression control poorly
  understood
Social aspects
• Increases the likelihood of various diseases
   – heart disease, type 2 diabetes, obstructive sleep
     apnea, certain types of cancer, and osteoarthritis
• The medical care costs of obesity in the United
  States in 2008 totaled about US$147 billion
  (Health Affairs 2009; 28(5): w822-w831)
Goals
• Find regulators of key obesity genes in man
  – Substantial differences in adipose tissue gene
    expression between obese / non-obese (JCEM, 2005)
  – Includes many genes involved in the functional
    regulation of adipose tissue
     • Adipogenesis, metabolism, adipokine production,
       inflammation
• The regulatory elements that control obesity key
  genes are so far poorly characterized
     • TFs and upstream modulators (epigenetics, miRNAs)
Study design

                                Cohort 1
                                                                           Cohort 2
                                Obese (n=30) and
                                                                           Obese and non-obese
                                non-obese (n=26)
                                                                           women (n=12)
                                women


             1. Hypothesis generation                                      3. Validation & mechanistical studies


                                                                             In vitro
               Intact adipose                         Isolated, mature
                                 2. Relevance                                 differentiated
               tissue                                 fat cells
                                                                             adipocytes


                                                   4. Physiological role


Gene expression                                                                                  Gene expression
miRNA expression                                                                                 Knockdowns
                                                             qRT-PCR of                          Over-expressions
                                                             TFs & miRNAs                        3’ UTR assay
Cohort 1
miRNA expression
• 20 differentially expressed candidates identified
  in WAT (from cohort 1)
      • Some of them previously observed in obese mice
   – Most miRNAs down-regulated in obese samples
      • Fits well with the observation that 90% of differentially
        regulated genes are up-regulated
   – Differential expression validated with qPCR in WAT
      • 14 miRNAs validated in tissue and purified cells
• In mature differentiated fat cells (from cohort 2)
   – All 20 expressed
   – 11 miRNAs diff. expressed and overlapping with WAT
miRNA – functional study
                                                     CCL2 secretion
• CCL2 (MCP1) secretion
• Over-expressing 12 miRNAs in pre-adipocyte
  differentiation
                                                                                                                                                                       CCL2
                                                                                                                                                                       IL6
                     3.0                                                                                                  ***                                          TNF
                                                 **
                     2.5

                     2.0
                                                                                                                  ** **
(microRNA/control)


                                                                                                                                                                                 ***
Relative secretion


                     1.5
                     1.0
                                     ***                                     * * ****        ** **                               **         ***** *
                                                      *** *** ***
                                                        *** ***                           *** *** **                                            ***
                     0.5                                                                                                      *** *** ***
                                                                                                                                     *** ***
                      0
                           Control


                                                                                                                                          Let-7d
                                                                                 Let-7a


                                                                                            miR-16
                                       miR-126


                                                                                                                    miR-145


                                                                                                                                                   miR-143


                                                                                                                                                             miR-652
                                                        miR-193b


                                                                   miR-92a


                                                                                                                                miR-26a
                                                                                                     miR-486-5p


                                                                                                                                                                        miR-342-3p
Gene expression
• Substantial expression differences between obese
  and non-obese human individuals in WAT (cohort
  1)
  –   Many genes differentially expressed
  –   Around 100 transcription factors
  –   90% of genes up-regulated
  –   Confirms previous findings
       • Known up/down-regulated genes
       • GO terms
          – Up: inflammation, extracellular matrix
          – Down: metabolism, insulin signaling
Obesity regulation
• Motif Activity Response Analysis (MARA)
  a) Transcription factor binding site (TFBS) motifs
    with significant difference in activity between
    obese and non-obese, intersected with
  b) targets with significant difference in expression
    according to SAM (5% FDR)
  → nodes in candidate “core” network
Principal Component Analysis
                                                                       on Motif Activities
                                                                                                             Obese                                         55
                             0.15
                                                                                                             Non-obese
Second principal component


                                                                                                                                 Body mass index (kg/m2)
                             0.10                                                                                                                          45
                             0.05
                                                                                                                                                           35
                                                     0

                             -0.05                                                                                                                         25
                             -0.10
                                                                                                                                                           15
                             -0.15
                                                                                                                                                            -0.15 -0.10 -0.05      0    0.05           0.10   0.15
                                 -0.25        -0.15     -0.05                        0.05     0.15
                                                                                                                                                               Second principal component
                                    First principal component


                                                     1400
                                                                                                             160                                                                 80
                              Fat cell volume (pL)


                                                     1050                                                    135                                                                 65


                                                                                                                                                                      Body fat (%)
                                                                                                Waist (cm)


                                                     700                                                     110                                                                 50

                                                     350                                                     85                                                                  35

                                                         0                                                   60                                                                  20
                                                         -0.15 -0.10 -0.05 0 0.05 0.10 0.15                   -0.15-0.10-0.05 0 0.05 0.10 0.15                                    -0.15-0.10-0.05 0 0.05 0.10 0.15
                                                                                                                Second principal component                                          Second principal component
                                                           Second principal component
Regulatory network
• TF regulation from MARA
   – Overlap obesity network and adipogenesis network
• miRNAs into network
   – Based on target predictions (Miranda, TargetScan)
• Final candidate network
   – Developed during adipocyte differentiation
   – Perturbed in obesity
   – Modulated by miRNAs
• Sub-network: inflammation
   – Obesity is characterized by chronic, low-grade inflammation in
     adipose tissue
      • Coupled to obesity related conditions, i.e. insulin sensitivity
      • TNF, IL6, CCL2
Sub-network validation
                     Knock/over-expression
                     → mRNA, protein
  Luciferace assay
Physiological evaluation
                           1.4                                                                             1400


                           0.9                                                                             1050


                                                                            Fat cell volume (pL)
                           0.4                                                                                 700
          Log10 HOMAIR


                           -0.1                                                                                350


                           -0.6                                                                                  0
                               -0.2       0.2        0.6        1.0   1.4                                        -0.2       0.2        0.6        1.0   1.4
                                 Log10 miR-193b levels (A.U.)                                                      Log10 miR-193b levels (A.U.)


                           2.0                                                                                 160


                                                                                    Waist circumference (cm)
                           1.4                                                                                 135
Log10 insulin-stimulated
adipocyte lipogenesis


                           0.8                                                                                 110


                           0.2                                                                                  85


                           -0.4                                                                                 60
                               -0.2       0.2        0.6        1.0   1.4                                        -0.2       0.2        0.6        1.0   1.4
                                 Log10 miR-193b levels (A.U.)                                                      Log10 miR-193b levels (A.U.)
Conclusions
• Regulation of adipose tissue inflammation is
  multilayered
   – Mediated by miRNAs directly and indirectly through TFs
   – Developed during pre-adipocyte differentiation
   – Perturbed in obesity
• Approach is viable for exposing unknown, potentially
  clinically relevant regulation
   – Hypothesis free initial step enables study of other
     processes such as adipogenesis, metabolism and adipokine
     production
• Published in Diabetes on June 11, 2012
Acknowledgments
• Lipid Lab @ Karolinska Institutet
   –   Niklas Mejhert
   –   Peter Arner*
   –   Ingrid Dahlman
   –   Agné Kulyté
   –   Mikael Rydén
• Biozentrum Basel
   – Erik van Nimwegen*
   – Mikhail Pachkov
   – Piotr Balwierz
• OSC RIKEN
   – Erik Arner
   – Yoshihide Hayashizaki
        Grant from MEXT to YH.
Solving challenges in data analysis –
               Conclusion
• Bring together technology and clinical research
  –   Understand experimental system and data in detail
  –   Understand the results of the computational analysis
  –   Jointly & iteratively
  –   Soft skills very helpful
• Aim for concrete findings that can be functionally
  validated

Sequencing the transcriptome reveals complex layers of regulation, Department of Biosciences and Nutrition, Karolinska Institutet, Carsten Daub Copenhagenomics 2012

  • 1.
    Sequencing the transcriptome revealscomplex levels of regulation Carsten O. Daub Copenhagenomics 2012-06-15
  • 2.
    RIKEN – OmicsScience Center (OSC)
  • 3.
    Karolinska Institute Science forLife Laboratory – SciLifeLab Department of Biosciences and Nutrition Technology Hospital
  • 4.
    Outline • Characterize cellson the molecular level • Finding regulators of gene expression – We observe gene expression – What are the regulatory elements causing the observed changes in gene expression? • Example: Inflammation of adipocytes in obesity
  • 5.
    Cap Analysis ofGene Expression method RNA extraction RNA 5’ Gene CAGE library preparation 3’ 1. CAP trapper 遺伝子 Gene Gene Genome 2. Trehalose extension method 3. CAGE library RNA RNA CAP Sequence Tag sequencing with the next-generation sequencer 1. Genome Sequencer FLX (Roche/454) 2. Genome Analyzer System (illumina/ Solexa) 3. SOLiD (Applied Biosystems) Data processing Quality control Statistical variation of the obtained sequence Extraction of tag sequences Clustering Mapping Statistical variation of the mapping result Visualization with “genome browser” Statistical analysis T. Shiraki et al, PNAS, 100, 15776-15781 (2003)
  • 6.
    Traditional CAGE method RNA extraction CAGE library preparation CGCATGGTCGATAGACTTG 1. CAP trapper 2. Trehalose extension method 3. CAGE library GTGCGCGTCGAATATCGAT Sequence CGAATATCGATAGACTTG Tag sequencing with the next generation sequencer 1. Genome Sequencer FLX (Roche/454) 2. Genome Analyzer System (illumina/ Solexa) 3. SOLiD (Applied Biosystems) Data processing Quality control Statistical variation of the obtained sequence Extraction of tag sequences Clustering Mapping Statistical variation of the mapping result Visualization with “genome browser” Statistical analysis T. Shiraki et al, PNAS, 100, 15776-15781 (2003)
  • 7.
    Traditional CAGE method RNA extraction Genome CAGE library preparation 1. CAP trapper 2. Trehalose extension method 3. CAGE library Sequence Tag sequencing with the next generation sequencer 1. Genome Sequencer FLX (Roche/454) 2. Genome Analyzer System (illumina/ Solexa) 3. SOLiD (Applied Biosystems) Data processing GTGCGCGTCGAATATCGAT Quality control Statistical variation of the obtained sequence Extraction of tag sequences Clustering Mapping Statistical variation of the mapping result Visualization with “genome browser” Statistical analysis
  • 8.
    CAGE – PromoterTypes Nature reviews Genetics, 8(6), 424–436. doi:10.1038/nrg2026
  • 9.
    FANTOM4 – ASystems Approach Monoblast-like THP-1 cells were stimulated by PMA to differentiate them into monocyte-like cells. 10 time point samples were collected during differentiation. Monoblast-like Monocyte-like 0 1 2 4 6 12 24 48 72 96 hour PMA Replicates Microarray check Deep CAGE RIKEN1 RIKEN3 TF qRT-PCR RIKEN5 Not good RIKEN6 Illumina (47K probes) miRNA microarray 10 time points
  • 10.
    Motif Activity ResponseAnalysis (MARA) Promoter Analysis & Motif Activity 29,857 promoters were identified. Out of these promoters 23,403 were associated with 9026 genes. Genome eps CAGE tag Promoter1 m1 m1 m1 m2 m3 PMA Promoter2 m1 m4 ・・・・ 0h 1h 2h 4h 6h 12h 48h 72h 96h Promoter 29,857 m1 m5 Number of CAGE tags that mapped on the same site e ps m R pm Ams Reaction efficiency • Number of possible binding sites Effective concentration • THP-1 cells are a Degree of conservation cell line which upon PMA treatment can differentiate into an monoblastic leukemia of the motif • adherent monocyte like cell (CD14+, CSF1R+) Chromatin status Suzuki, Forrest, van Nimwegen et al. Nature Genetics 2009, 41:5
  • 11.
    Transcription regulation networkconsisting of 30 core motifs (F4) 55 out of 86 edges were supported by experiments/in the literature. (Novel prediction works well!!) Enriched GO: from cell growth related to cell function related Motif activity Immune Inflammatory response Up Monocyte response Cell adhesion Down Transient Size of nodes: Significance of motifs Edge support Green: siRNA Monoblast Microtubele Red: literature Mitosis Cell cycle cytoskele Blue: ChIP :enriched GO for regulated H. Suzuki et al. Nature Genetics, 41:5, 553-562 (2009) genes
  • 12.
    FANTOM5 Static networks Time-courses iPS Stem ES State Transition basins Endo Meso Ecto Differentiated states FANTOM4 FANTOM5
  • 13.
    Defining a cell(F5) •Surface markers •Morphology (shape, volume, polarity) •Single or multinucleated, enucleated •Ploidy •Motility (adherent, resident, migratory) •Differentiation potential •Self renewal potential •Developmental/lineage history •Tissue of origin •Developmental age (doublings?) •Doubling time Defined outputs (eg growth factors) Response to inputs Self reinforcing stable internal network
  • 14.
    Defining a cell(F5) Chr1 Chr2 Chr22 ChrX ChrY •Surface markers Human 1bp •Morphology (shape, volume, polarity) 3x10⁹bp genome •Single or multinucleated, enucleated •Ploidy All promoters on human genome will be revealed. •Motility (adherent, resident, migratory) •Differentiation potential The •Self renewal potential most objective definition of the cell !! •Developmental/lineage history •Tissue of origin •Developmental age (doublings?) •Doubling time Defined outputs (eg growth factors) Response to inputs Self reinforcing stable internal network Transcriptional regulatory NW
  • 15.
    High reproducibility ofHelicos-CAGE (FANTOM5) Heliscope doesn't use PCR, then avoids amplification bias. r=0.99 r=0.98 r=0.89 r=0.69 HeliScope CAGE
  • 16.
    Promoters at unexpectedarea(1) PUM2 In adipocyte, this is the only one promoter in this gene NCOA1 In adipocyte, this is the only one promoter in this gene The 2nd example has good EST evidence Both are annotated in Gencode Some orphans are NOT orphans
  • 17.
    Expression profile (F5) NKX2-5 This profile is useful for biomarker development Tissue-specific Heart-fetal
  • 18.
    Selfish DNA • Transposableelements (TEs) – the DNA sequence spreads by forming additional copies of itself within the genome – makes no specific contribution to the reproductive success of its host organism. – transposition can be "copy and paste" or "cut and paste" • Nobel prize in 1983 to Barbara McClintock
  • 19.
    Expression of RepeatElements Mouse Human
  • 20.
    Nat Genet. 2009May;41(5):563-71. Enrichment of TE near TSS mouse human mouse human Mapping bias Over-expression Unrelated to expression when close to genes
  • 21.
    FANTOM Collaborators, Thanks! Australia Western Australian Institute for Medical Research Peter KLINKEN, Louise WINTERINGHAM Canada McGill University Hisashi MIURA, Josee DOSTIE The University of British Columbia, Center for Molecular Medecine and Therapeutics Thomas Jonghyun HA Denmark University of Copenhagen, Department of Biology Robin ANDERSSON, Albin SANDELIN, Eivind VALEN Finland University of Helsinki, Department of Medical Genetics Alessandro BONETTI France University Pierre & Marie Curie, Laboratoire Microorganisms Genomics Hugues RICHARD Germany Charité - Universitätsmedizin Berlin, Allergy Center Magda BABINA University Hospital Regensburg Christian SCHMIDL, Michael REHLI Italy Dulbecco Telethon Institute Valerio ORLANDO, Beatrice BODEGA Fondazione Bruno Kessler (FBK) Marco CHIERICI, Cesare FURLANELLO, Marco RONCADOR International School for Advanced Studies (SISSA) Stefano GUSTINICH, Silvia ZUCCHELLI National Lab of Italian Consortium for Biotechnology (L.N.C.I.B.) Silvano PIAZZA, Claudio SCHNEIDER, Roberto VERARDO Thank you. Japan Database Center for Life Science Hidemasa BONO Keio University, School of Medicine Shigeo KOYASU, Kazuyo MORO, Jun-ichi FURUSAWA General Organizer Kyushu University Daisuke SUGIYAMA Yoshihide HAYASHIZAKI National Institute of Advanced Industrial Science and Technology (AIST), Computational Biology Research Center (CBRC)
  • 23.
  • 24.
    Obesity – Molecularbasis • Medical condition with excess of body fat • Increased fat mass is associated with a low-grade inflammatory state in white adipose tissue • Adipocytes secrete key inflammatory proteins – TNFa, IL6, CCL2 (MCP1) – Markedly increased expression in obesity • CCL2 attracts macrophages from the blood stream • Mechanism of CCL2 expression control poorly understood
  • 25.
    Social aspects • Increasesthe likelihood of various diseases – heart disease, type 2 diabetes, obstructive sleep apnea, certain types of cancer, and osteoarthritis • The medical care costs of obesity in the United States in 2008 totaled about US$147 billion (Health Affairs 2009; 28(5): w822-w831)
  • 26.
    Goals • Find regulatorsof key obesity genes in man – Substantial differences in adipose tissue gene expression between obese / non-obese (JCEM, 2005) – Includes many genes involved in the functional regulation of adipose tissue • Adipogenesis, metabolism, adipokine production, inflammation • The regulatory elements that control obesity key genes are so far poorly characterized • TFs and upstream modulators (epigenetics, miRNAs)
  • 27.
    Study design Cohort 1 Cohort 2 Obese (n=30) and Obese and non-obese non-obese (n=26) women (n=12) women 1. Hypothesis generation 3. Validation & mechanistical studies In vitro Intact adipose Isolated, mature 2. Relevance differentiated tissue fat cells adipocytes 4. Physiological role Gene expression Gene expression miRNA expression Knockdowns qRT-PCR of Over-expressions TFs & miRNAs 3’ UTR assay
  • 28.
  • 29.
    miRNA expression • 20differentially expressed candidates identified in WAT (from cohort 1) • Some of them previously observed in obese mice – Most miRNAs down-regulated in obese samples • Fits well with the observation that 90% of differentially regulated genes are up-regulated – Differential expression validated with qPCR in WAT • 14 miRNAs validated in tissue and purified cells • In mature differentiated fat cells (from cohort 2) – All 20 expressed – 11 miRNAs diff. expressed and overlapping with WAT
  • 30.
    miRNA – functionalstudy CCL2 secretion • CCL2 (MCP1) secretion • Over-expressing 12 miRNAs in pre-adipocyte differentiation CCL2 IL6 3.0 *** TNF ** 2.5 2.0 ** ** (microRNA/control) *** Relative secretion 1.5 1.0 *** * * **** ** ** ** ***** * *** *** *** *** *** *** *** ** *** 0.5 *** *** *** *** *** 0 Control Let-7d Let-7a miR-16 miR-126 miR-145 miR-143 miR-652 miR-193b miR-92a miR-26a miR-486-5p miR-342-3p
  • 31.
    Gene expression • Substantialexpression differences between obese and non-obese human individuals in WAT (cohort 1) – Many genes differentially expressed – Around 100 transcription factors – 90% of genes up-regulated – Confirms previous findings • Known up/down-regulated genes • GO terms – Up: inflammation, extracellular matrix – Down: metabolism, insulin signaling
  • 32.
    Obesity regulation • MotifActivity Response Analysis (MARA) a) Transcription factor binding site (TFBS) motifs with significant difference in activity between obese and non-obese, intersected with b) targets with significant difference in expression according to SAM (5% FDR) → nodes in candidate “core” network
  • 33.
    Principal Component Analysis on Motif Activities Obese 55 0.15 Non-obese Second principal component Body mass index (kg/m2) 0.10 45 0.05 35 0 -0.05 25 -0.10 15 -0.15 -0.15 -0.10 -0.05 0 0.05 0.10 0.15 -0.25 -0.15 -0.05 0.05 0.15 Second principal component First principal component 1400 160 80 Fat cell volume (pL) 1050 135 65 Body fat (%) Waist (cm) 700 110 50 350 85 35 0 60 20 -0.15 -0.10 -0.05 0 0.05 0.10 0.15 -0.15-0.10-0.05 0 0.05 0.10 0.15 -0.15-0.10-0.05 0 0.05 0.10 0.15 Second principal component Second principal component Second principal component
  • 34.
    Regulatory network • TFregulation from MARA – Overlap obesity network and adipogenesis network • miRNAs into network – Based on target predictions (Miranda, TargetScan) • Final candidate network – Developed during adipocyte differentiation – Perturbed in obesity – Modulated by miRNAs • Sub-network: inflammation – Obesity is characterized by chronic, low-grade inflammation in adipose tissue • Coupled to obesity related conditions, i.e. insulin sensitivity • TNF, IL6, CCL2
  • 35.
    Sub-network validation Knock/over-expression → mRNA, protein Luciferace assay
  • 36.
    Physiological evaluation 1.4 1400 0.9 1050 Fat cell volume (pL) 0.4 700 Log10 HOMAIR -0.1 350 -0.6 0 -0.2 0.2 0.6 1.0 1.4 -0.2 0.2 0.6 1.0 1.4 Log10 miR-193b levels (A.U.) Log10 miR-193b levels (A.U.) 2.0 160 Waist circumference (cm) 1.4 135 Log10 insulin-stimulated adipocyte lipogenesis 0.8 110 0.2 85 -0.4 60 -0.2 0.2 0.6 1.0 1.4 -0.2 0.2 0.6 1.0 1.4 Log10 miR-193b levels (A.U.) Log10 miR-193b levels (A.U.)
  • 37.
    Conclusions • Regulation ofadipose tissue inflammation is multilayered – Mediated by miRNAs directly and indirectly through TFs – Developed during pre-adipocyte differentiation – Perturbed in obesity • Approach is viable for exposing unknown, potentially clinically relevant regulation – Hypothesis free initial step enables study of other processes such as adipogenesis, metabolism and adipokine production • Published in Diabetes on June 11, 2012
  • 38.
    Acknowledgments • Lipid Lab@ Karolinska Institutet – Niklas Mejhert – Peter Arner* – Ingrid Dahlman – Agné Kulyté – Mikael Rydén • Biozentrum Basel – Erik van Nimwegen* – Mikhail Pachkov – Piotr Balwierz • OSC RIKEN – Erik Arner – Yoshihide Hayashizaki Grant from MEXT to YH.
  • 39.
    Solving challenges indata analysis – Conclusion • Bring together technology and clinical research – Understand experimental system and data in detail – Understand the results of the computational analysis – Jointly & iteratively – Soft skills very helpful • Aim for concrete findings that can be functionally validated