Download as PDF, PPTX


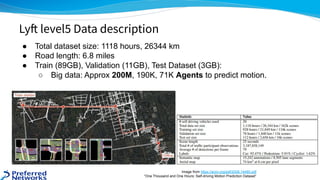


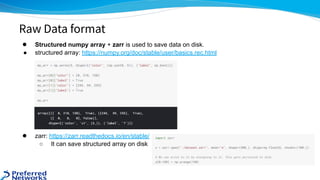


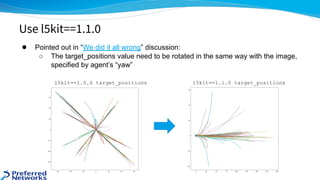

![● https://www.kaggle.com/c/lyft-motion-prediction-autonomous-vehicles/discussion/201493
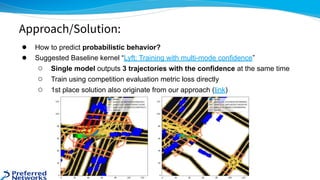
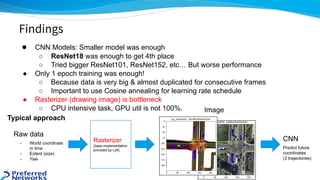
● Optimize Rasterizer implementation
→ 8 GPU * 2 days for 1 epoch
● Hyperparameters with “heavy” training
○ Semantic + Satellite images
○ Bigger image (448 * 224) ← (224, 224)
○ num history: 30 ← 10
○ min_future: 5 ← 10
○ Modify agent filter threshold
○ batch_size: 64
etc...
● Pre-training small image 4 epoch → Fine tune big image 1 epoch
○ It was very effective
[1st place solution] : L5kit Speedup](https://image.slidesharecdn.com/slidesharekagglelyftmotionpredictioncompetition-201225032229/85/Kaggle-Lyft-Motion-Prediction-for-Autonomous-Vehicles-4th-Place-Solution-38-320.jpg)
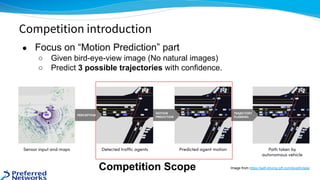
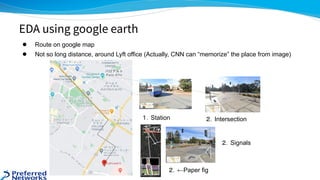
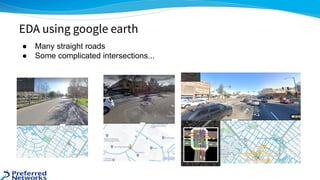
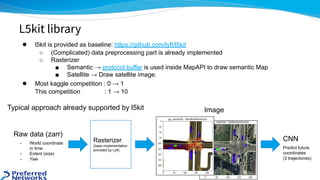
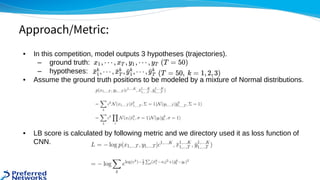
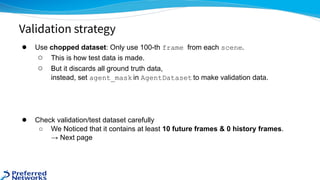
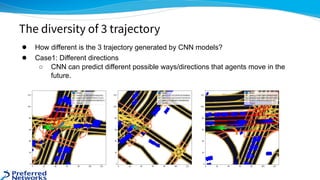
![● 10th place solution GNN based methods called VectorNet
○ Faster training & inference
■ They did not use rasterized images at all
■ 11 GPU hours for 1 epoch (Our CNN needs about 960 GPU hours)
○ Comparable performance to CNN-based methods
Other interesting approaches: VectorNet
VectorNet [Gao+, CVPR2020]
VectorNet
CNN
CNN
(or not shared)](https://image.slidesharecdn.com/slidesharekagglelyftmotionpredictioncompetition-201225032229/85/Kaggle-Lyft-Motion-Prediction-for-Autonomous-Vehicles-4th-Place-Solution-39-320.jpg)


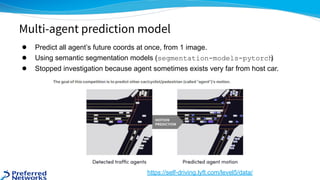


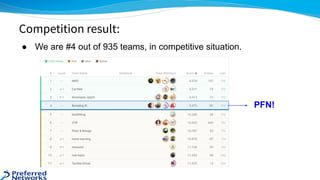
The document outlines the 4th place solution for the Kaggle Lyft motion prediction competition, where participants predicted future trajectories of vehicles using a bird-eye view image dataset. It details the competition's focus on motion prediction for autonomous vehicles, the data and technology stack used, and the team's approach including data preprocessing, model selection, training strategies, and ensembling techniques for performance enhancement. Key takeaway includes insights on utilizing the full dataset and various CNN models, highlighting distributed training and hyperparameter optimization as critical factors for success.


![[Paper Reading] Attention is All You Need](https://cdn.slidesharecdn.com/ss_thumbnails/reading20181228-190111054908-thumbnail.jpg?width=640&height=640&fit=bounds)