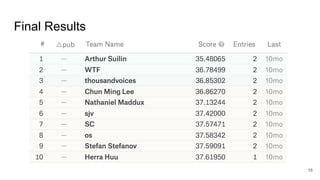
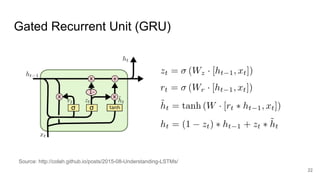
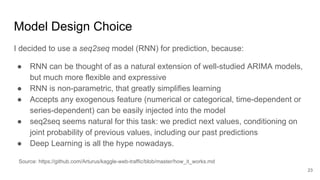
Web Traffic
Time Series Forecasting
Kaggle Competition Review
Bill Tubbs
July 26, 2018
Competition Summary
● Goal: Forecast future web traffic for ~145,000 Wikipedia
articles
● When: 8 months ago
● Sponsored by Google and Voleon
● 375 teams
● Prizes {1: $12,000, 2: $8,000, 3: $5,000}
+ Present at NIPS Time Series Workshop in California
URL: https://www.kaggle.com/c/web-traffic-time-series-forecasting
2
Presentation Overview
● The problem
● The data
● The evaluation metric
● The leaderboard
● Overview of winner’s solution
● What I learned
3
The Problem
● Forecasting future web traffic for approximately 145,000
Wikipedia articles.
○ Why?
● Forecasting future values of multiple time series is
“one of the most challenging problems in the field”
4
URL: https://www.kaggle.com/c/web-traffic-time-series-forecasting
Time Series Analysis And Forecasting
5
URL: https://en.wikipedia.org/wiki/Time_series
Dynamic
System
Competition Timeline
● Training phase:
○ Forecast traffic in January and February 2017 based on historical data
from July 2015 to December 2016
● Future phase:
○ Forecast future traffic between September 13th and November 13th,
2017 based on data up to September 1st, 2017
● September 1, 2017 - Final dataset released
● September 12, 2017 - Final submission deadline
● November 13, 2017 - Competition winners revealed
6
URL: https://www.kaggle.com/c/web-traffic-time-series-forecasting
The Data
7
URL: https://www.kaggle.com/c/web-traffic-time-series-forecasting/data
The Data
● 145,000 time series:
○ Daily page views, 2015-07-01 to 2016-12-31
"Page","2015-07-01","2015-07-02","2015-07-03",… "2016-12-31"
"2NE1_zh.wikipedia.org_all-access_spider",18,11,5,… 20
"2PM_zh.wikipedia.org_all-access_spider",11,14,15,… 20
…
"Bogotá_es.wikipedia.org_all-access_all-agents",2685,2849,3045,… 1967
…
"陳法拉_zh.wikipedia.org_mobile-web_all-agents",293,474,252,… 192
…
train_1.csv
8
traffic data
page name
The Data
● List of keys
"Page","Id"
"!vote_en.wikipedia.org_all-access_all-agents_2017-01-01",bf4edcf969af
"!vote_en.wikipedia.org_all-access_all-agents_2017-01-02",929ed2bf52b9
…
"Bogotá_es.wikipedia.org_all-access_all-agents_2017-01-23",25e7cc352d8e
…
"陳法拉_zh.wikipedia.org_mobile-web_all-agents_2017-02-03",50fa6fe170be
…
key_1.csv
9
shortened id
The Data
● Sample submission
Id,Visits
bf4edcf969af,0
929ed2bf52b9,0
ff29d0f51d5c,0
e98873359be6,0
fa012434263a,0
…
sample_submission_1.csv
10
Your predictions go here!
The Data
11
The Data
12
The Data
13
Evaluation
● Metric:
○ SMAPE - Symmetric mean absolute percentage error
○ Based on percentage (or relative) errors
14
where At
is actual value, Ft
is forecast value
URL: https://en.wikipedia.org/wiki/Symmetric_mean_absolute_percentage_error
Evaluation
● SMAPE
15
Final Results
16
Winner
17
Intuition
18
There are two main information sources for prediction:
● Local features.
○ If we see a trend, we expect that it will continue (auto-regressive model)
○ If we see a traffic spike, it will gradually decay (moving-average model)
○ If we see more traffic on holidays, we expect to have more traffic on
holidays in the future (seasonal model).
● Global features
○ If we look to autocorrelation plot, we'll notice strong year-to-year
autocorrelation and some quarter-to-quarter autocorrelation.
Source: https://github.com/Arturus/kaggle-web-traffic/blob/master/how_it_works.md
Autocorrelation Plot
19
Source: https://github.com/Arturus/kaggle-web-traffic/blob/master/how_it_works.md
Model
● Encoder is cuDNN GRU.
● Decoder is TF GRUBlockCell, wrapped in tf.while_loop() construct.
20
Source: https://github.com/Arturus/kaggle-web-traffic/blob/master/how_it_works.md
Sequence-to-sequence model
Recurrent Neural Networks (RNNs)
21
Source: https://www.coursera.org/specializations/deep-learning
Gated Recurrent Unit (GRU)
22
Source: http://colah.github.io/posts/2015-08-Understanding-LSTMs/
Model Design Choice
23
I decided to use a seq2seq model (RNN) for prediction, because:
● RNN can be thought of as a natural extension of well-studied ARIMA models,
but much more flexible and expressive
● RNN is non-parametric, that greatly simplifies learning
● Accepts any exogenous feature (numerical or categorical, time-dependent or
series-dependent) can be easily injected into the model
● seq2seq seems natural for this task: we predict next values, conditioning on
joint probability of previous values, including our past predictions
● Deep Learning is all the hype nowadays.
Source: https://github.com/Arturus/kaggle-web-traffic/blob/master/how_it_works.md
Feature Engineering
24
Minimalistic because RNN is able to discover and learn features on its own:
1. pageviews - raw values transformed by log1p() to get more-or-less normal
intra-series values distribution, instead of skewed one.
2. agent, country, site - extracted from page urls and one-hot encoded
3. day of week - to capture weekly seasonality
4. year-to-year, quarter-to-quarter autocorrelation - to capture yearly and
quarterly seasonality strength
5. page popularity (median of pageviews) - helps to capture traffic scale. High
traffic and low traffic pages have different traffic change patterns.
6. lagged pageviews - I'll describe this feature later
Source: https://github.com/Arturus/kaggle-web-traffic/blob/master/how_it_works.md
Model
● On sequences longer than 100-300 items, even LSTM/GRU can gradually
forget the oldest items
● First method was to use some kind of attention
● E.g. Fixed-weight sliding-window attention:
25
Working with long timeseries
Source: https://github.com/Arturus/kaggle-web-traffic/blob/master/how_it_works.md
Model
Unsatisfied by complexity of
attention mechanics, I removed
attention completely and just took
important (year, half-year, quarter
ago) data points from the past and
used them as additional features for
encoder and decoder.
26
Working with long timeseries
Source: https://github.com/Arturus/kaggle-web-traffic/blob/master/how_it_works.md
Training
27
Source: https://github.com/Arturus/kaggle-web-traffic/blob/master/how_it_works.md
● SMAPE can't be used directly, because
of unstable behavior near zero values
(loss is a step function if truth value is
zero)
● Used a smoothed differentiable
SMAPE variant, which is well-behaved
at all real numbers:
epsilon = 0.1
summ = tf.maximum(tf.abs(true) + tf.abs(predicted) + epsilon, 0.5 + epsilon)
smape = tf.abs(predicted - true) / summ * 2.0
Training
28
Source: https://github.com/Arturus/kaggle-web-traffic/blob/master/how_it_works.md
There are two ways to split time series into training and validation datasets:
Training
29
● Model trains on random fixed-length samples from original time series.
● Training code randomly chooses starting point for each time series on each
step, generating endless stream of almost non-repeating data.
● This sampling is effectively a data augmentation mechanism
● Used COCOB optimizer for training, in combination with gradient clipping
● COCOB tries to predict optimal learning rate for every training step, so you
don't have to tune learning rate at all*
● It also converges considerably faster than traditional momentum-based
optimizers, especially on first epochs, allowing me to stop unsuccessful
experiments early.
* See paper Training Deep Networks without Learning Rates Through Coin Betting.
Source: https://github.com/Arturus/kaggle-web-traffic/blob/master/how_it_works.md
Training
30
Source: https://github.com/Arturus/kaggle-web-traffic/blob/master/how_it_works.md
● During training, performance
fluctuated wildly from step to step.
Issues
31
Source: https://github.com/Arturus/kaggle-web-traffic/blob/master/how_it_works.md
● Model has inevitably high variance - due to very noisy input data
(variance = difference between error in training and error in future prediction)
● Same model trained on different seeds can have different performance
● Sometimes model even diverges on "unfortunate" seeds.
Reducing Model Variance
32
Source: https://github.com/Arturus/kaggle-web-traffic/blob/master/how_it_works.md
1. Chose a region when model is trained well enough, but has not started to
overfit: 10,500 and 11,500 training steps then saved checkpoints every 100
steps in this region
2. Trained 3 models on different seeds and saved checkpoints from each model.
Took average predictions from all 30 (10x3) models
3. Used SGD averaging (ASGD) - maintain moving averages of network weights
during training and use these instead of original ones, during inference
● Combination of the three methods worked well
● Got roughly the same SMAPE error on leaderboard (for future data) as for
validation on historical data.
Hyper-parameter Tuning
33
Source: https://github.com/Arturus/kaggle-web-traffic/blob/master/how_it_works.md
● There are many model parameters (number of layers, layer depths, activation
functions, dropout coefficients, etc) that can be tuned to achieve optimal
performance.
● Used the SMAC3 package to automate hyperparameter search.
● Contrary to my expectations, hyper-parameter search did not find well-defined
global minima
● All best models had roughly the same performance, but different parameters.
● Probably RNN model is too expressive for this task, and best model score
depends more on the signal-to-noise ratio than on the model architecture.
Predictions
34
URL: https://github.com/Arturus/kaggle-web-traffic
What I Learned
35
● Explore the data
● Look at performance of traditional methods
● Use intuition to find features that could be useful
● Choose the right cost function - matched to evaluation metric + optimizer
● The rest is luck or magic!
● ...
Also: Trying to run someone else’s code on another person’s machine is a
nightmare!
Thank You
36
2nd Place
37
“Got a PhD in machine learning in a
previous millennium, ML was very
different from now, and therefore this
PhD is useless…”
“this is the first time I'm using
deep learning”
2nd Place Submission
38
Based on 5 ideas:
1. Use the yearly seasonality of the data - it is huge
2. Don’t use RMSE. Approximate SMAPE with log1p transformed data and use
custom objective functions for each optimizer
3. Get rid of outliers
4. Ensemble everything in xgboost by training it on the residuals of the Keras
predictions and the same features as my XGBoost model plus out of fold
predictions from Huber regressor and Keras model
5. Use medians as features instead of raw values.
Source: https://www.kaggle.com/c/web-traffic-time-series-forecasting/discussion/39395
2nd Place Submission
39
Source:
https://www.ibm.com/developerworks/community/blogs/jfp/entry/2nd_Prize_WInning_Solution_
to_Web_Traffic_Forecasting_competition_on_Kaggle?lang=en
https://github.com/jfpuget/Kaggle/tree/master/WebTrafficPrediction
● Feedforward network: [200, 200, 100, 200] units in each layer
● Input is concatenated again with the output of the first layer (I don't know why
but this boosted accuracy)
● Activation is relu except for last one which is linear
● Used dropout of 0.5 for almost all layers (0.5 was selected by CV)
● Used a batch normalization for the middle layer
● Model is compiled with adam optimizer and the loss function defined above.
● I tried CNNs and RNNs (LSTM, and Seq2Seq) but did not get results as good
as the simple feed-forward network.

Web Traffic Time Series Forecasting

  • 1.
    Web Traffic Time SeriesForecasting Kaggle Competition Review Bill Tubbs July 26, 2018
  • 2.
    Competition Summary ● Goal:Forecast future web traffic for ~145,000 Wikipedia articles ● When: 8 months ago ● Sponsored by Google and Voleon ● 375 teams ● Prizes {1: $12,000, 2: $8,000, 3: $5,000} + Present at NIPS Time Series Workshop in California URL: https://www.kaggle.com/c/web-traffic-time-series-forecasting 2
  • 3.
    Presentation Overview ● Theproblem ● The data ● The evaluation metric ● The leaderboard ● Overview of winner’s solution ● What I learned 3
  • 4.
    The Problem ● Forecastingfuture web traffic for approximately 145,000 Wikipedia articles. ○ Why? ● Forecasting future values of multiple time series is “one of the most challenging problems in the field” 4 URL: https://www.kaggle.com/c/web-traffic-time-series-forecasting
  • 5.
    Time Series AnalysisAnd Forecasting 5 URL: https://en.wikipedia.org/wiki/Time_series Dynamic System
  • 6.
    Competition Timeline ● Trainingphase: ○ Forecast traffic in January and February 2017 based on historical data from July 2015 to December 2016 ● Future phase: ○ Forecast future traffic between September 13th and November 13th, 2017 based on data up to September 1st, 2017 ● September 1, 2017 - Final dataset released ● September 12, 2017 - Final submission deadline ● November 13, 2017 - Competition winners revealed 6 URL: https://www.kaggle.com/c/web-traffic-time-series-forecasting
  • 7.
  • 8.
    The Data ● 145,000time series: ○ Daily page views, 2015-07-01 to 2016-12-31 "Page","2015-07-01","2015-07-02","2015-07-03",… "2016-12-31" "2NE1_zh.wikipedia.org_all-access_spider",18,11,5,… 20 "2PM_zh.wikipedia.org_all-access_spider",11,14,15,… 20 … "Bogotá_es.wikipedia.org_all-access_all-agents",2685,2849,3045,… 1967 … "陳法拉_zh.wikipedia.org_mobile-web_all-agents",293,474,252,… 192 … train_1.csv 8 traffic data page name
  • 9.
    The Data ● Listof keys "Page","Id" "!vote_en.wikipedia.org_all-access_all-agents_2017-01-01",bf4edcf969af "!vote_en.wikipedia.org_all-access_all-agents_2017-01-02",929ed2bf52b9 … "Bogotá_es.wikipedia.org_all-access_all-agents_2017-01-23",25e7cc352d8e … "陳法拉_zh.wikipedia.org_mobile-web_all-agents_2017-02-03",50fa6fe170be … key_1.csv 9 shortened id
  • 10.
    The Data ● Samplesubmission Id,Visits bf4edcf969af,0 929ed2bf52b9,0 ff29d0f51d5c,0 e98873359be6,0 fa012434263a,0 … sample_submission_1.csv 10 Your predictions go here!
  • 11.
  • 12.
  • 13.
  • 14.
    Evaluation ● Metric: ○ SMAPE- Symmetric mean absolute percentage error ○ Based on percentage (or relative) errors 14 where At is actual value, Ft is forecast value URL: https://en.wikipedia.org/wiki/Symmetric_mean_absolute_percentage_error
  • 15.
  • 16.
  • 17.
  • 18.
    Intuition 18 There are twomain information sources for prediction: ● Local features. ○ If we see a trend, we expect that it will continue (auto-regressive model) ○ If we see a traffic spike, it will gradually decay (moving-average model) ○ If we see more traffic on holidays, we expect to have more traffic on holidays in the future (seasonal model). ● Global features ○ If we look to autocorrelation plot, we'll notice strong year-to-year autocorrelation and some quarter-to-quarter autocorrelation. Source: https://github.com/Arturus/kaggle-web-traffic/blob/master/how_it_works.md
  • 19.
  • 20.
    Model ● Encoder iscuDNN GRU. ● Decoder is TF GRUBlockCell, wrapped in tf.while_loop() construct. 20 Source: https://github.com/Arturus/kaggle-web-traffic/blob/master/how_it_works.md Sequence-to-sequence model
  • 21.
    Recurrent Neural Networks(RNNs) 21 Source: https://www.coursera.org/specializations/deep-learning
  • 22.
    Gated Recurrent Unit(GRU) 22 Source: http://colah.github.io/posts/2015-08-Understanding-LSTMs/
  • 23.
    Model Design Choice 23 Idecided to use a seq2seq model (RNN) for prediction, because: ● RNN can be thought of as a natural extension of well-studied ARIMA models, but much more flexible and expressive ● RNN is non-parametric, that greatly simplifies learning ● Accepts any exogenous feature (numerical or categorical, time-dependent or series-dependent) can be easily injected into the model ● seq2seq seems natural for this task: we predict next values, conditioning on joint probability of previous values, including our past predictions ● Deep Learning is all the hype nowadays. Source: https://github.com/Arturus/kaggle-web-traffic/blob/master/how_it_works.md
  • 24.
    Feature Engineering 24 Minimalistic becauseRNN is able to discover and learn features on its own: 1. pageviews - raw values transformed by log1p() to get more-or-less normal intra-series values distribution, instead of skewed one. 2. agent, country, site - extracted from page urls and one-hot encoded 3. day of week - to capture weekly seasonality 4. year-to-year, quarter-to-quarter autocorrelation - to capture yearly and quarterly seasonality strength 5. page popularity (median of pageviews) - helps to capture traffic scale. High traffic and low traffic pages have different traffic change patterns. 6. lagged pageviews - I'll describe this feature later Source: https://github.com/Arturus/kaggle-web-traffic/blob/master/how_it_works.md
  • 25.
    Model ● On sequenceslonger than 100-300 items, even LSTM/GRU can gradually forget the oldest items ● First method was to use some kind of attention ● E.g. Fixed-weight sliding-window attention: 25 Working with long timeseries Source: https://github.com/Arturus/kaggle-web-traffic/blob/master/how_it_works.md
  • 26.
    Model Unsatisfied by complexityof attention mechanics, I removed attention completely and just took important (year, half-year, quarter ago) data points from the past and used them as additional features for encoder and decoder. 26 Working with long timeseries Source: https://github.com/Arturus/kaggle-web-traffic/blob/master/how_it_works.md
  • 27.
    Training 27 Source: https://github.com/Arturus/kaggle-web-traffic/blob/master/how_it_works.md ● SMAPEcan't be used directly, because of unstable behavior near zero values (loss is a step function if truth value is zero) ● Used a smoothed differentiable SMAPE variant, which is well-behaved at all real numbers: epsilon = 0.1 summ = tf.maximum(tf.abs(true) + tf.abs(predicted) + epsilon, 0.5 + epsilon) smape = tf.abs(predicted - true) / summ * 2.0
  • 28.
    Training 28 Source: https://github.com/Arturus/kaggle-web-traffic/blob/master/how_it_works.md There aretwo ways to split time series into training and validation datasets:
  • 29.
    Training 29 ● Model trainson random fixed-length samples from original time series. ● Training code randomly chooses starting point for each time series on each step, generating endless stream of almost non-repeating data. ● This sampling is effectively a data augmentation mechanism ● Used COCOB optimizer for training, in combination with gradient clipping ● COCOB tries to predict optimal learning rate for every training step, so you don't have to tune learning rate at all* ● It also converges considerably faster than traditional momentum-based optimizers, especially on first epochs, allowing me to stop unsuccessful experiments early. * See paper Training Deep Networks without Learning Rates Through Coin Betting. Source: https://github.com/Arturus/kaggle-web-traffic/blob/master/how_it_works.md
  • 30.
  • 31.
    Issues 31 Source: https://github.com/Arturus/kaggle-web-traffic/blob/master/how_it_works.md ● Modelhas inevitably high variance - due to very noisy input data (variance = difference between error in training and error in future prediction) ● Same model trained on different seeds can have different performance ● Sometimes model even diverges on "unfortunate" seeds.
  • 32.
    Reducing Model Variance 32 Source:https://github.com/Arturus/kaggle-web-traffic/blob/master/how_it_works.md 1. Chose a region when model is trained well enough, but has not started to overfit: 10,500 and 11,500 training steps then saved checkpoints every 100 steps in this region 2. Trained 3 models on different seeds and saved checkpoints from each model. Took average predictions from all 30 (10x3) models 3. Used SGD averaging (ASGD) - maintain moving averages of network weights during training and use these instead of original ones, during inference ● Combination of the three methods worked well ● Got roughly the same SMAPE error on leaderboard (for future data) as for validation on historical data.
  • 33.
    Hyper-parameter Tuning 33 Source: https://github.com/Arturus/kaggle-web-traffic/blob/master/how_it_works.md ●There are many model parameters (number of layers, layer depths, activation functions, dropout coefficients, etc) that can be tuned to achieve optimal performance. ● Used the SMAC3 package to automate hyperparameter search. ● Contrary to my expectations, hyper-parameter search did not find well-defined global minima ● All best models had roughly the same performance, but different parameters. ● Probably RNN model is too expressive for this task, and best model score depends more on the signal-to-noise ratio than on the model architecture.
  • 34.
  • 35.
    What I Learned 35 ●Explore the data ● Look at performance of traditional methods ● Use intuition to find features that could be useful ● Choose the right cost function - matched to evaluation metric + optimizer ● The rest is luck or magic! ● ... Also: Trying to run someone else’s code on another person’s machine is a nightmare!
  • 36.
  • 37.
    2nd Place 37 “Got aPhD in machine learning in a previous millennium, ML was very different from now, and therefore this PhD is useless…” “this is the first time I'm using deep learning”
  • 38.
    2nd Place Submission 38 Basedon 5 ideas: 1. Use the yearly seasonality of the data - it is huge 2. Don’t use RMSE. Approximate SMAPE with log1p transformed data and use custom objective functions for each optimizer 3. Get rid of outliers 4. Ensemble everything in xgboost by training it on the residuals of the Keras predictions and the same features as my XGBoost model plus out of fold predictions from Huber regressor and Keras model 5. Use medians as features instead of raw values. Source: https://www.kaggle.com/c/web-traffic-time-series-forecasting/discussion/39395
  • 39.
    2nd Place Submission 39 Source: https://www.ibm.com/developerworks/community/blogs/jfp/entry/2nd_Prize_WInning_Solution_ to_Web_Traffic_Forecasting_competition_on_Kaggle?lang=en https://github.com/jfpuget/Kaggle/tree/master/WebTrafficPrediction ●Feedforward network: [200, 200, 100, 200] units in each layer ● Input is concatenated again with the output of the first layer (I don't know why but this boosted accuracy) ● Activation is relu except for last one which is linear ● Used dropout of 0.5 for almost all layers (0.5 was selected by CV) ● Used a batch normalization for the middle layer ● Model is compiled with adam optimizer and the loss function defined above. ● I tried CNNs and RNNs (LSTM, and Seq2Seq) but did not get results as good as the simple feed-forward network.