Download to read offline
![International Research Journal of Engineering and Technology (IRJET) e-ISSN: 2395-0056
Volume: 06 Issue: 05 | May 2019 www.irjet.net p-ISSN: 2395-0072
© 2019, IRJET | Impact Factor value: 7.211 | ISO 9001:2008 Certified Journal | Page 5970
1.1 Related Works
Many classifiers were designed to classify DR. Most of
them are binary classifiers, that is it classify data only into
two classes: normal, and DR affected [4][5][3]. In [4][3]
describes the use of image processing and deep learning
methods to diagnose diabetic retinopathy from retinal
fundus images. In [4], for the retinal fundus images
enhancement approach V transform algorithm and
histogram equalization techniques were used and a
Gaussian low-pass filter was applied to the retinal fundus
image. The classification was made using the Convolutional
Neural Network. In that experiment [4], the accuracy was
96.67%.
Work in [5] focuses on developing a mobile application
for real-time screening of diabetic retinopathy. It was
created using a tensorflow architecture. The convolutional
neural network model used in [5] was MobileNets, which
are designed for mobile devices. It consists of 28
convolutional layers. A label, diabetic retinopathy or no
diabetic retinopathy, is the output. The model obtained an
accuracy of 73.3%. This model was specially designed for
mobile devices.
[2] designs a classifier to predict the DR stage from
fluorescein angiography photographs using state-of-the-art
convolutional neural networks (CNNs). Fluorescein
angiography photographs represent the blood flow in the
retina. The photographs are able to show abnormal blood
vessels or damage in the retina. Fluorescein angiography
photographs are black and white photographs. [1] design a
classifier using three state-of-the-art convolutional neural
networks (CNNs) separately and measure the accuracy of
each network. It shows that InceptionNet has achieved the
highest accuracy of 63.23%.
1.2 Our System
In our system, we design three state-of-the-art CNNs and
concatenate their features to develop a system that
classifies different stages of DR from the color fundoscopic
images. The classification is done based on the severity of
five DR stages. For this classification, deep learning based
CNN networks is deployed. From the past, many medical
studies were conducted on the field of designing a
algorithm to classify DR from a retinal fundus image
[1][4]. But they were just binary classifiers which only
differentiate two stages of DR including Normal and DR
affected. Two previous works, that also tries to build a DR
classifier using CNN is in [1] and [2]. But, the results
obtained in [1] and [2] have a lower prediction accuracy,
when relating to this work.
In this work, we check the prediction accuracy of
different deep convolutional neural network architectures
and the combination of these networks when they are
deployed as a DR stage classifier. The study was done
based on the Kaggle dataset which contains 500 images of
retinas. We found that after concatenating VGG16,
AlexNet, and InceptionNet V3, the classifier provides the
highest accuracy of 80.1%.
2. PRELIMINARY KNOWLEDGE
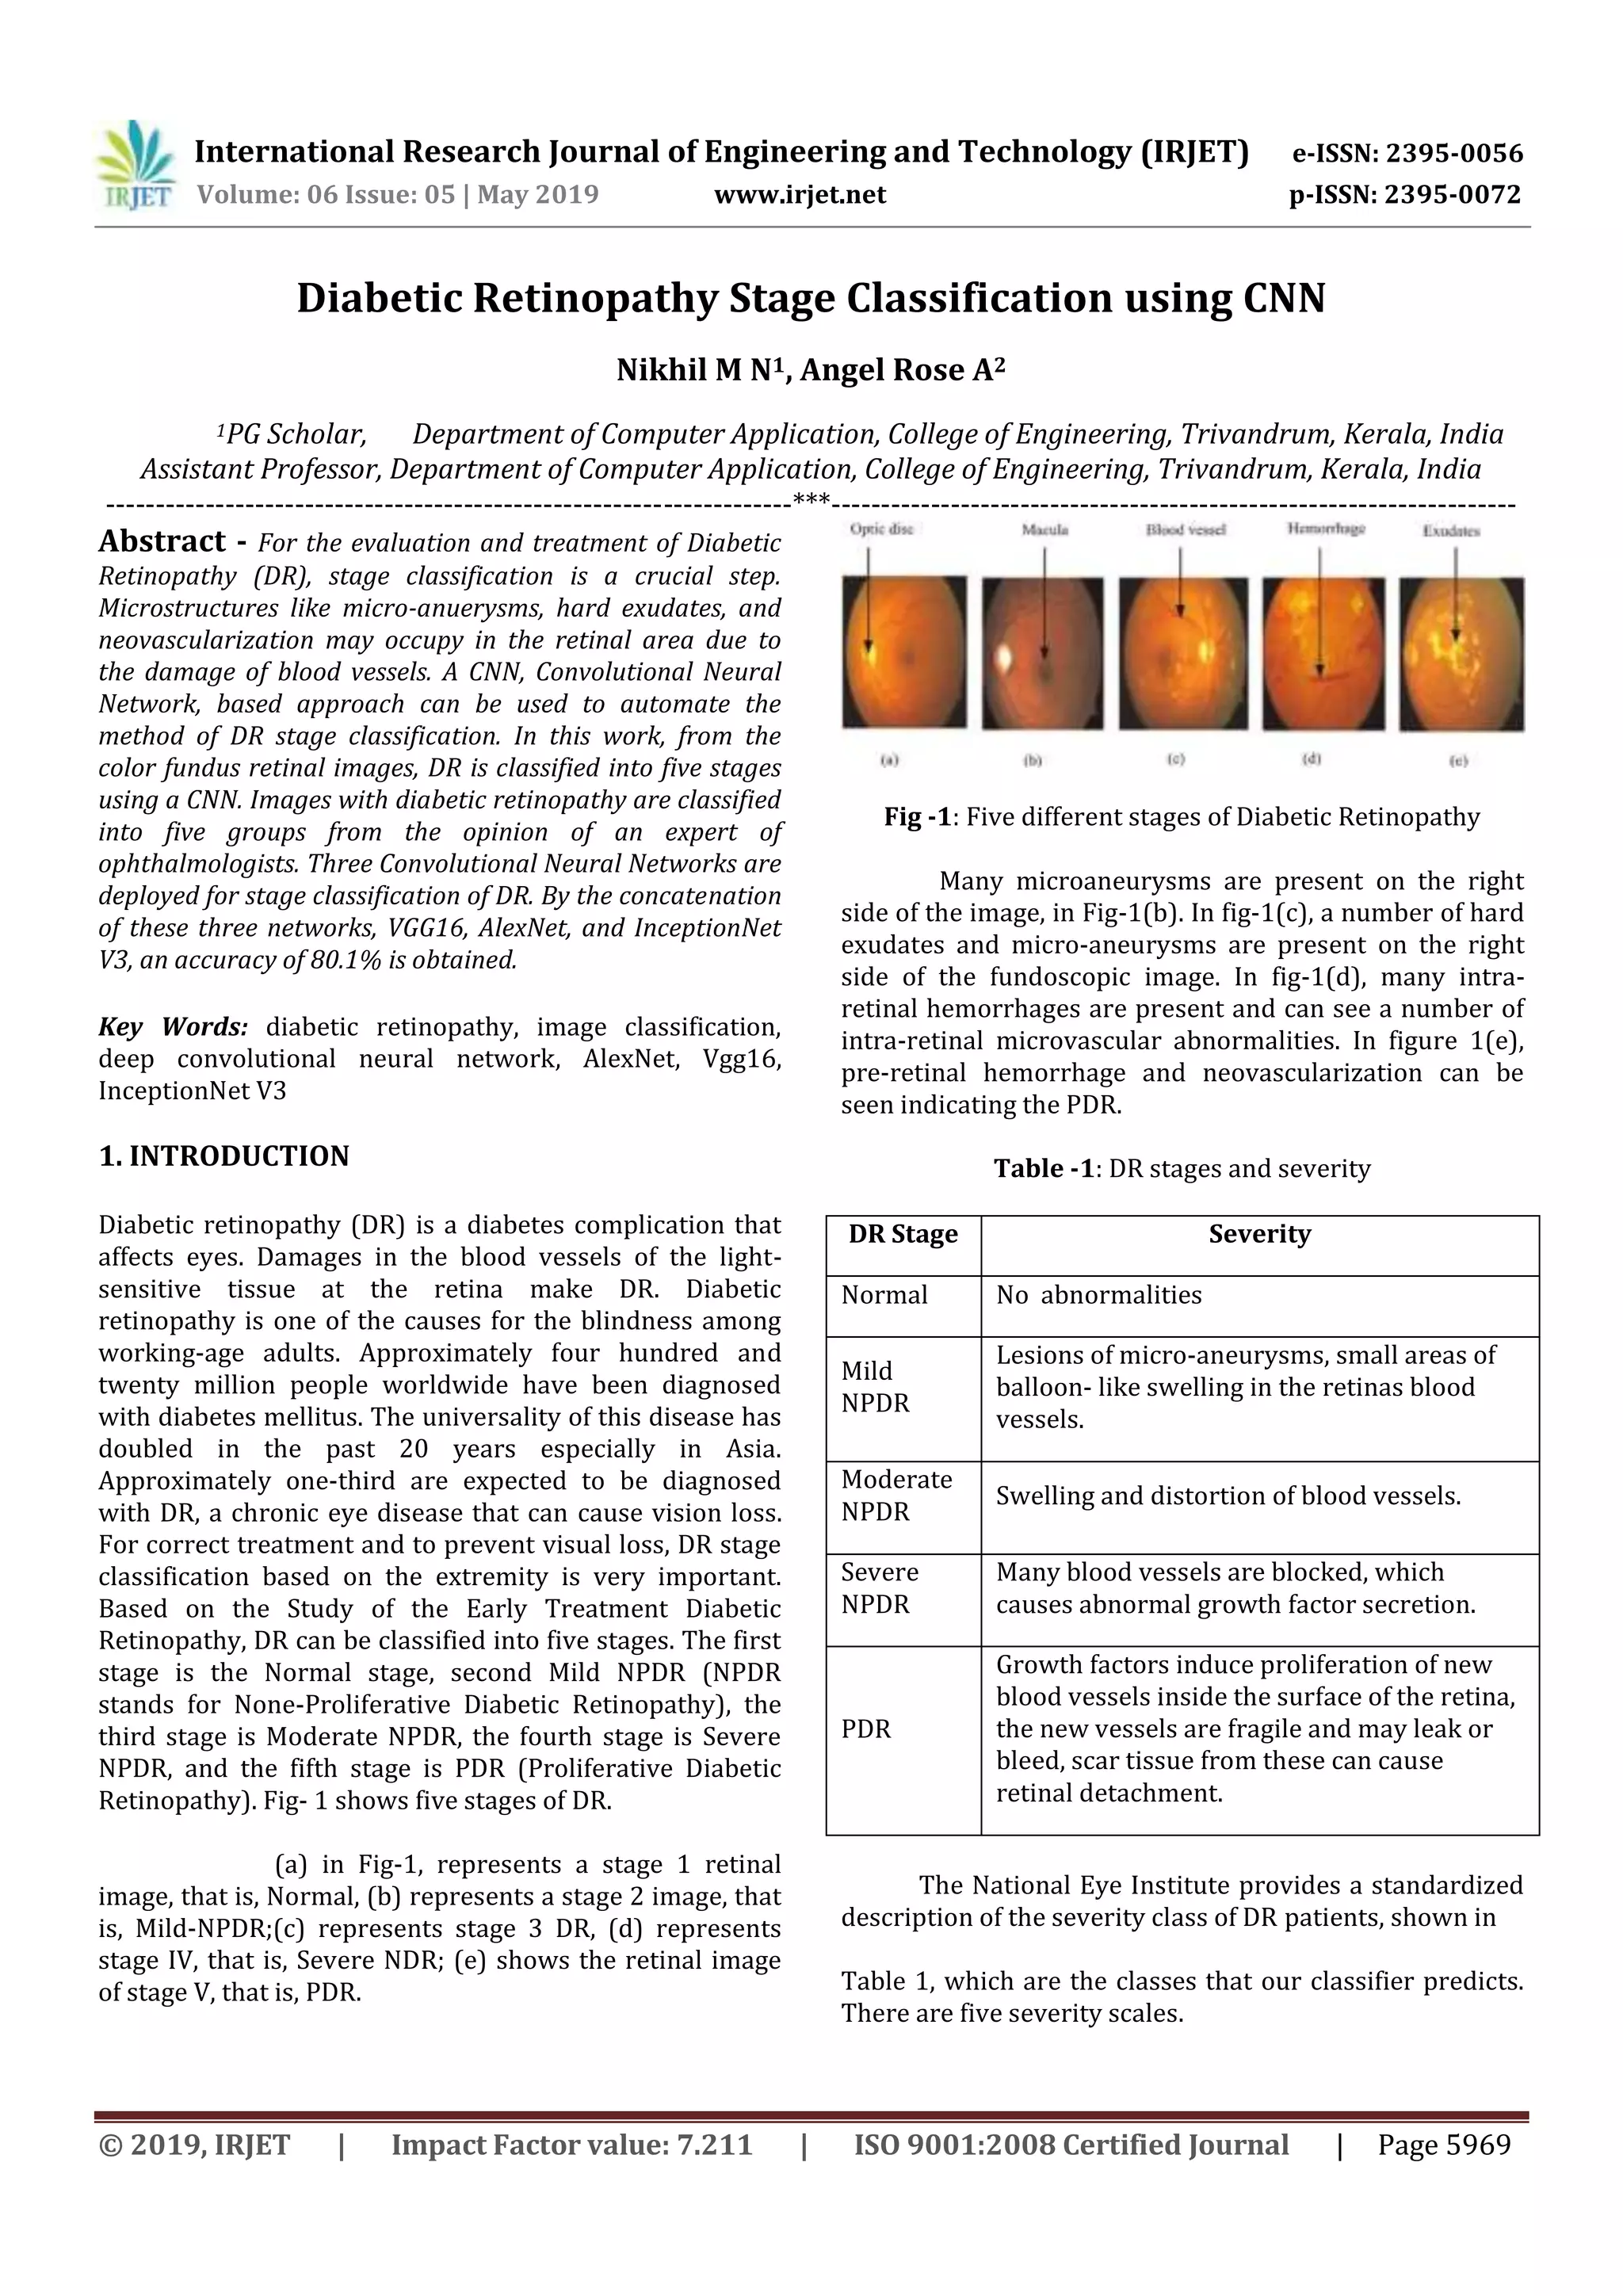
Convolutional Neural Networks (CNN) is an
architecture of Artificial Neural Networks (ANN) mostly
used for image classification. CNN adds some more
operations to regular Neural Networks like convolution,
nonlinearity, and sub-sampling. CNNs mainly has two
parts: the first one is the feature extraction part and the
second one is the classification part. In the first part, a
series of convolution and pooling operations are
performed for feature detection. For producing a feature
map, using a filter, the convolution operation is applied.
This feature map will contain negative pixel values and it
should be replaced with zero. For that, a non-linear
operation is performed after performing every
convolution. Nonlinearity is introduced using Rectified
Linear Unit(ReLU). In the classification part, on top of these
extracted features fully connected layers will act as
classifiers. They assign a probability for the object on the
image. When these images are too large, the pooling
operation continuously reduces the dimensionality. This is
done for reducing the number of computations and
parameters in the network. This reduces training time and
controls overfitting. Spatial pooling also called subsampling
or downsampling which retains the most important
information. Spatial pooling is mainly in three types: Max
pooling, Average pooling, and Sum pooling. The largest
element from the rectified feature map is taken in max
pooling. In sum pooling, the sum of all elements in the
feature map is taken. It is also possible to add as many
convolutional layers. The basic architecture of CNN [16] is
shown in fig-2.
In this paper, we use three CNN architecture, VGG16,
AlexNet, and InceptionNet V3 for the accurate stage
classification of DR. Before going to the configuration setup
of these layers let's see the architecture of this three
networks.](https://image.slidesharecdn.com/irjet-v6i5812-191010085636/75/IRJET-Diabetic-Retinopathy-Stage-Classification-using-CNN-2-2048.jpg)
![International Research Journal of Engineering and Technology (IRJET) e-ISSN: 2395-0056
Volume: 06 Issue: 05 | May 2019 www.irjet.net p-ISSN: 2395-0072
© 2019, IRJET | Impact Factor value: 7.211 | ISO 9001:2008 Certified Journal | Page 5972
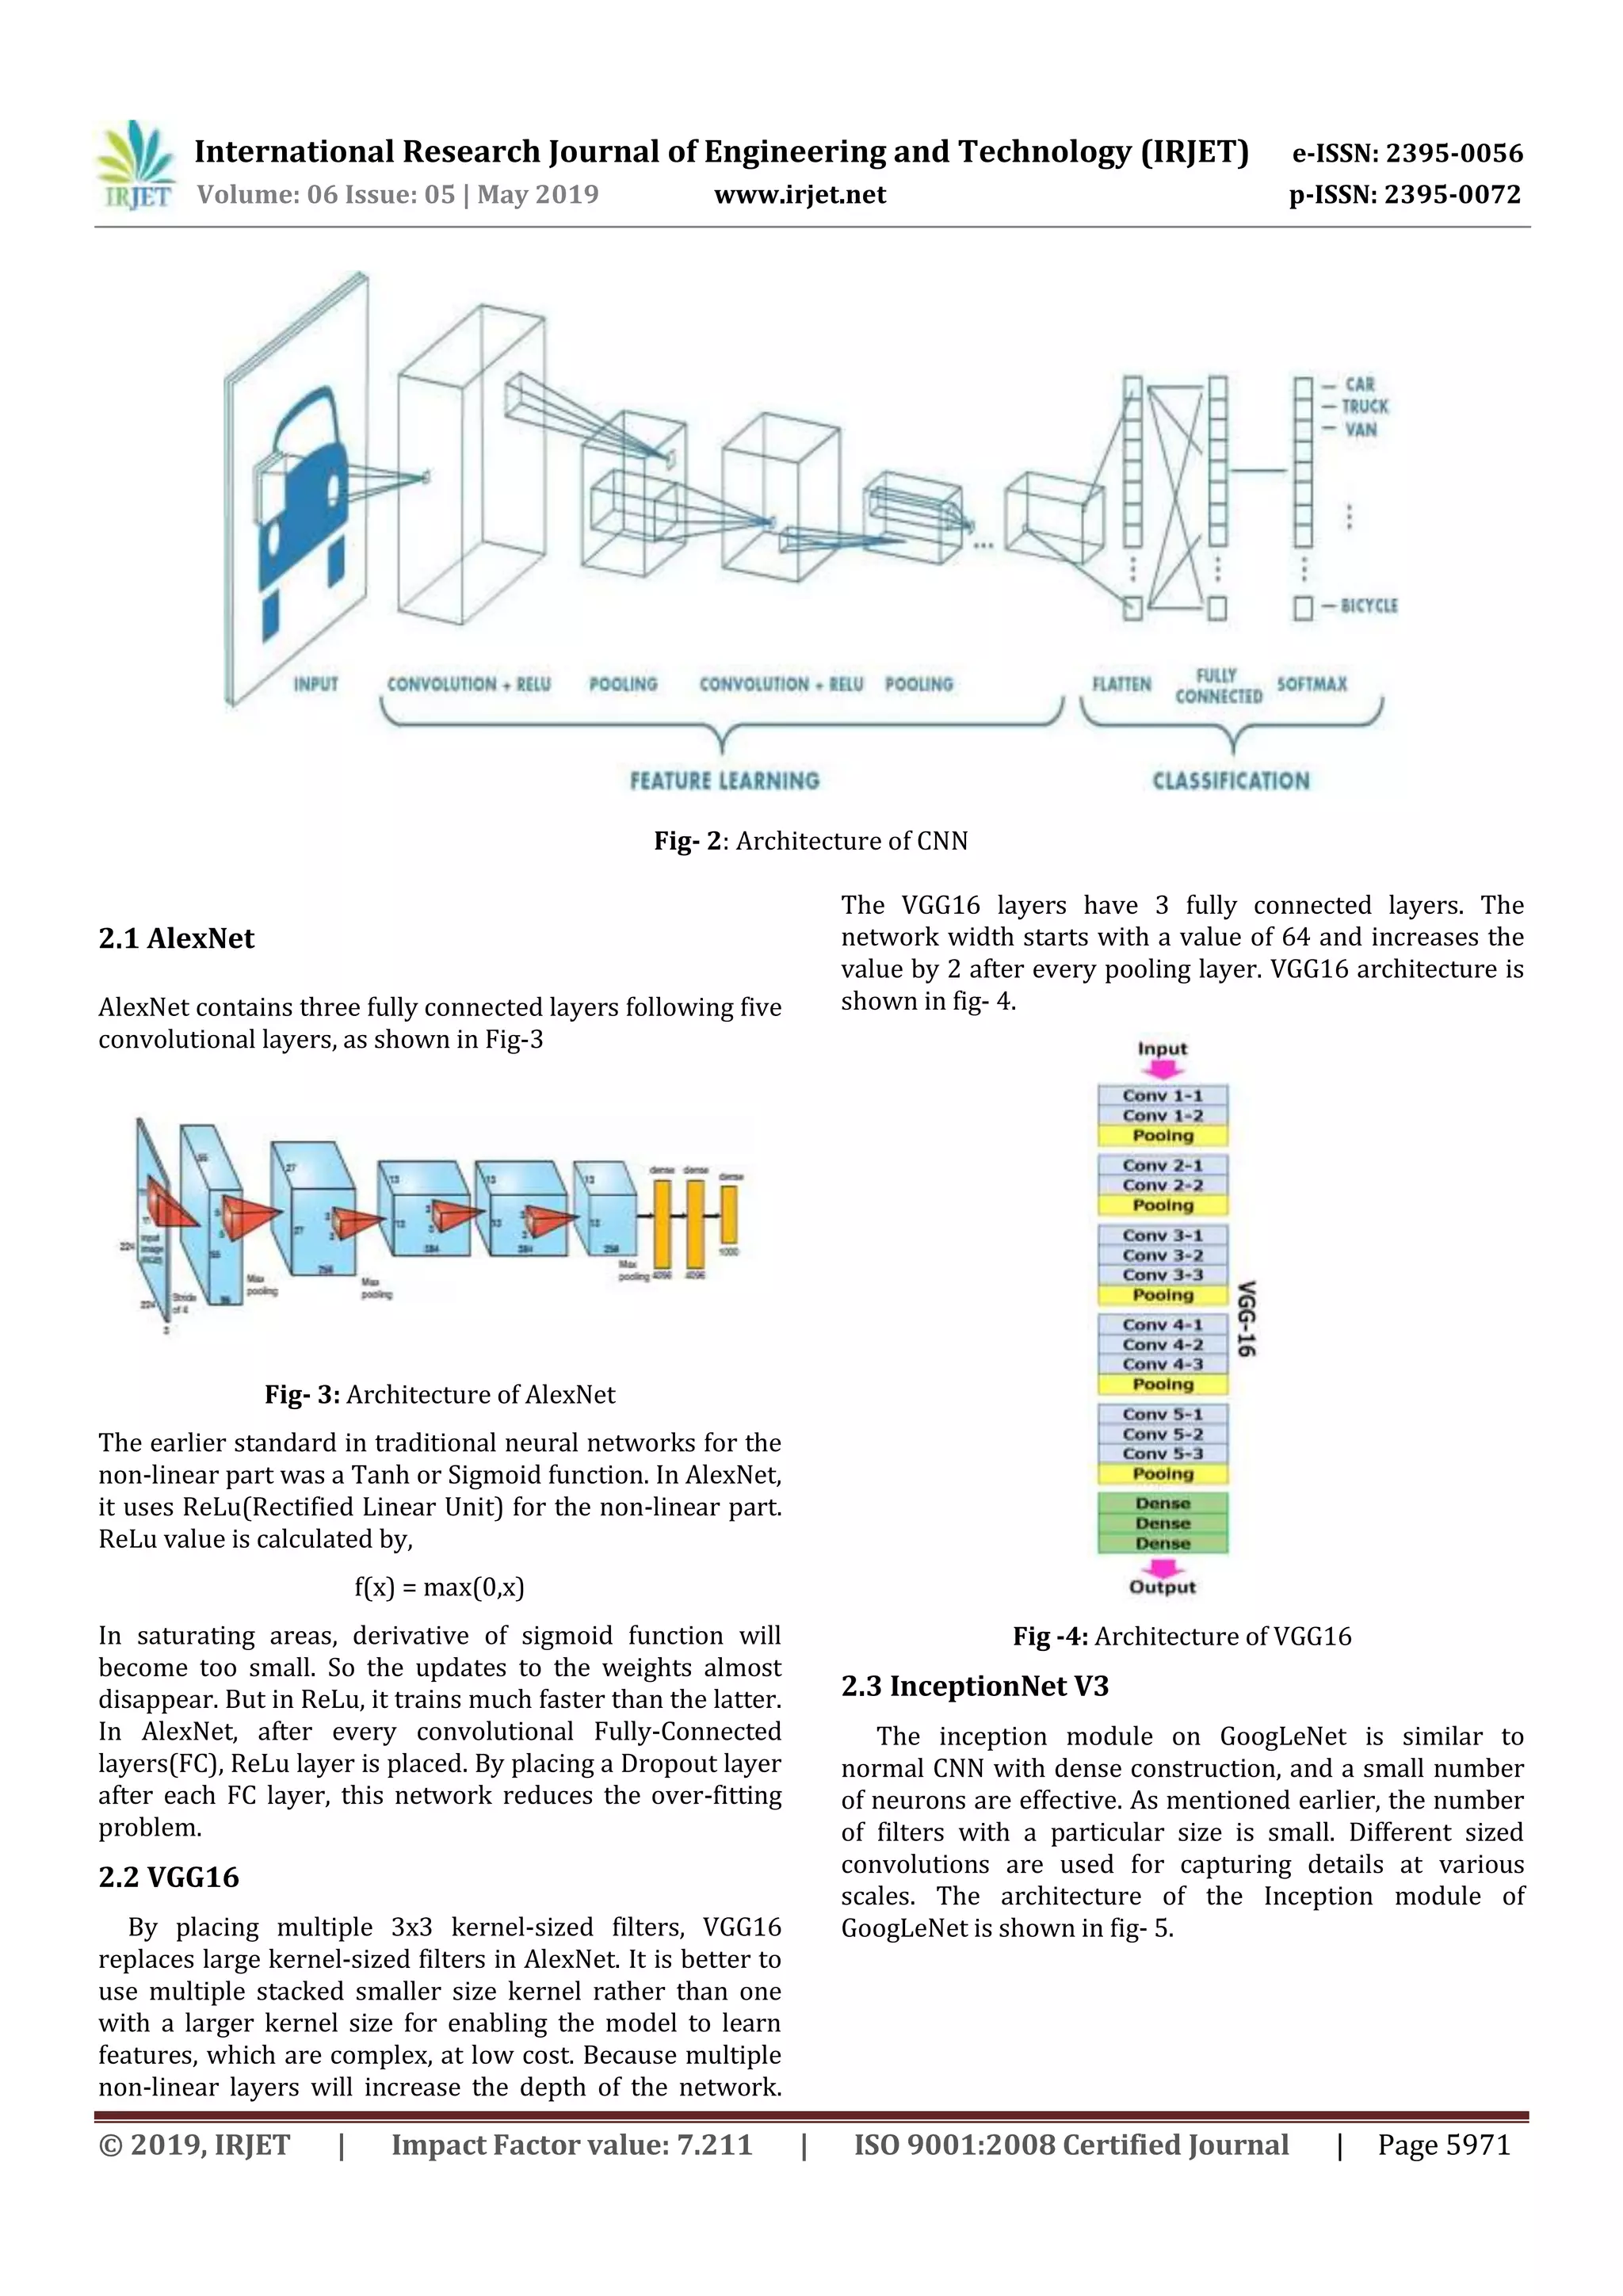
Fig-4: Architecture of InceptionNet V3
3. PROPOSED METHODOLOGY
Pipeline architecture of proposed system is shown in
Figure 6.
Fig -6: Proposed Methodology
3.1 Data Acquisition
Data were drawn from a dataset provided via Kaggle.
The dataset used is highly heterogeneous because the
photographs are from different sources, cameras,
resolutions, and have different degrees of noise and
lighting [7]. These images have resolutions ranged from
2592 x 1944 to 4752 x 3168 pixels. So some preprocessing
steps have proceeded. After these preprocessing, a total of
500 images were selected from dataset of Kaggle. From
these 500 images, 70% of the images are used for training
purpose and remaining is used for testing the system. The
decomposition of these 500 images are in Table 2.
Table-2: Composition of Dataset
3.2 Hyper Parameter Initialization
Before designing the network layers, we initialized the
hyperplane values. We set the momentum value, θ, to 0.9,
initial learning values(α), mini-batch size, learning-rate
decay-schedule, and learning rate factor. The alpha values
are initialized to 0.0001, 0.0001, and 0.001 for AlexNet,
VGG16, and InceptionNet respectively. Learning-rate-
decay schedule was stairwise for both AlexNet and VGG16,
and InceptionNet has an exponential decay schedule. The
learning-rate-decay factor was 0.10 for AlexNet and
VGG16, and for InceptionNet it was 0.16. The learning rate
decay factor was initially 20 for both AlexNet and VGG16
and 32 for InceptionNet.
3.3 Pre- Processing
To achieve high accuracy, we proceeded some
preprocessing steps as follows:
CNN workes in dataset of fundus images and the images
came in varying sizes and aspect ratios. One primary step
involved in preprocessing is resizing the images and
downsizing all images to 256 x 256 images. Before giving
data into the architecture for classification, convert the
images into the green channel image. And then, apply
filters for salt and pepper noise removal. Data are
monochrome images that highlight the
microaneurysms(MA), and vessels in the fundus images.
The microaneurysms(MA) are swelling, in the side of a
blood vessels. MAs are found in the retina of people with
diabetes. MA is an important sign of DR. MA candidates
have the highest contrast in a fundus image. Contrast
adjustment was performed using the histogram
equalization filtering algorithm
3.4 Training Algorithm
For the training of the three state-of-the-art models,
Stochastic Gradient Descent with Momentum (SGDM)
optimization algorithm is used. It accelerates the global
Stage No. of Images
No DR 100
Mild DR 100
Moderate NPDR 100
SNPDR 100
PDR 100](https://image.slidesharecdn.com/irjet-v6i5812-191010085636/75/IRJET-Diabetic-Retinopathy-Stage-Classification-using-CNN-4-2048.jpg)
![International Research Journal of Engineering and Technology (IRJET) e-ISSN: 2395-0056
Volume: 06 Issue: 05 | May 2019 www.irjet.net p-ISSN: 2395-0072
© 2019, IRJET | Impact Factor value: 7.211 | ISO 9001:2008 Certified Journal | Page 5973
minimum of the cost function in right direction and
smoothes out oscillations in volatile directions, for faster
converging[3]. It adds momentum to the classic SGD
algorithm. The parameter θ follows an exponentially
weighted moving. The updated rule for average of the
gradients of the cost function is
Here β is Momentum Parameter, t is the iteration count,
and α is the learning rate. Momentum parameter, β, takes
a value between zero and one, and it approximates the
moving window where the weighted average is calculated.
β = 0.90 is the good and default value.
For the successful training of three CNN networks, we
use fine tuning with respect to the pretrained model from
ImageNet [3]. Fine-tuning procedure is based on the
concept of transfer learning. Here we train a CNN to learn
features for a broad domain with a classification function
that is targeted to minimize error in that particular
domain. After that, we replace the classification function
and optimize the network again to minimize error in
another domain. Here we are transferring the features and
the parameters of a network from broad domain to the
specific one. And ImageNet is a database of images built
upon the backbone of the WordNet structure [3]. For the
effective completion of fine-tuning, the input images to all
the networks were resized.
4. RESULTS AND CONCLUSION
After designing the three networks separately, features
from the three networks are concatenated for better
performance. The system was tested using single images
The trained models of all the networks are loaded for
single image testing. The graph of training the networks
are shown below
To evaluate the performance of our CNN classifier, we
adopted the accuracy measure. The accuracy was
calculated using the following equation,
Accuracy = Number of accurate Prediction / Total number
of Predictions
The accuracy obtained by individual networks and the
accuracy after feature concatenations are shown in Table
3.
Table – 3: Results
ACKNOWLEDGEMENT
We are gratified to the Department of Computer
Application, College of Engineering, Trivandrum and each
& everyone who helped us in carrying out this research
work.
REFERENCES
[1] Xiaoliang Wang ; Yongjin Lu ; Yujuan Wang ; Wei-Bang
Chen,”Diabetic Retinopathy Stage Classification Using
Convolutional Neural Networks”, 2018 IEEE
International Conference on Information Reuse and
Integration (IRI),Year: 2018M. Young, The Technical
Writer’s Handbook. Mill Valley, CA: University Science,
1989.
[2] M. Alban and T. Gilligan, “Automated detection of
diabetic retinopathy using fluorescein angiography
photographs,” Stanford Technical Report, 2016.
[3] Ning Qian,” On the momentum term in gradient
descent learning algorithms”, Center for Neurobiology
and Behavior, Columbia University, 722 W. 168th
Street, New York, NY 10032, USA.
[4] Ömer Deperlioğlu ; Utku Köse,”Diagnosis of Diabetic
Retinopathy Using Image Processing and
Convolutional Neural Network”, 2018 Medical
Technologies National Congress (TIPTEKNO) Year:
2018.
[5] Shorav Suriyal ; Christopher Druzgalski ; Kumar
Gautam, “Mobile assisted diabetic retinopathy
detection using deep neural network”, 2018 Global
Medical Engineering Physics Exchanges/Pan
American Health Care Exchanges (GMEPE/PAHCE)
Year: 2018
[6] J. Deng, W. Dong, R. Socher, L. J. Li, K. Li, and L. Fei-Fei,
“ImageNet: A large-scale hierarchical image database,”
in Proceedings of the IEEE Conference on Computer
Vision and Pattern Recognition (CVPR 2009), IEEE,
Jun. 2009, pp. 248-255.
[7] Diabetic retinopathy detection: identify signs of
diabetic retinopathy in eye images,
https://www.kaggle.com/c/diabetic-retinopathy-dete
ction
Training Algorithm Accuracy
AlexNet 46.2%
VGG16 52.2%
InceptionNet V3 65.23%
After feature concatenation 80.1%](https://image.slidesharecdn.com/irjet-v6i5812-191010085636/75/IRJET-Diabetic-Retinopathy-Stage-Classification-using-CNN-5-2048.jpg)
![International Research Journal of Engineering and Technology (IRJET) e-ISSN: 2395-0056
Volume: 06 Issue: 05 | May 2019 www.irjet.net p-ISSN: 2395-0072
© 2019, IRJET | Impact Factor value: 7.211 | ISO 9001:2008 Certified Journal | Page 5974
[8] V. Gulshan, L. Peng, M. Coram, M. C. Stumpe, D. Wu, A.
Narayanaswamy, S. Venugopalan, K. Widner, T.
Madams, J. Cuadros, R. Kim, R. Raman, P. C. Nelson, J. L.
Mega, and D. R. Webster, “Development and validation
of a deep learning algorithm for detection of diabetic
retinopathy in retinal fundus photographs,” The
Journal of the American Medical Association, vol. 316,
issue 22, Dec. 2016,pp.2402-2410.](https://image.slidesharecdn.com/irjet-v6i5812-191010085636/75/IRJET-Diabetic-Retinopathy-Stage-Classification-using-CNN-6-2048.jpg)

This document describes a study that used convolutional neural networks (CNNs) to classify diabetic retinopathy (DR) into five stages of severity based on color fundus retinal images. Three CNN models (VGG16, AlexNet, and InceptionNet V3) were trained individually on a dataset of 500 retinal images. The models achieved accuracies of 63.23%, 73.3%, and 80.1% respectively when used alone. The study found that concatenating the features from all three CNNs resulted in the highest classification accuracy of 80.1%. The CNN approach can help automate DR stage classification, which is important for evaluating and treating the disease.


