Downloaded 20 times


![What is Google Analytics?
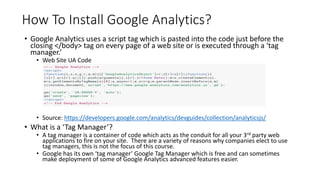
• GA is a software as a service application (SaaS) that is connected to
your website through a piece of tracking code.
• Google Analytics comes in ‘Freeware’ i.e. no cost and Google 360,
their premium product.
• Google Analytics ‘Freeware’ limits are 10 million hits a month.
• Its a small piece of JavaScript [JS] code that is made within your
analytics account.
• The account holder generates this code and then places it into the
HTML back end of their site.](https://image.slidesharecdn.com/introga7142017-170714222040/85/Introduction-to-Google-Analytics-7-320.jpg)


![Resources:
• Sign up for Free GA Demo Account:
• https://support.google.com/analytics/answer/6367342?hl=en
• GA Free eLearning:
https://analytics.google.com/analytics/academy/
• The Google Analytics Individual Qualification Exam [GAIQ] Certification
• https://support.google.com/partners/answer/6089738?hl=en
• Its FREE,
• 70 Questions.
• 90 Minutes to take test.
• 80% Passing grade.
• Additional Test Preparation Resources:
• http://www.googleanalyticstest.com/ - Free
• iPassexam.com](https://image.slidesharecdn.com/introga7142017-170714222040/85/Introduction-to-Google-Analytics-76-320.jpg)

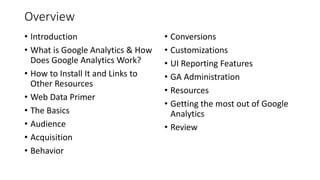
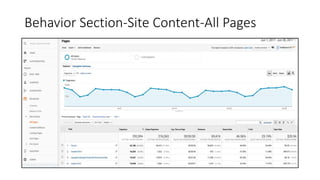
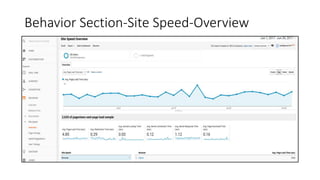
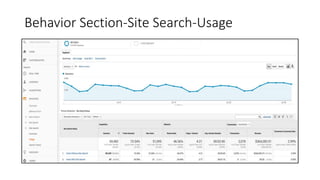
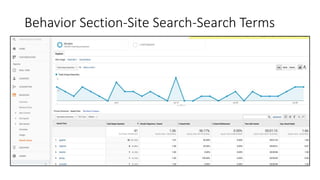
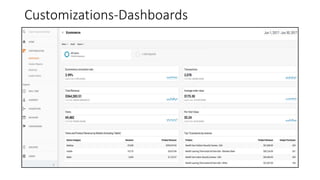
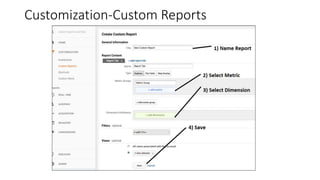
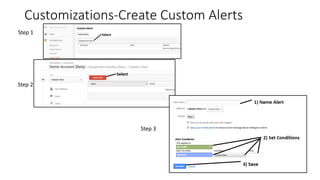
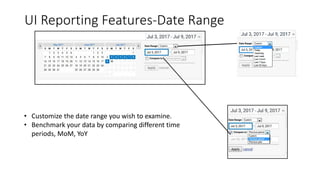
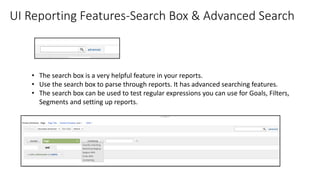
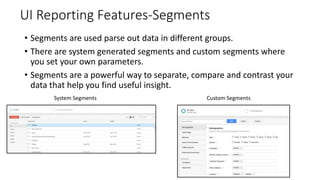
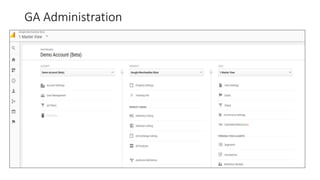
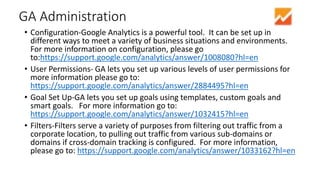
This document provides an introduction and overview of Google Analytics. It begins with introductions from the presenter and explains why learning Google Analytics is important. The rest of the document dives into key topics such as how Google Analytics works, how to install it, the different types of web data and traffic sources it can track, and how to navigate and customize the various reports and features within Google Analytics. Resources for further learning about Google Analytics and obtaining certification are also provided.


