Downloaded 14 times


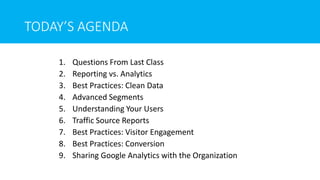


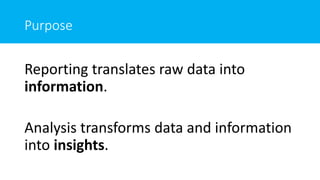


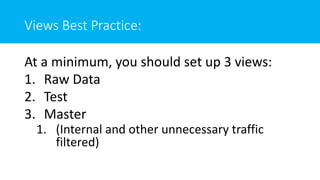

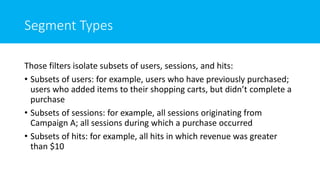

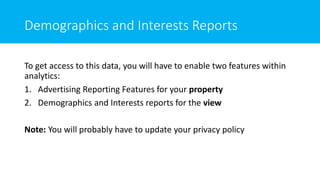

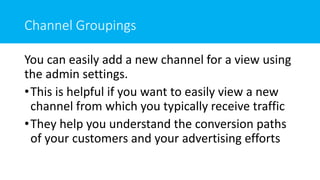


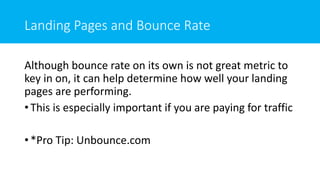


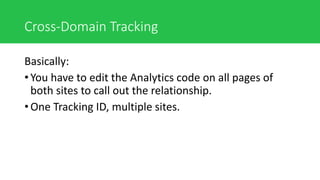
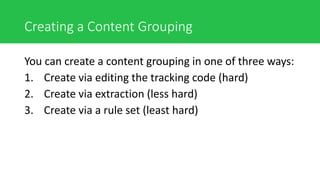
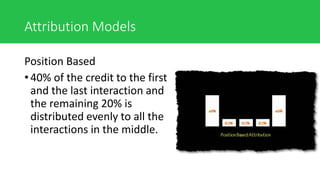
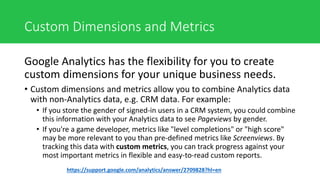
![Cross-Domain Tracking Set Up
Site 1:
• Make the following changes to the snippet (the
changes you need to make are in bold red text):
ga('create', 'UA-XXXXXXX-Y', 'auto', {'allowLinker': true});
ga('require', 'linker');
ga('linker:autoLink', ['example-2.com'] );](https://image.slidesharecdn.com/googleanalyticsfull-210819185248/85/Google-Analytics-Training-full-2017-109-320.jpg)
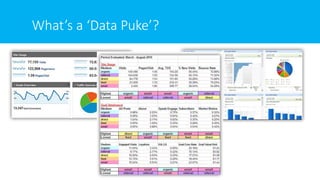
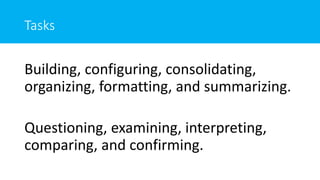
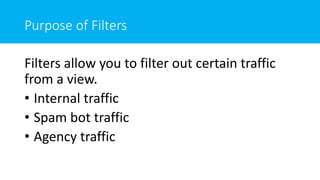
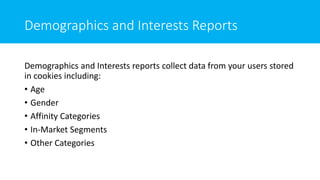
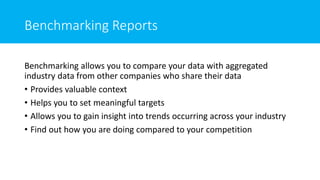
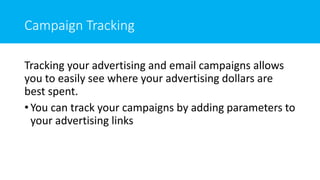
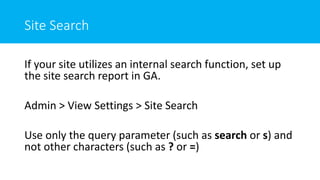
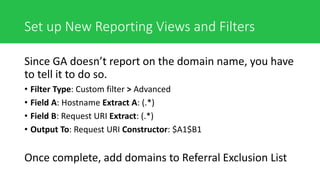
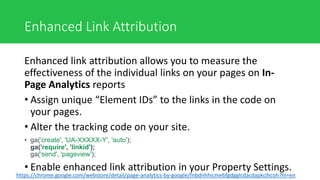
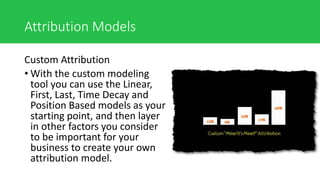
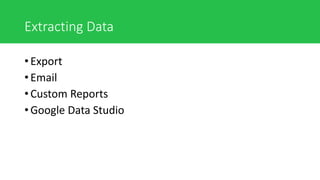
![Cross-Domain Tracking Set Up
Site 2:
• Make the following changes to the snippet (the
changes you need to make are in bold red text):
ga('create', 'UA-XXXXXXX-Y', 'auto', {'allowLinker': true});
ga('require', 'linker');
ga('linker:autoLink', ['example-1.com'] );](https://image.slidesharecdn.com/googleanalyticsfull-210819185248/85/Google-Analytics-Training-full-2017-110-320.jpg)


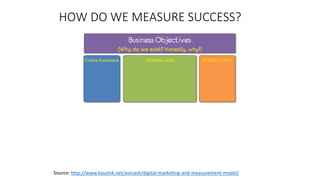
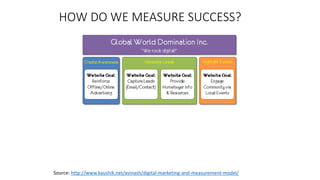
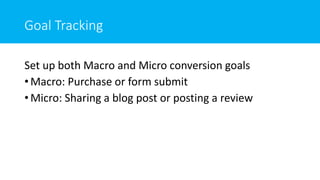
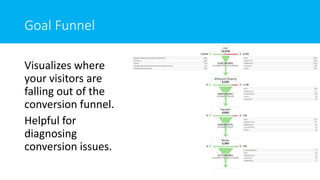
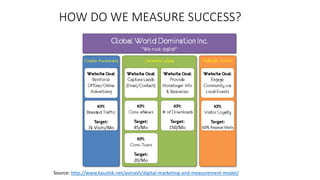
This document provides an agenda for a Google Analytics training session. The agenda includes topics such as getting started with Google Analytics, navigating the interface, audience, acquisition, behavior, and conversion reports. It also covers account administration, advanced tracking implementations, measuring content, importing and extracting data, and common applications of Google Analytics. The training emphasizes using Google Analytics for analysis rather than just reporting, and how to tell data-driven stories to different audiences. It provides best practices for setting up views and segments, understanding users, tracking campaigns and visitor engagement, and setting up conversion goals.


