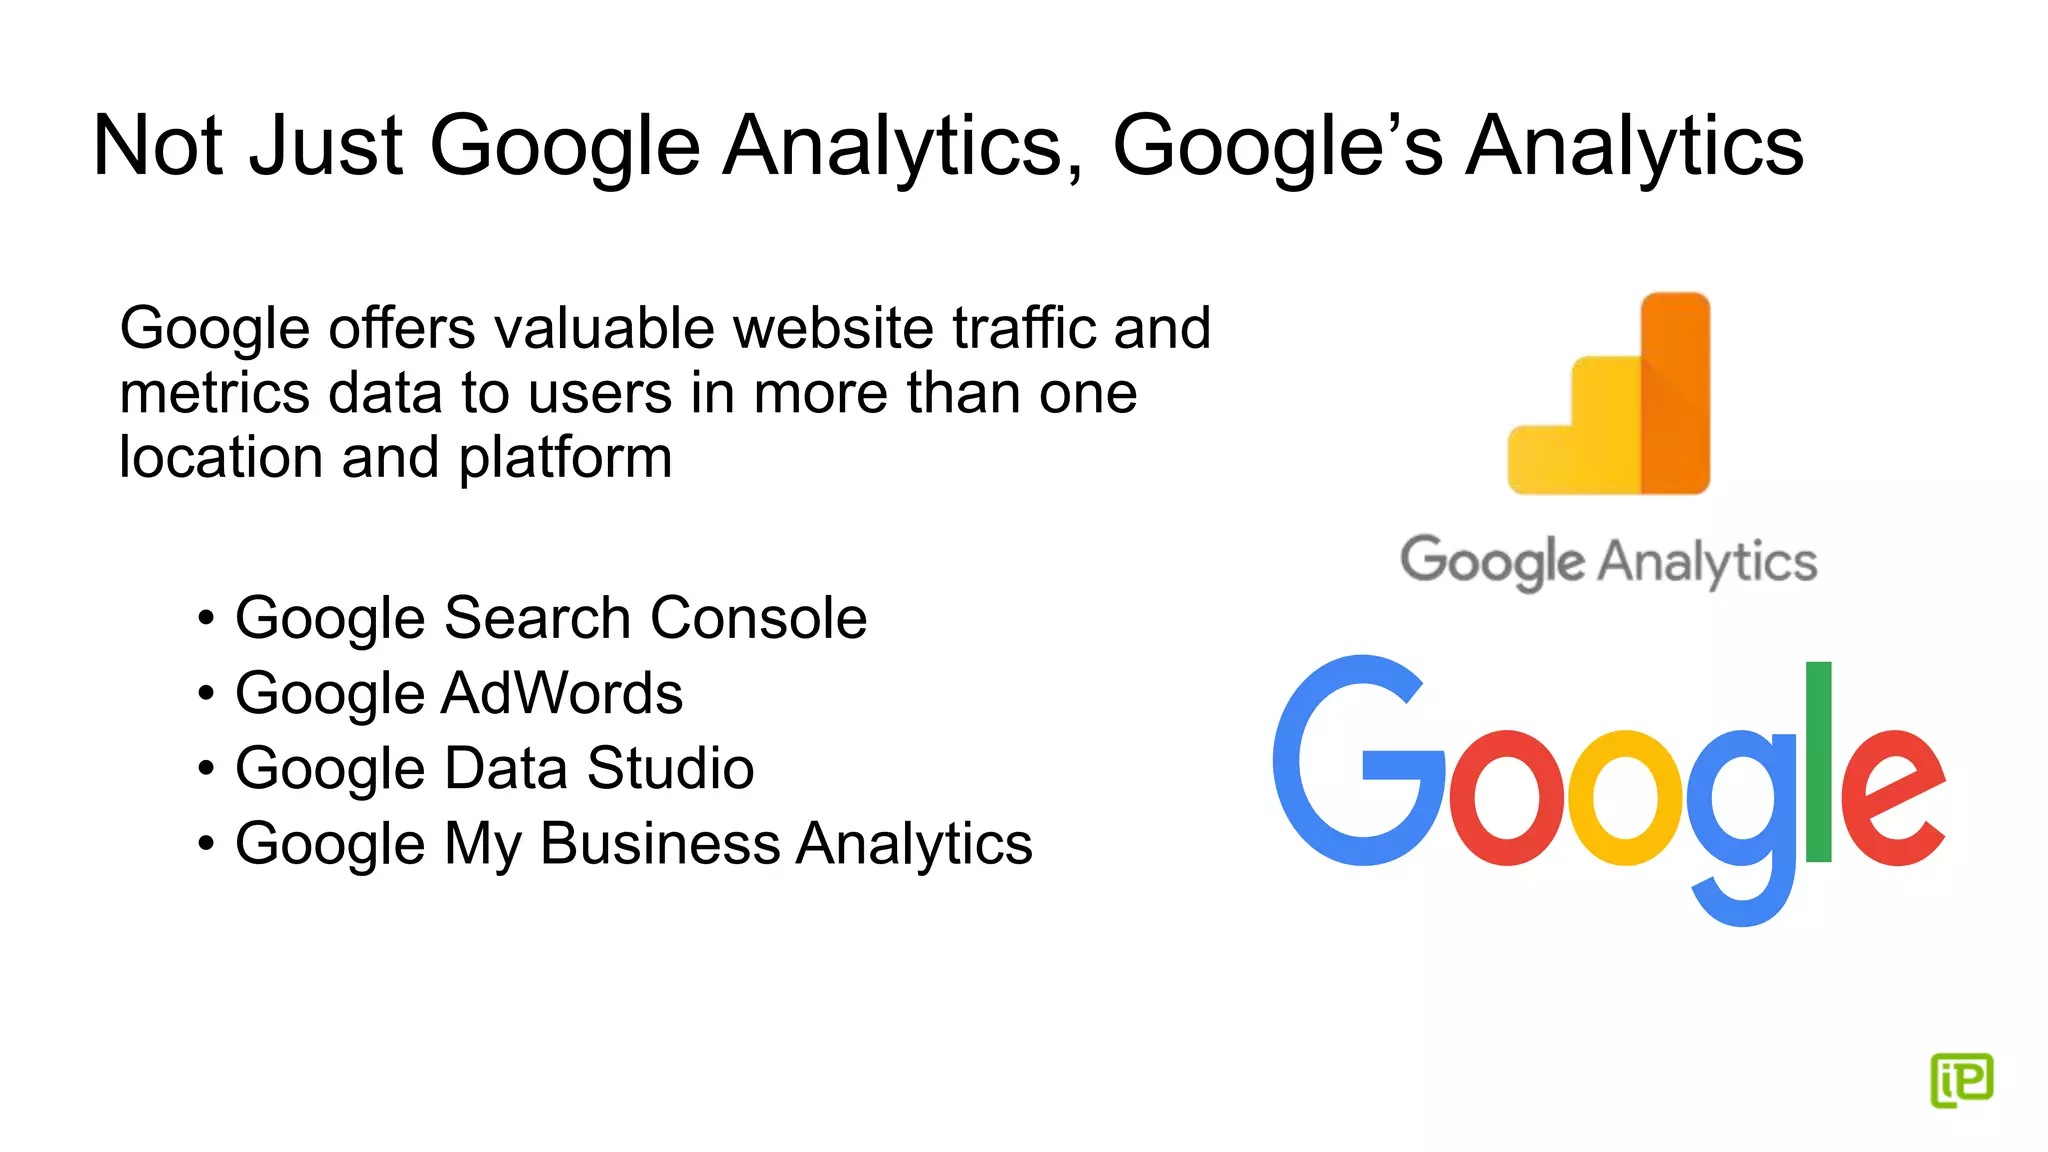
Google Analytics 101
Social Media Association of Michigan #SMAMI
Nicole Bullock
Senior SEO Associate,
iProspect
About Nicole Bullock
• Senior SEO Associate at iProspect, GM
• 7 years as a full-time digital marketing professional
• Experienced SEO and social media speaker at local,
national, and international conferences, seminars,
and events
• Featured in stories for newspaper, blogs, television,
podcasts, and NPR
• Former blogger who learned SEO to make her blog
more successful, and then decided that SEO was
more fun and profitable than blogging
The Good News and the Bad News
Good: You will learn the basics and terminology used in
Google Analytics to utilize the existing online resources to
increase your working knowledge of the platform
Bad: You will not be leaving this event today being a
certified Google Analytics Master
Not Just Google Analytics, Google’s Analytics
Google offers valuable website traffic and
metrics data to users in more than one
location and platform
• Google Search Console
• Google AdWords
• Google Data Studio
• Google My Business Analytics
Basic Background Knowledge
for Google Analytics
What is Google Analytics?
Google Analytics (GA) is a service which collects data about digital
interactions on all device types and provides an interface for authorized
users to review data, dimensions, and metrics
For GA to function correctly, every page on the website must include a
snippet of code containing a unique GA ID (UA-XXXXXX-X).
• The code collects anonymous information about your site's visitors
and their behavior, including their location and browser, their path
through your website, and how they interact with specific pages. This
information can then be accessed and analyzed by you on the
Google Analytics website.
Dimensions vs Metrics
Dimensions describe data.
Think of them as the 'what':
what keyword did the visitor
use, what browser are they
using, what city are they from.
Metrics measure data. Think
of them as answering 'how
many' or 'how long': how
many pages did they view,
how long was the site visit
duration
In this data table, dimension is marked in blue,
and the associated metrics are in pink.
Account Structure: Account/Property/View
Account – highest level entity
(your business)
Property – a specific website or
mobile app. Identified for unique
ID number (UA-xxxxxxx)
View – access point for data
review, customized for data to be
filtered or processed in a certain
way
Permissions and User Rights
Permissions and access rights can be granted at account,
property, or view level. They are set and managed using Google
Accounts (the same credentials you use to access Gmail).
Four permission levels are available:
• Manage Users: Add or delete users and assign permissions.
• Edit: Add, modify, or delete accounts, properties, and views.
• Collaborate: Create and share personal assets, dashboards,
annotations.
• Read & Analyze: Can access, pivot, and manipulate data.
Sessions vs Pageviews
A session is a series of interactions by a user on your website. One session
can include multiple pageviews, events, and ecommerce transactions. There
are two main ways a session can end:
• Time-based expiration: At midnight, or after 30 minutes of inactivity.
• Campaign change: User arrives via one campaign, leaves, and then
comes back via a different campaign.
• Hierarchy Navigation
• Report Navigation
• Date Picker
• ReportTabs
• Graph Display
• DataTable
• Account Settings and
Notifications
The
Reporting
Interface
Getting Around in GA
• Accounts, Settings, and Notifications - Your personal Google account,
links to other analytics apps like Google Tag Manager, and notifications about
the current property.
• Hierarchy Navigation - Allows you to easily switch between accounts,
properties and views.
• Report Navigation - Your primary means of navigating to a particular set of
data in GA. The five main reporting groups are:
o Real-Time (live data)
o Audience (including geography, technology, demographics)
o Acquisition (traffic sources, social, AdWords)
o Behavior (landing pages, content performance, events)
o Conversions (goals, ecommerce, attribution)
Refine and Display your Metrics
• Date Picker - This appears at the top of every Analytics report, and allows
you to change the date range reflected in the report. You can also use the
Date Picker to compare two date ranges.
• Report Tabs - Allow you to switch between multiple versions of the same
data. Most reports include an Explorer tab, which presents your data in
both visual (charted) and tabularized forms. These determine which
metrics are displayed in the data table.
• Graph Display - While these areas of the interface will vary depending on
which report you're viewing, most Explorer tabs will include a graphical
view of your data.
• Data Table - Your data in tabularized form, plus controls for searching
and pivoting. You can change the sort order, apply visualizations,
change/add dimensions, and execute advanced searches.
The Rest of the Data You Can
Get From Google – for Free
The Search Data Reporting Timeline
Where the magic happens before and after clickthrough
Google Search Console
Search Analytics Report:
• Clicks and impressions data on actual keywords used
• Average keyword ranking position
• Click-through rate
• Secure keyword info that is “Not Provided” in Google Analytics
Tools and Information in Search Console:
• Site errors
• Data highlighter
• “Fetch as Google”
• Structured data testing tool
Google Data Studio
Google’s latest data and analytics
visualization offering
• Easily connect to a variety of data
sources, including Google Analytics and
Search Console
• Visualize your data through attractive,
dynamic, and interactive reports and
dashboards.
• Ability to create branded reports for clients
• Share and collaborate with others, just as
you can in Google Drive.
Google My Business Insights
Google My Business Insights gives you a
detailed look at how people find your business
listing on the web.
Because many customers find businesses on
Google Search and Maps, Insights focus
on how customers use Search and Maps to find
your listing, and what they do once they find it.
Google My Business dashboard can be linked to
Google Analytics and Google Adwords for more
comprehensive business data and insights.
Tools and Resources
Google Analytics Academy – Comprehensive
training leading to certification
Google Analytics Help Center – Official GA
support hub
Google Tag Assistant – A Chrome extension
which is now the single most useful tool for
debugging Google Analytics & Google Tag
Manager
Google Data Studio Tutorial – How to bring
together a visualization of data from Google
Analytics and Search Console
Questions? Concerns? Let’s Connect!
Nicole Bullock
@cuteculturechic
@cuteculturechick
linkedin.com/in/nicolembullock Nicole.Bullock@iProspect.com
www.cuteculturechick.com

Google Analytics 101 #SMAMI 2017

  • 1.
    Google Analytics 101 SocialMedia Association of Michigan #SMAMI Nicole Bullock Senior SEO Associate, iProspect
  • 2.
    About Nicole Bullock •Senior SEO Associate at iProspect, GM • 7 years as a full-time digital marketing professional • Experienced SEO and social media speaker at local, national, and international conferences, seminars, and events • Featured in stories for newspaper, blogs, television, podcasts, and NPR • Former blogger who learned SEO to make her blog more successful, and then decided that SEO was more fun and profitable than blogging
  • 3.
    The Good Newsand the Bad News Good: You will learn the basics and terminology used in Google Analytics to utilize the existing online resources to increase your working knowledge of the platform Bad: You will not be leaving this event today being a certified Google Analytics Master
  • 4.
    Not Just GoogleAnalytics, Google’s Analytics Google offers valuable website traffic and metrics data to users in more than one location and platform • Google Search Console • Google AdWords • Google Data Studio • Google My Business Analytics
  • 5.
  • 6.
    What is GoogleAnalytics? Google Analytics (GA) is a service which collects data about digital interactions on all device types and provides an interface for authorized users to review data, dimensions, and metrics For GA to function correctly, every page on the website must include a snippet of code containing a unique GA ID (UA-XXXXXX-X). • The code collects anonymous information about your site's visitors and their behavior, including their location and browser, their path through your website, and how they interact with specific pages. This information can then be accessed and analyzed by you on the Google Analytics website.
  • 7.
    Dimensions vs Metrics Dimensionsdescribe data. Think of them as the 'what': what keyword did the visitor use, what browser are they using, what city are they from. Metrics measure data. Think of them as answering 'how many' or 'how long': how many pages did they view, how long was the site visit duration In this data table, dimension is marked in blue, and the associated metrics are in pink.
  • 8.
    Account Structure: Account/Property/View Account– highest level entity (your business) Property – a specific website or mobile app. Identified for unique ID number (UA-xxxxxxx) View – access point for data review, customized for data to be filtered or processed in a certain way
  • 9.
    Permissions and UserRights Permissions and access rights can be granted at account, property, or view level. They are set and managed using Google Accounts (the same credentials you use to access Gmail). Four permission levels are available: • Manage Users: Add or delete users and assign permissions. • Edit: Add, modify, or delete accounts, properties, and views. • Collaborate: Create and share personal assets, dashboards, annotations. • Read & Analyze: Can access, pivot, and manipulate data.
  • 10.
    Sessions vs Pageviews Asession is a series of interactions by a user on your website. One session can include multiple pageviews, events, and ecommerce transactions. There are two main ways a session can end: • Time-based expiration: At midnight, or after 30 minutes of inactivity. • Campaign change: User arrives via one campaign, leaves, and then comes back via a different campaign.
  • 11.
    • Hierarchy Navigation •Report Navigation • Date Picker • ReportTabs • Graph Display • DataTable • Account Settings and Notifications The Reporting Interface
  • 12.
    Getting Around inGA • Accounts, Settings, and Notifications - Your personal Google account, links to other analytics apps like Google Tag Manager, and notifications about the current property. • Hierarchy Navigation - Allows you to easily switch between accounts, properties and views. • Report Navigation - Your primary means of navigating to a particular set of data in GA. The five main reporting groups are: o Real-Time (live data) o Audience (including geography, technology, demographics) o Acquisition (traffic sources, social, AdWords) o Behavior (landing pages, content performance, events) o Conversions (goals, ecommerce, attribution)
  • 13.
    Refine and Displayyour Metrics • Date Picker - This appears at the top of every Analytics report, and allows you to change the date range reflected in the report. You can also use the Date Picker to compare two date ranges. • Report Tabs - Allow you to switch between multiple versions of the same data. Most reports include an Explorer tab, which presents your data in both visual (charted) and tabularized forms. These determine which metrics are displayed in the data table. • Graph Display - While these areas of the interface will vary depending on which report you're viewing, most Explorer tabs will include a graphical view of your data. • Data Table - Your data in tabularized form, plus controls for searching and pivoting. You can change the sort order, apply visualizations, change/add dimensions, and execute advanced searches.
  • 14.
    The Rest ofthe Data You Can Get From Google – for Free
  • 15.
    The Search DataReporting Timeline Where the magic happens before and after clickthrough
  • 16.
    Google Search Console SearchAnalytics Report: • Clicks and impressions data on actual keywords used • Average keyword ranking position • Click-through rate • Secure keyword info that is “Not Provided” in Google Analytics Tools and Information in Search Console: • Site errors • Data highlighter • “Fetch as Google” • Structured data testing tool
  • 17.
    Google Data Studio Google’slatest data and analytics visualization offering • Easily connect to a variety of data sources, including Google Analytics and Search Console • Visualize your data through attractive, dynamic, and interactive reports and dashboards. • Ability to create branded reports for clients • Share and collaborate with others, just as you can in Google Drive.
  • 18.
    Google My BusinessInsights Google My Business Insights gives you a detailed look at how people find your business listing on the web. Because many customers find businesses on Google Search and Maps, Insights focus on how customers use Search and Maps to find your listing, and what they do once they find it. Google My Business dashboard can be linked to Google Analytics and Google Adwords for more comprehensive business data and insights.
  • 19.
    Tools and Resources GoogleAnalytics Academy – Comprehensive training leading to certification Google Analytics Help Center – Official GA support hub Google Tag Assistant – A Chrome extension which is now the single most useful tool for debugging Google Analytics & Google Tag Manager Google Data Studio Tutorial – How to bring together a visualization of data from Google Analytics and Search Console
  • 20.
    Questions? Concerns? Let’sConnect! Nicole Bullock @cuteculturechic @cuteculturechick linkedin.com/in/nicolembullock Nicole.Bullock@iProspect.com www.cuteculturechick.com