
More Related Content
What's hot
What's hot (20)
Similar to Google analytics
Similar to Google analytics (20)
Recently uploaded
Recently uploaded (20)
Google analytics
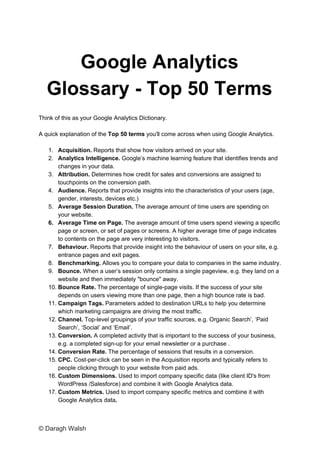
- 1. Google Analytics Glossary - Top 50 Terms Think of this as your Google Analytics Dictionary. A quick explanation of the Top 50 terms you'll come across when using Google Analytics. 1. Acquisition. Reports that show how visitors arrived on your site. 2. Analytics Intelligence. Google’s machine learning feature that identifies trends and changes in your data. 3. Attribution. Determines how credit for sales and conversions are assigned to touchpoints on the conversion path. 4. Audience. Reports that provide insights into the characteristics of your users (age, gender, interests, devices etc.) 5. Average Session Duration. The average amount of time users are spending on your website. 6. Average Time on Page. The average amount of time users spend viewing a specific page or screen, or set of pages or screens. A higher average time of page indicates to contents on the page are very interesting to visitors. 7. Behaviour. Reports that provide insight into the behaviour of users on your site, e.g. entrance pages and exit pages. 8. Benchmarking. Allows you to compare your data to companies in the same industry. 9. Bounce. When a user’s session only contains a single pageview, e.g. they land on a website and then immediately "bounce" away. 10. Bounce Rate. The percentage of single-page visits. If the success of your site depends on users viewing more than one page, then a high bounce rate is bad. 11. Campaign Tags. Parameters added to destination URLs to help you determine which marketing campaigns are driving the most traffic. 12. Channel. Top-level groupings of your traffic sources, e.g. Organic Search’, ‘Paid Search’, ‘Social’ and ‘Email’. 13. Conversion. A completed activity that is important to the success of your business, e.g. a completed sign-up for your email newsletter or a purchase . 14. Conversion Rate. The percentage of sessions that results in a conversion. 15. CPC. Cost-per-click can be seen in the Acquisition reports and typically refers to people clicking through to your website from paid ads. 16. Custom Dimensions. Used to import company specific data (like client ID's from WordPress /Salesforce) and combine it with Google Analytics data. 17. Custom Metrics. Used to import company specific metrics and combine it with Google Analytics data. © Daragh Walsh
- 2. 18. Custom Report. A report that you create. You pick the dimensions and metrics and decide how they should be displayed. 19. Demographics. Reports that provide information about the age and gender of your users, along with the interests they express through their online travel and purchasing activities. 20. Dimensions. Attributes of your data e.g. the dimension City indicates the city, for example, "Paris" or "New York", from which a session originates. 21. Direct. Visits from people who typed your website’s URL into their browser or clicked a link in an email application (that didn’t include campaign tags). 22. Events. Used to track a specific type of visitor interactions with your web pages like ad clicks, video views, and downloads. 23. Filters. Let you include, exclude, or modify the data you collect in a view. 24. First-click Interaction. Assigns credit for sales and conversions to the first channel on the conversion path. 25. Funnel Visualisation. A visualization tool that maps the steps/pages a customer takes when visiting your website. 26. Goals. Measure how well your site or app fulfills your target objectives, e.g. subscribing to your email newsletter, submitting an inquiry or making a purchase. 27. Google Ads. Google's advertising platform that helps advertisers reach new customers online. 28. Google Data Studio. Google's reporting and dashboarding tool allows you to present and visualize data from Google Analytics, Google Sheets and other data sources. 29. Google Tag Manager. Google's tag management tool which allows one to easily alter code on a website created to track marketing analytics, e.g. Google Analytics tracking code, Facebook Pixel. 30. Keywords. The search terms people use to discover your website. 31. Landing Page. The first page viewed during a session, or in other words, the entrance page. 32. Last-Click Interaction. Assigns credit for sales and conversions to the last channel in the conversion path. 33. Medium. The general category of the traffic source, e.g. ‘organic’ for free search traffic, ‘cpc’ for cost-per-click and ‘referral’ for inbound links from other websites. 34. Metric. Typically a number or a percentage presented as columns of data within your reports. 35. New User. People that visit your website for the first time in the selected date range. 36. Not Provided. Since 2010, Google no longer provide the keyword data done on the secure version of Google (e.g. https://www.google.com) to protect the privacy of the searcher. 37. Not Set. A placeholder name that Analytics uses when it hasn't received any information for the dimension you have selected, e.g. Google Analytics was unable to determine someone’s exact geographic location. 38. Organic. Visitors who come to your website after searching Google.com and other search engines without clicking on a paid search ad. 39. Pages Per Session. Indicates how many pages visitors view when browsing through a website. © Daragh Walsh
- 3. 40. Pageview. Reported when a page has been viewed by a user on your website. 41. Paid Search. Visitors who come to your website from a Google Ad or other paid search ad. 42. Property. Represents your website or app, and is the collection point in Analytics for your data. You can add up to 50 properties to each Analytics account. 43. Referral. When a user clicks through to your website from another third-party website. 44. Search Console. Tools and reports to help you measure your site's Search traffic and performance, fix issues, and make your site shine in Google Search results. 45. Segments. Analysis tool which allows you to isolate and compare various groups of users on your website. 46. Session. A single visit to your website, consisting of one or more pageviews, along with events, ecommerce transactions and other interactions. By default, a session ends after 30 minutes of inactivity or when a user closes a browser window. 47. Site Search. Lets you understand the extent to which users took advantage of your site’s search function and which search terms they entered. 48. Source. Communicates where the user came from. For example, if the medium was “organic,” the source might be “google.com”. 49. URL Builder. Google's tool to add extra bits of information (known as campaign tags, UTM tags or parameters) to the URL of your online marketing or advertising campaigns. 50. View. A defined view of data from a property. You can add up to 25 views to a property. © Daragh Walsh