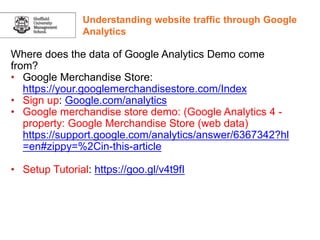
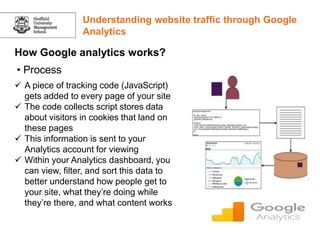
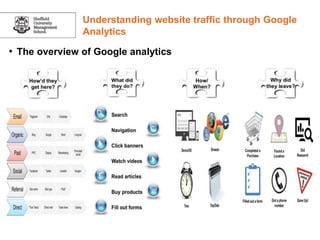
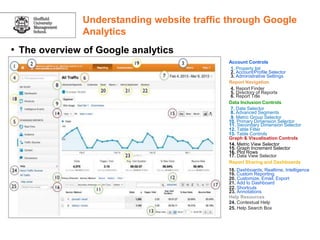
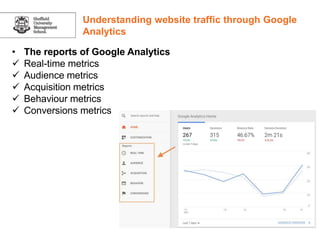
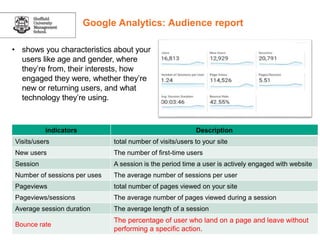
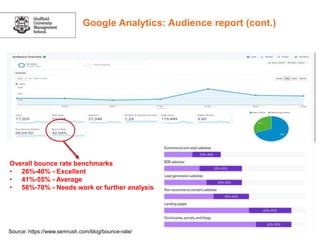
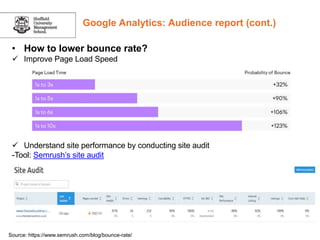
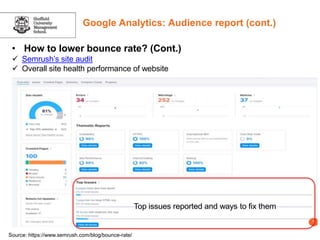
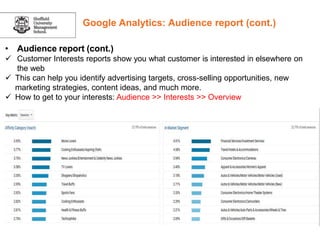
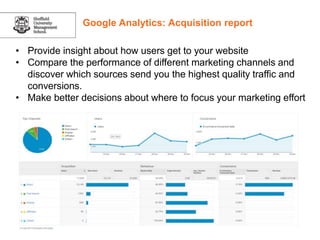
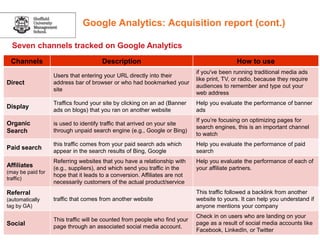
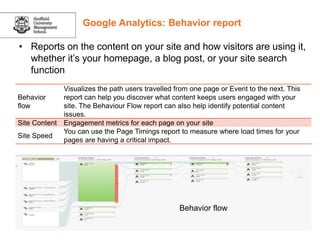
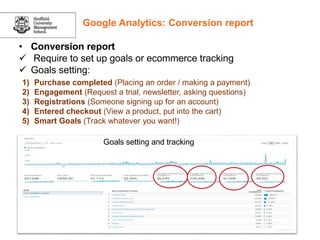
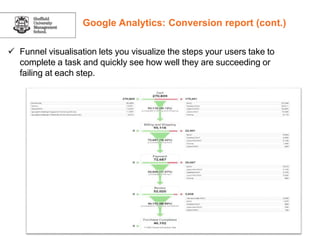
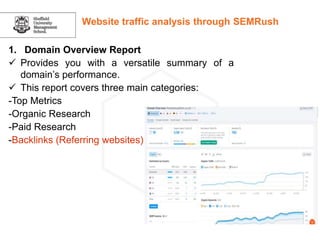
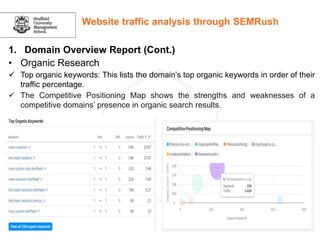
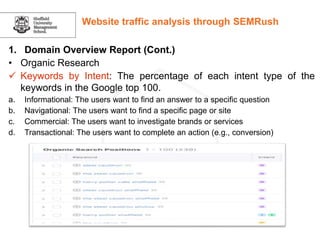
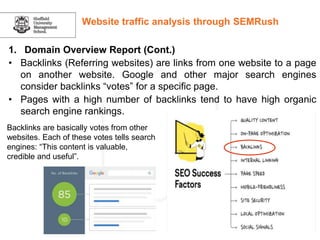
Enhancing Worker Digital Experience: A Hands-on Workshop for Partners
web analysis document | web analysis document | web analysis document | web analysis document
1. Click to edit Master title style
WEBSITE ANALYTICS
Dr Xin Zhao
Sheffield University Information School
Email: xin.zhao@sheffield.ac.uk
MGT3006
2023-2024
2. Click to edit Master title style
PowerPoint header
for front cover
• Understand the importance of website analytics in digital
marketing
• Website traffic analysis through Google Analytics
• Website traffic analysis through SEMRush
• The limitations of website analytics
• Additional learning – email marketing
Learning Objectives
3. Click to edit Master title style
PowerPoint header
for front cover
Individual assessment (see the assessment section on BB)
Develop a digital marketing strategy for a real-life SME
Content section:
• An introduction
• Critique of Current Digital Marketing Strategy
• Reflection on Using Generative AI for Social Media
Marketing
• Details of the proposed digital marketing strategy
Learning Objectives
4. Click to edit Master title style
• Create brand awareness
• Showcase the brand to prospective customers.
• Establish company image and relationship
with customers
Analyse how customer engage with the website
• Understand user demographics, goals, and
behaviour,
• Allow company to tailor website's content and
product offerings accordingly.
• Identify effective channels drive the most
traffic and conversions
• Improve performance
Company Websites
5. Click to edit Master title style
WEBSITE ANALYTICS: AN
OVERVIEW
6. Click to edit Master title style
PowerPoint header
for front cover
Website analytics
Website analytics refers to specifically to looking at the data that comes
from user activity on a given website.
• Traffic
• Patterns and relationships in order to understand user behaviour
• User experience
Why track website traffic?
• Estimate the number of users visiting the site
• Estimate the number of users reading specific contents (e.g., product
information)
• Identify topics/pages that are popular
• Improve the customer experience on websites
• Improve the company performance
7. Click to edit Master title style
PowerPoint header
for front cover
Website analytics
Where does the data come from?
• Web log files from the web server
• Insert JavaScript code into HTML text of websites and translate
the coded requests into tables, charts, and graphs that provide a
picture of what users are doing
• Statistics can be gathered daily, weekly, monthly, and annually
8. Click to edit Master title style
PowerPoint header
for front cover
Website analytics
How website analytics works: tagging and tracking process
Web analytics
Server
Web Page
Drop a “page tag” by
JavaScript (mini coding language)
https://www.sheffield.ac.uk/
1. Visitor arrives on web page
2. JavaScript detects
• What the page is
• Whether the visitor has been to site before by reading a
cookie
• Where the visitor came form (referring site)
• How long they stay on the page
3. JavaScript makes a call to web analytics tool with all of this
information
4. Tables, charts, and graphs of website traffic metrics
9. Click to edit Master title style
PowerPoint header
for front cover
Website analytics
What are website analytics approach? (Jansen et al., 2020)
Approach Advantages Disadvantages Example
User-centric
• Focus on people
• Compare across websites;
so can use for business
intelligence
• Creating a representative
user panel is challenging
• User computer software must
be installed
• Alexa
• ComScore
Site-centric
• No special user software to
install
• Wide range of analytics for
a specific site
• Site software must be
installed
• Focus on cookies and tags,
not real people
• Access limited to website
owner; so cannot use for
business intelligence among
multiple sites
• IBM
analytics
• Adobe
analytics
• Google
analytics
Network-centric
• Data collection is
straightforward
• No special software to
install for users or sites
• Compare across websites;
can use for business
intelligence
• Data can be challenging to
obtain
• Hitwise
• SimilarWeb
• SpyFu
• SEMRush
Source: Jansen, B. J., Jung, S. G., & Salminen, J. (2020). Data quality in website traffic metrics: A comparison of 86 websites using two popular analytics
services. ACM Transactions on the Web (TWEB), 25, 99.
11. Understanding website traffic through Google
Analytics
Where does the data of Google Analytics Demo come
from?
• Google Merchandise Store:
https://your.googlemerchandisestore.com/Index
• Sign up: Google.com/analytics
• Google merchandise store demo: (Google Analytics 4 -
property: Google Merchandise Store (web data)
https://support.google.com/analytics/answer/6367342?hl
=en#zippy=%2Cin-this-article
• Setup Tutorial: https://goo.gl/v4t9fI
12. What is Google Analytics?
Service provided by Google for generating statistics
about the visits to a web site (owner)
Aimed at marketers
Available since August 2006 to anyone free of charge
Paid for premium version also available
Works by loading and executing tracking code on the
visitor’s device then saving information gathered by this
code on Google servers in a Google Analytics account
Understanding website traffic through Google
Analytics
13. Understanding website traffic through Google
Analytics
How can you position your website to be an effective
tool for your organization and customers if you don’t
know what story your website may or may not be
telling?
How do you actually know how many customers came
to your website, where did they come from, and what
did they actually do on your website?
14. Understanding website traffic through Google
Analytics
How Google analytics works?
• Process
A piece of tracking code (JavaScript)
gets added to every page of your site
The code collects script stores data
about visitors in cookies that land on
these pages
This information is sent to your
Analytics account for viewing
Within your Analytics dashboard, you
can view, filter, and sort this data to
better understand how people get to
your site, what they’re doing while
they’re there, and what content works
15. Click to edit Master title style
GOOGLE ANALYTICS IN ACTION
16. • The overview of Google analytics
Understanding website traffic through Google
Analytics
17. 10. Primary Dimension Selector
11. Secondary Dimension Selector
18. Dashboards, Realtime, Intelligence
Account Controls
1. Property list
2. Account/Profile Selector
3. Administrative Settings
Report Navigation
4. Report Finder
5. Directory of Reports
6. Report Title
Data Inclusion Controls
7. Date Selector
8. Advanced Segments
9. Metric Group Selector
12. Table Filter
13. Table Controls
Graph & Visualisation Controls
14. Metric View Selector
15. Graph Increment Selector
16. Plot Rows
17. Data View Selector
Report Sharing and Dashboards
19. Custom Reporting
20. Customize, Email, Export
21. Add to Dashboard
22. Shortcuts
23. Annotations
Help Resources
24. Contextual Help
25. Help Search Box
Understanding website traffic through Google
Analytics
• The overview of Google analytics
18. • The reports of Google Analytics
Real-time metrics
Audience metrics
Acquisition metrics
Behaviour metrics
Conversions metrics
Understanding website traffic through Google
Analytics
19. Real-time data collected and measuring activity as it happens
Verify tracking code is working
Check the traffic when a social media post has been mode
Monitor the effectiveness of an email campaign
Google Analytics: Real-time report
20. Active user (visit): a period of interaction between a
user and a website
Page views: counts every time a page on a site load
Location: where the users come from
what traffic sources referred them to your site
Content viewing
Google Analytics: Real-time report (Cont.)
21. Google Analytics: Audience report
• shows you characteristics about your
users like age and gender, where
they’re from, their interests, how
engaged they were, whether they’re
new or returning users, and what
technology they’re using.
indicators Description
Visits/users total number of visits/users to your site
New users The number of first-time users
Session A session is the period time a user is actively engaged with website
Number of sessions per uses The average number of sessions per user
Pageviews total number of pages viewed on your site
Pageviews/sessions The average number of pages viewed during a session
Average session duration The average length of a session
Bounce rate
The percentage of user who land on a page and leave without
performing a specific action.
22. Overall bounce rate benchmarks
• 26%-40% - Excellent
• 41%-55% - Average
• 56%-70% - Needs work or further analysis
Source: https://www.semrush.com/blog/bounce-rate/
Google Analytics: Audience report (cont.)
23. Source: https://www.semrush.com/blog/bounce-rate/
• How to lower bounce rate?
Improve Page Load Speed
Understand site performance by conducting site audit
-Tool: Semrush’s site audit
Google Analytics: Audience report (cont.)
24. Source: https://www.semrush.com/blog/bounce-rate/
• How to lower bounce rate? (Cont.)
Semrush’s site audit
Overall site health performance of website
Top issues reported and ways to fix them
Google Analytics: Audience report (cont.)
26. • How to lower bounce rate? (Cont.)
Optimize the mobile user experience
Tool: Google’s Mobile Friendly Test
Enter the URL of the page you
want to test and hit “Test URL.”
Testing results
Google Analytics: Audience report (cont.)
27. • How to lower bounce rate? (Cont.)
Make the content easy to read and follow
Improve site structure
Use the internal links
Enter the URL of the page you
want to test and hit “Test URL.”
Google Analytics: Audience report (cont.)
28. • Audience report (cont.)
Demographics (age and gender)
Interests (user preference of web
content; Affinity category)
Geo (location)
Behaviour (new vs. returning)
Technology
Mobile
User flow
Demographics
Interests
Geo
User flow
Google Analytics: Audience report (cont.)
29. • Audience report (cont.)
Customer Interests reports show you what customer is interested in elsewhere on
the web
This can help you identify advertising targets, cross-selling opportunities, new
marketing strategies, content ideas, and much more.
How to get to your interests: Audience >> Interests >> Overview
Google Analytics: Audience report (cont.)
30. • Provide insight about how users get to your website
• Compare the performance of different marketing channels and
discover which sources send you the highest quality traffic and
conversions.
• Make better decisions about where to focus your marketing effort
Google Analytics: Acquisition report
31. Seven channels tracked on Google Analytics
Channels Description How to use
Direct
Users that entering your URL directly into their
address bar of browser or who had bookmarked your
site
if you've been running traditional media ads
like print, TV, or radio, because they require
audiences to remember and type out your
web address
Display
Traffics found your site by clicking on an ad (Banner
ads on blogs) that you ran on another website
Help you evaluate the performance of banner
ads
Organic
Search
is used to identify traffic that arrived on your site
through unpaid search engine (e.g., Google or Bing)
If you’re focusing on optimizing pages for
search engines, this is an important channel
to watch
Paid search
this traffic comes from your paid search ads which
appear in the search results of Bing, Google
Help you evaluate the performance of paid
search
Affiliates
(may be paid for
traffic)
Referring websites that you have a relationship with
(e.g., suppliers), and which send you traffic in the
hope that it leads to a conversion. Affiliates are not
necessarily customers of the actual product/service
Help you evaluate the performance of each of
your affiliate partners.
Referral
(automatically
tag by GA)
traffic that comes from another website
This traffic followed a backlink from another
website to yours. It can help you understand if
anyone mentions your company
Social
This traffic will be counted from people who find your
page through an associated social media account.
Check in on users who are landing on your
page as a result of social media accounts like
Facebook, LinkedIn, or Twitter
Google Analytics: Acquisition report (cont.)
32. • Reports on the content on your site and how visitors are using it,
whether it’s your homepage, a blog post, or your site search
function
Behavior
flow
Visualizes the path users travelled from one page or Event to the next. This
report can help you discover what content keeps users engaged with your
site. The Behaviour Flow report can also help identify potential content
issues.
Site Content Engagement metrics for each page on your site
Site Speed
You can use the Page Timings report to measure where load times for your
pages are having a critical impact.
Behavior flow
Google Analytics: Behavior report
33. • Conversion report
Require to set up goals or ecommerce tracking
Goals setting:
Goals setting and tracking
1) Purchase completed (Placing an order / making a payment)
2) Engagement (Request a trial, newsletter, asking questions)
3) Registrations (Someone signing up for an account)
4) Entered checkout (View a product, put into the cart)
5) Smart Goals (Track whatever you want!)
Google Analytics: Conversion report
34. Funnel visualisation lets you visualize the steps your users take to
complete a task and quickly see how well they are succeeding or
failing at each step.
Google Analytics: Conversion report (cont.)
35. Activity Description
In this exercise, you will use the Google Analytics platforms to analyze the
online traffics of Google Merchandise store. Google Analytics is a free Web
analytics service that provides statistics and basic analytical tools for
search engine optimization (SEO) and marketing purposes. The service is
available to anyone with a Google account. To experience different features
of Google Analytics, we will use the demo account provided by Google.
Step 1: Assessing the Google Analytics demo account:
• Please visit:
• Google merchandise store demo: (Google Analytics 4 -property: Google
Merchandise Store (web data)
https://support.google.com/analytics/answer/6367342?hl=en#zippy=%2Cin-
this-article
Step 2: Exploring the google analytics reports
Activity: Understanding website traffic through
Google Analytics
36. Activity Description
Q1: Please explain what is conversion? What is the top conversion path of Google Merchandise
in October 2022?
Q2: For the goal of Purchase Completed, how many conversions completed in 11 Oct 2022? For
the goal of Engage Users, how many conversions completed in the 11 Oct 2022?
Q3: The marketing team in your company would like to identify the most viewed product category
on the site in November 2022. Provide the names of the top 2 product performance web pages.
Q4: Let us assume that google merchandise is a start-up company. Using the reports available in
the Acquisition/Traffic sources category check whether their brand awareness increased over a
period from Jan 2022 to Nov 2022.
Q5: In 2022, the marketing team at your company is thinking about developing a mobile version of
your website. They want to know how many visitors currently use a mobile device to make a
purchase. As a secondary request, the team wants to test out a mobile phone app, but only have
the resources to develop one initial version. Should they develop an Android-based app or an iOS
app? Create a report that provides this information.
Activity: Understanding website traffic through
Google Analytics
37. Click to edit Master title style
WEBSITE TRAFFIC
ANALYSIS THROUGH
SEMRUSH
38. Click to edit Master title style
PowerPoint header
for front cover
Overview:
Web traffic is the amount of data sent and received by visitors to a
website. This necessarily does not include the traffic generated by
bots. Since the mid-1990s, web traffic has been the largest portion
of Internet traffic. This is determined by the number of visitors and
the number of pages they visit.
Web analytics is the measurement, collection, analysis and
reporting of web data for purposes of understanding and optimizing
web usage
Website traffic analysis through SEMRush
39. Click to edit Master title style
PowerPoint header
for front cover
Objectives:
In this exercise, you will help your SME company to conduct the
online traffic analysis through SEMRush. SEMRush is a powerful
tool to see how popular a website is, its traffic sources, average
time on site, ranking info, top referring sites, paid keywords, related
mobile apps, and much, much more.
Website traffic analysis through SEMRush
40. Click to edit Master title style
PowerPoint header
for front cover
Activity Description
Register an account in SEMRush (7 days free trail):
1. Please visit: SEMRush
2. Click “Start your free trail” on the Homepage:
3. Following the instructions to register an account
4. Logging into your account and creating a project
5. Visit the dashboard page and exploring the website traffic
performance
Website traffic analysis through SEMRush
41. Click to edit Master title style
PowerPoint header
for front cover
Website traffic analysis through SEMRush
1. Domain Overview Report
Provides you with a versatile summary of a
domain’s performance.
This report covers three main categories:
-Top Metrics
-Organic Research
-Paid Research
-Backlinks (Referring websites)
42. Click to edit Master title style
PowerPoint header
for front cover
Website traffic analysis through SEMRush
1. Domain Overview Report (Cont.)
• Organic Research
Top organic keywords: This lists the domain’s top organic keywords in order of their
traffic percentage.
The Competitive Positioning Map shows the strengths and weaknesses of a
competitive domains’ presence in organic search results.
43. Click to edit Master title style
PowerPoint header
for front cover
Website traffic analysis through SEMRush
1. Domain Overview Report (Cont.)
• Organic Research
Keywords by Intent: The percentage of each intent type of the
keywords in the Google top 100.
a. Informational: The users want to find an answer to a specific question
b. Navigational: The users want to find a specific page or site
c. Commercial: The users want to investigate brands or services
d. Transactional: The users want to complete an action (e.g., conversion)
44. Click to edit Master title style
PowerPoint header
for front cover
Website traffic analysis through SEMRush
1. Domain Overview Report (Cont.)
• Backlinks (Referring websites) are links from one website to a page
on another website. Google and other major search engines
consider backlinks “votes” for a specific page.
• Pages with a high number of backlinks tend to have high organic
search engine rankings.
Backlinks are basically votes from other
websites. Each of these votes tells search
engines: “This content is valuable,
credible and useful”.
45. Click to edit Master title style
PowerPoint header
for front cover
Website traffic analysis through SEMRush
2. Traffic Analytics Overview Report
• Allows you to gather estimates on any website’s traffic and make
comparisons between up to 5 websites at a time
Traffic metrics
Benchmark your website against competitors
46. Click to edit Master title style
PowerPoint header
for front cover
Website traffic analysis through SEMRush
2. Traffic Analytics Overview Report (cont.)
Benchmark your website against competitors
For example, Steel Cauldron vs. 200 degree v.s Tamper Coffee
47. Click to edit Master title style
PowerPoint header
for front cover
Limitations of website analytics
• Website analytics can show how consumers arrived at and moved through a
firm’s website, but offers little insight into the stage of their journey (Vollrath
and Villegas, 2022).
• Weblog file limitations often appear because certain types of visitors’ data are
not loaded (e.g., visitor details and incomplete information) (Arshad and
Ahmad, 2020)
• Web visit counting can be incorrect (Arshad and Ahmad, 2020)
• Data ownership issue due to data privacy laws
GDPR (General Data Protection Regulation) in Europe; After GDPR,
companies are required to acquire the user’s consent to record their
data. A cookie disclaimer needs to be inserted into the website.
CCPA (California Consumer Privacy Act) in California, USA
Sources:
• Vollrath, M. D., & Villegas, S. G. (2022). Avoiding digital marketing analytics myopia: revisiting the customer decision journey as a strategic marketing
framework. Journal of Marketing Analytics, 10(2), 106-113.
• Arshad, M., & Ahmad, P. (2020). Measuring Effectiveness of Library Websites with User Traffiffic Analytics: A Review. Library Philosophy and Practice,
1-16.
48. Click to edit Master title style
ADDITIONAL LEARNING
49. Click to edit Master title style
PowerPoint header
for front cover
E-mail marketing campaign through
Mailchimp
Objective:
In this exercise, you will learn how to create a “personalized email”
campaign. Suppose you are helping “Sheffield Clothing” to promote
the new arrival products like t-shirt, chino trousers and beanie. You
can select different templates from MailChimp to create your own
email campaign. Then, you need to insert product photo and
product description in your email campaign. After finishing the
campaign design, you can send it to your imported “subscribers”.
50. Click to edit Master title style
PowerPoint header
for front cover
E-mail marketing campaign through
Mailchimp
Activity Description
Step 1: Select Create Campaign in your MailChimp
homepage
Step 2: Select “Create an Email”
Step 3: Creating a campaign name, e.g. “Shop the latest
arrivals from Sheffield Clothing” -> Then click Begin
Step 4: Setting up relative information:
Step 5: Send the campaign in Mailchimp homepage:
51. Click to edit Master title style
PowerPoint header
for front cover
E-mail marketing campaign through
Mailchimp
52. Click to edit Master title style
PowerPoint header
for front cover
E-mail marketing campaign through
Mailchimp
53. Click to edit Master title style
PowerPoint header
for front cover
E-mail marketing campaign through
Mailchimp
54. Click to edit Master title style
PowerPoint header
for front cover
E-mail marketing campaign through
Mailchimp
55. Click to edit Master title style
PowerPoint header
for front cover
E-mail marketing campaign through
Mailchimp