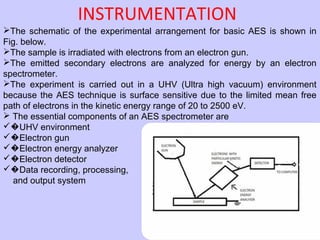
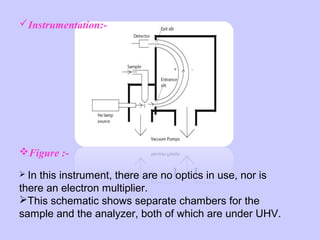
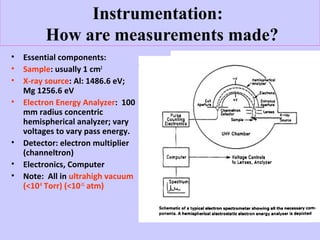
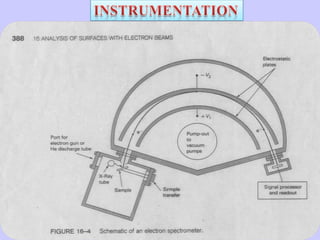
This document provides an overview of electron spectroscopy techniques, including X-ray photoelectron spectroscopy (XPS), Auger electron spectroscopy (AES), and ultraviolet photoelectron spectroscopy (UPS). It discusses the basic principles, instrumentation, applications, and advantages/limitations of each technique. XPS is described as using X-rays to eject core electrons and measure their kinetic energy to determine elemental composition. AES uses electrons to eject core electrons which cause additional electrons to fall into the vacancy, emitting energy measured to identify elements. UPS uses UV light to eject valence electrons and measure their kinetic energy to determine molecular orbital energies.


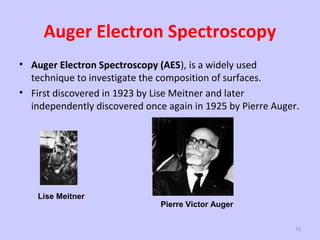
![Principles of AUGER:Auger electron spectroscopy (AES; pronounced [oʒe] in French) is a
common analytical technique used specifically in the study of surfaces
and, more generally, in the area of materials science.
Underlying the spectroscopic technique is the Auger effect, as it has
come to be called, which is based on the analysis of energetic electrons
emitted from an excited atom after a series of internal relaxation events.
PRINCIPLES OF OPERATION
(Auger Electron Spectroscopy)
• sample bombardment by electrons
•core electron removed
• electron from a higher energy level fall into the
vacancy
•release of energy.
•measured energy and defined sample](https://image.slidesharecdn.com/electronspectroscopy-140202230251-phpapp02/85/Electron-spectroscopy-16-320.jpg)