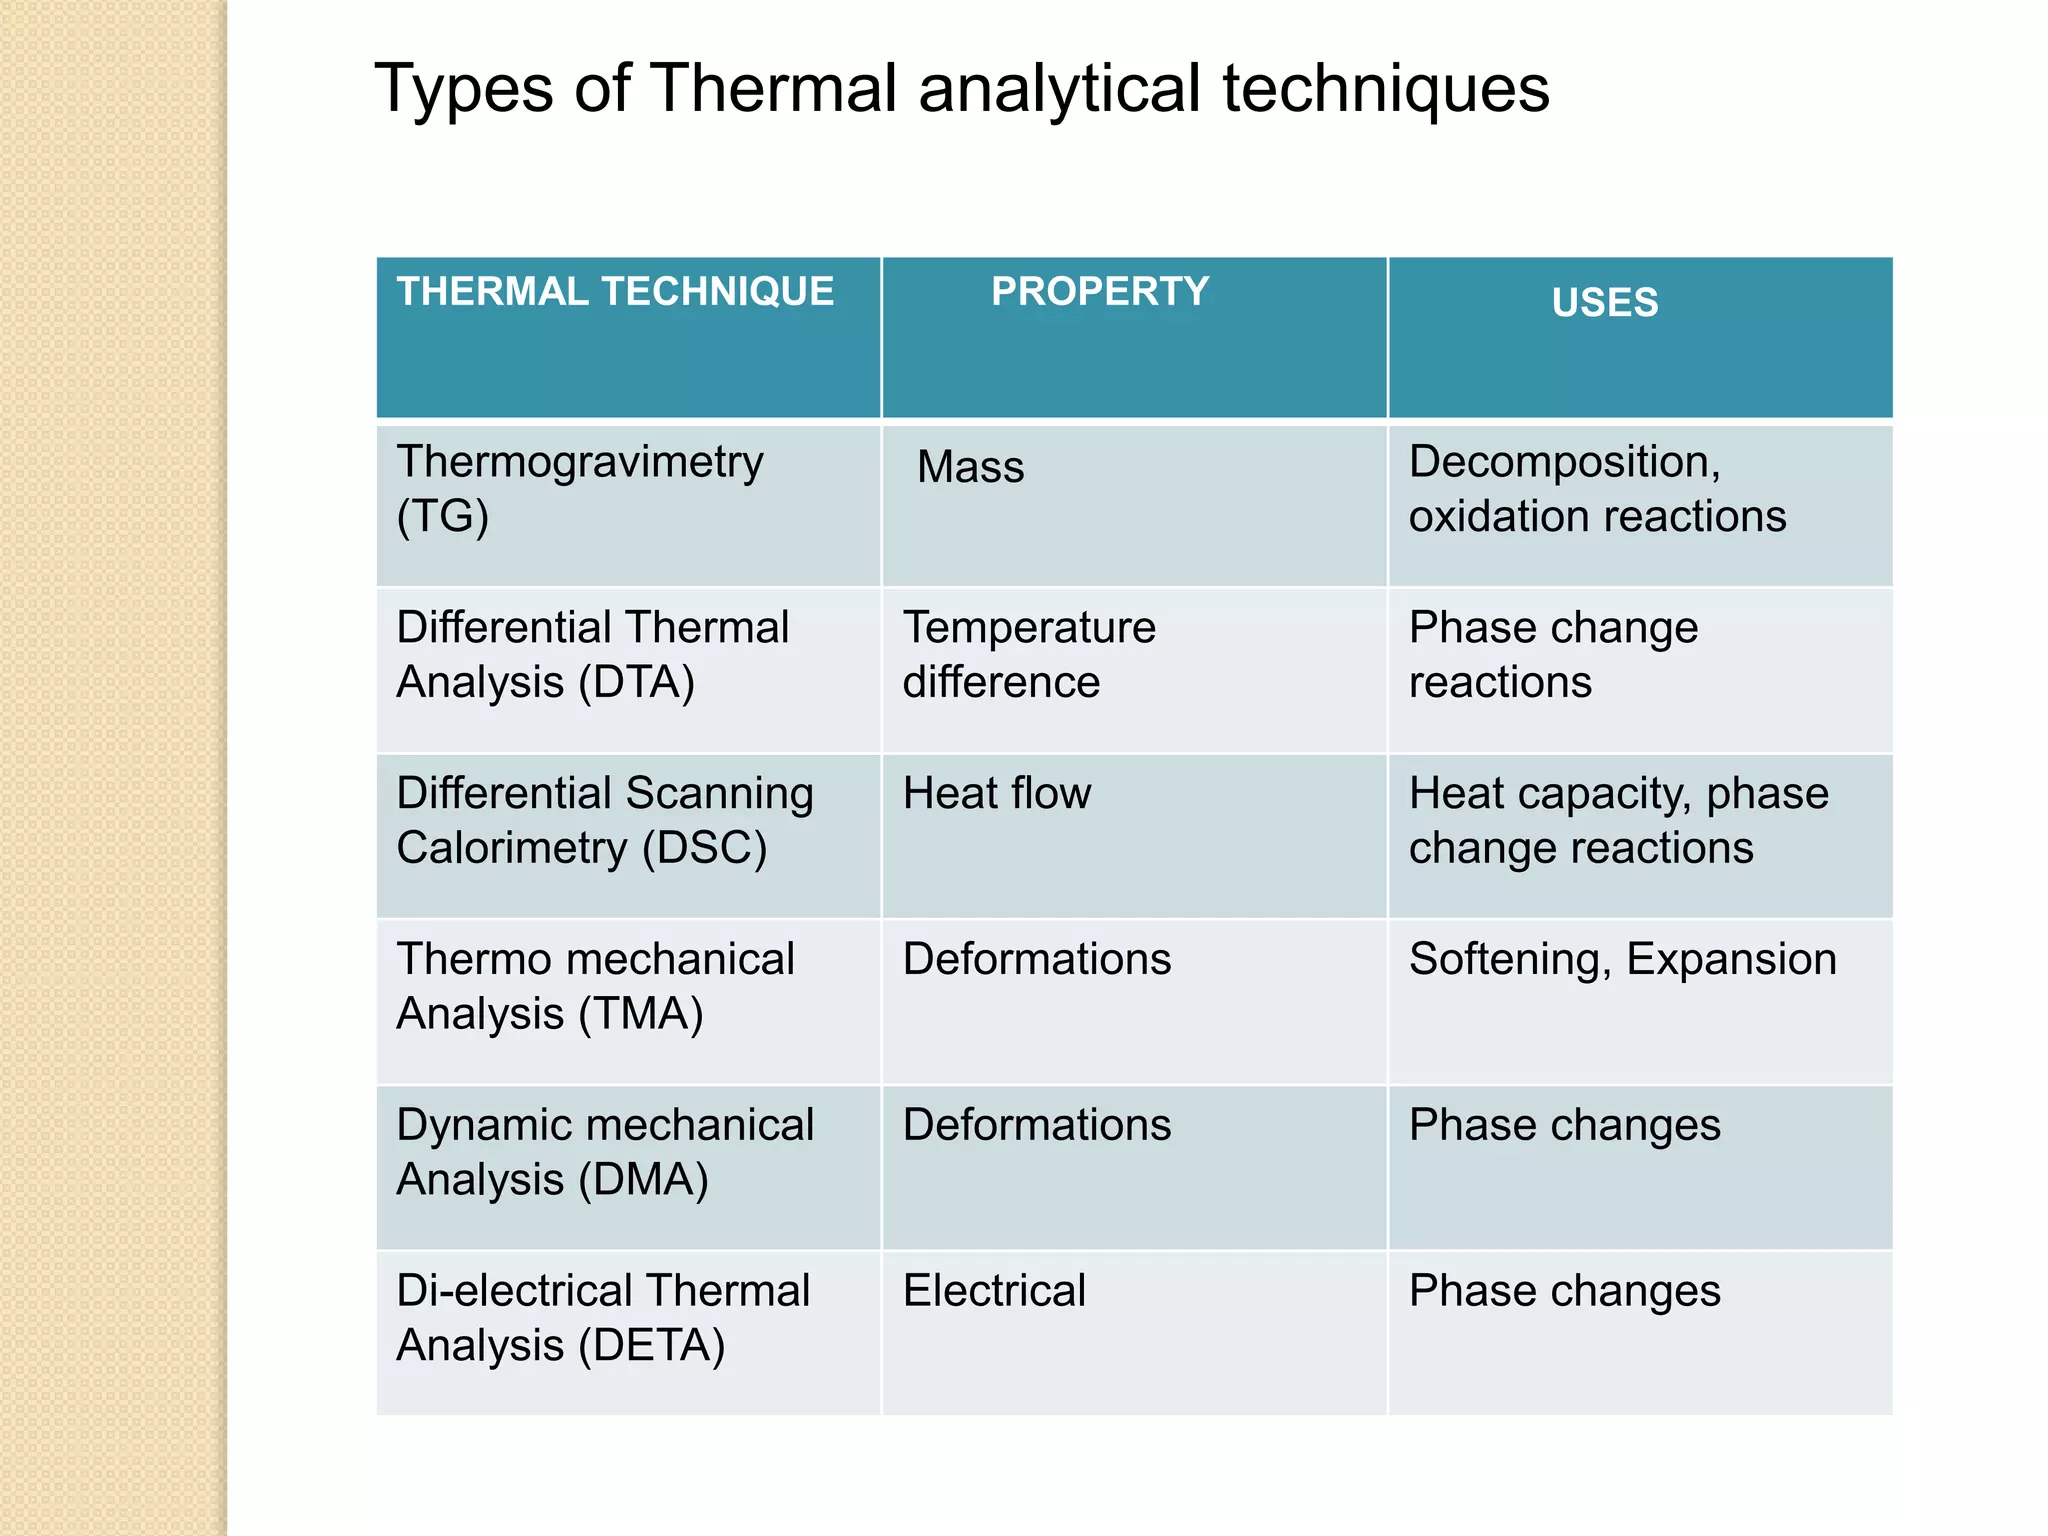
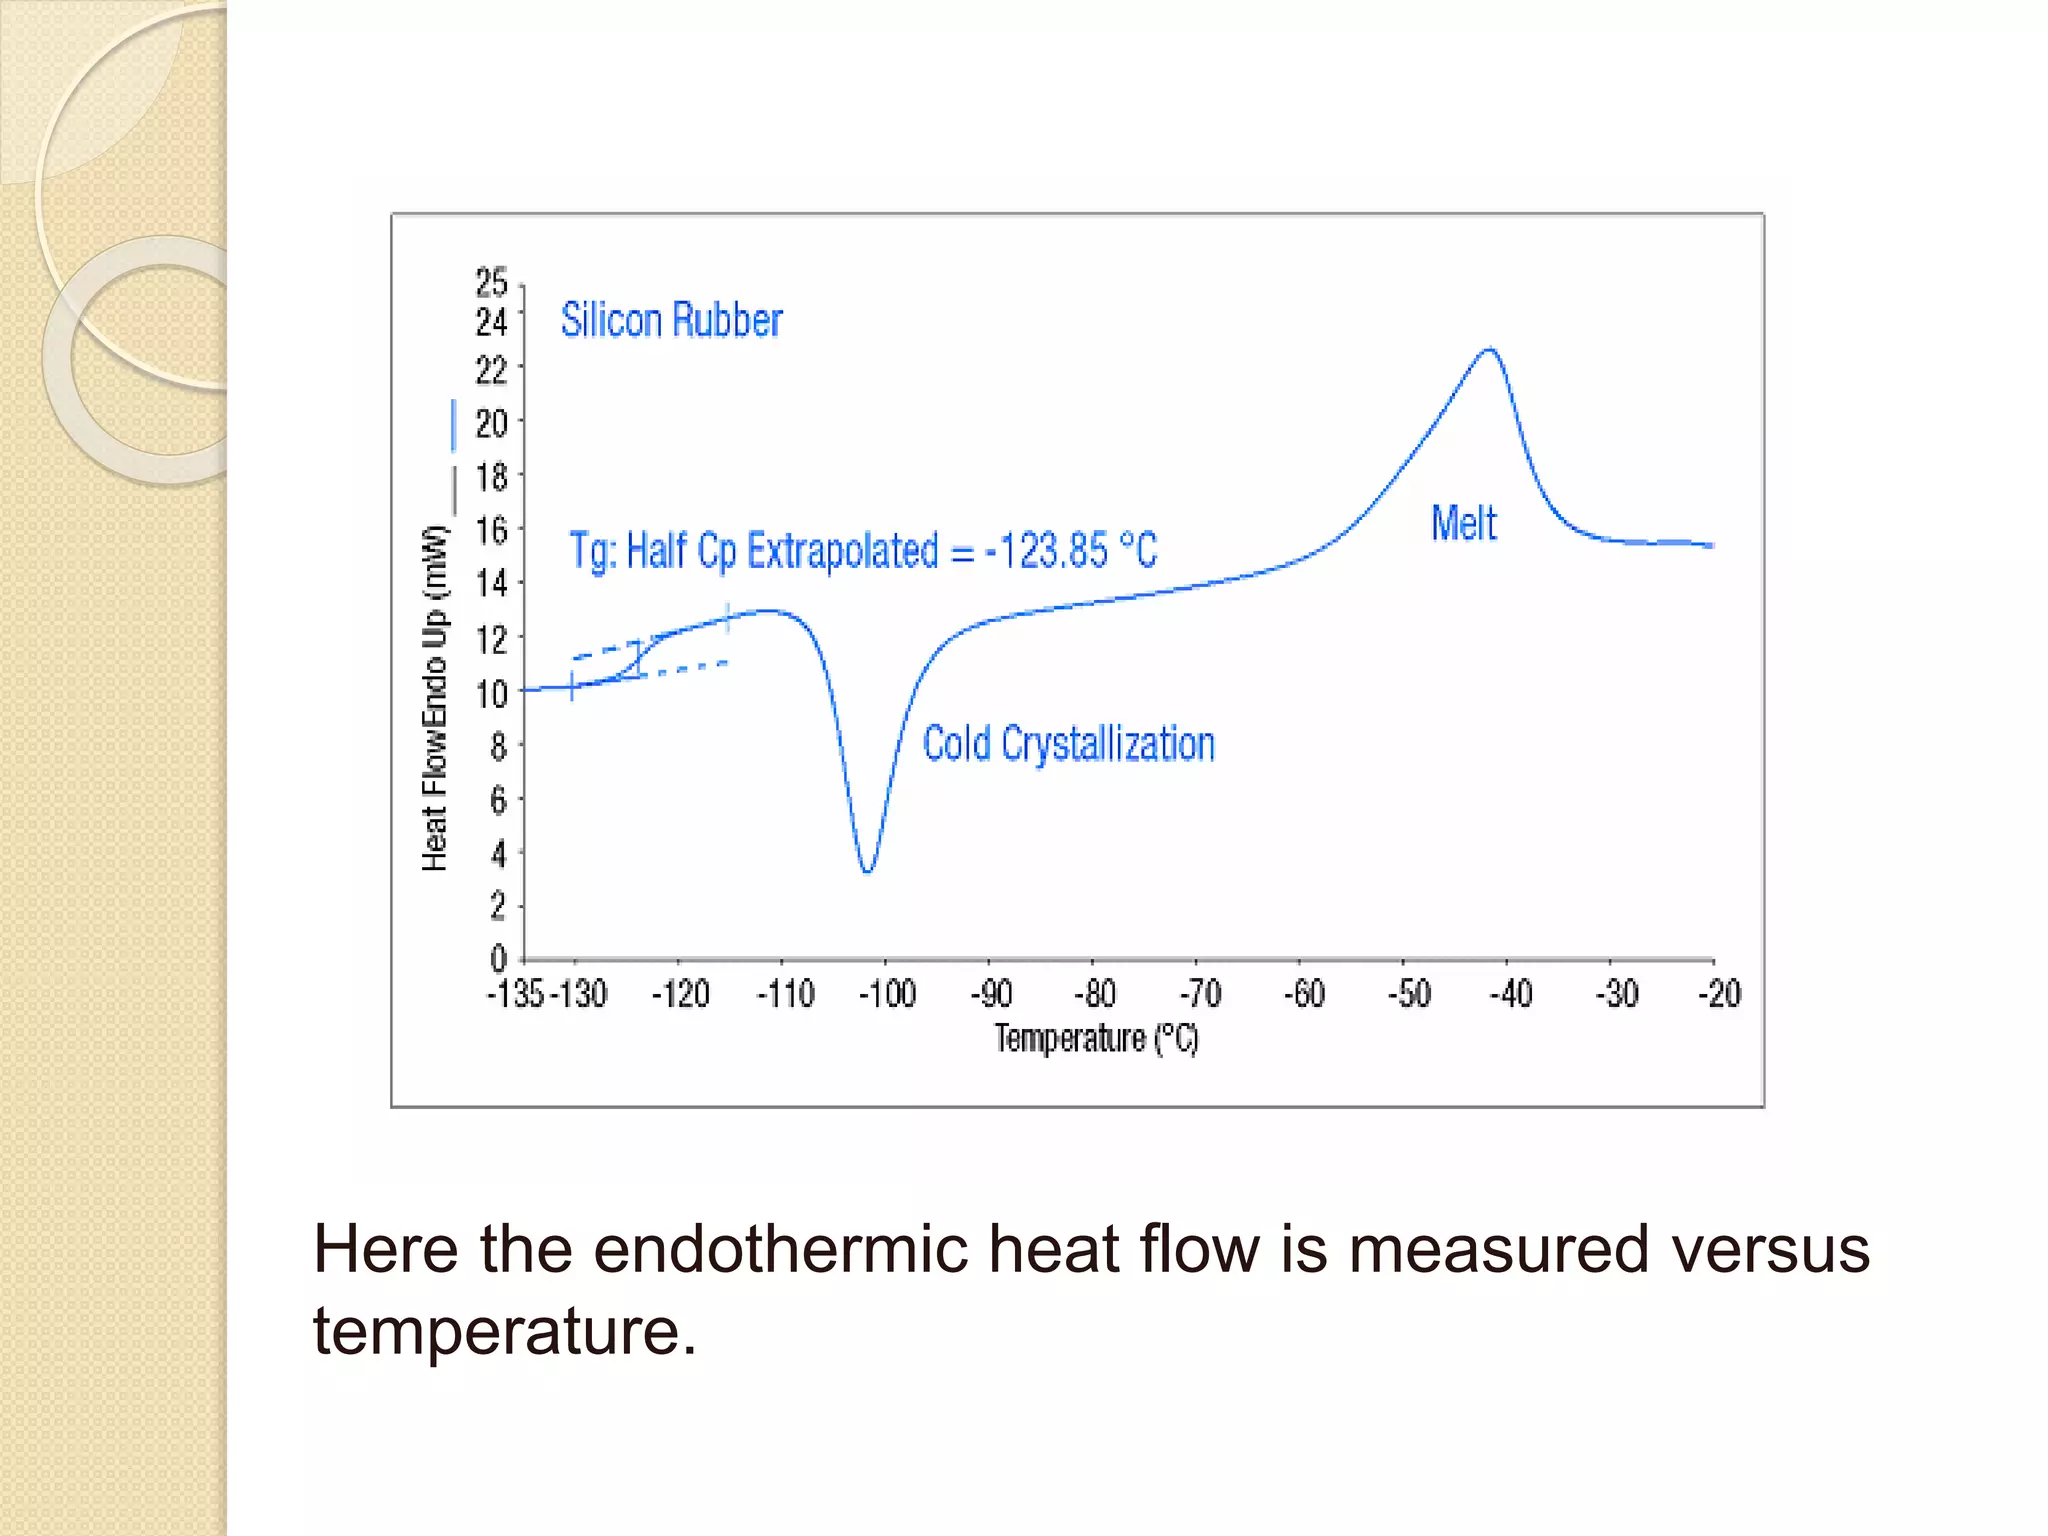
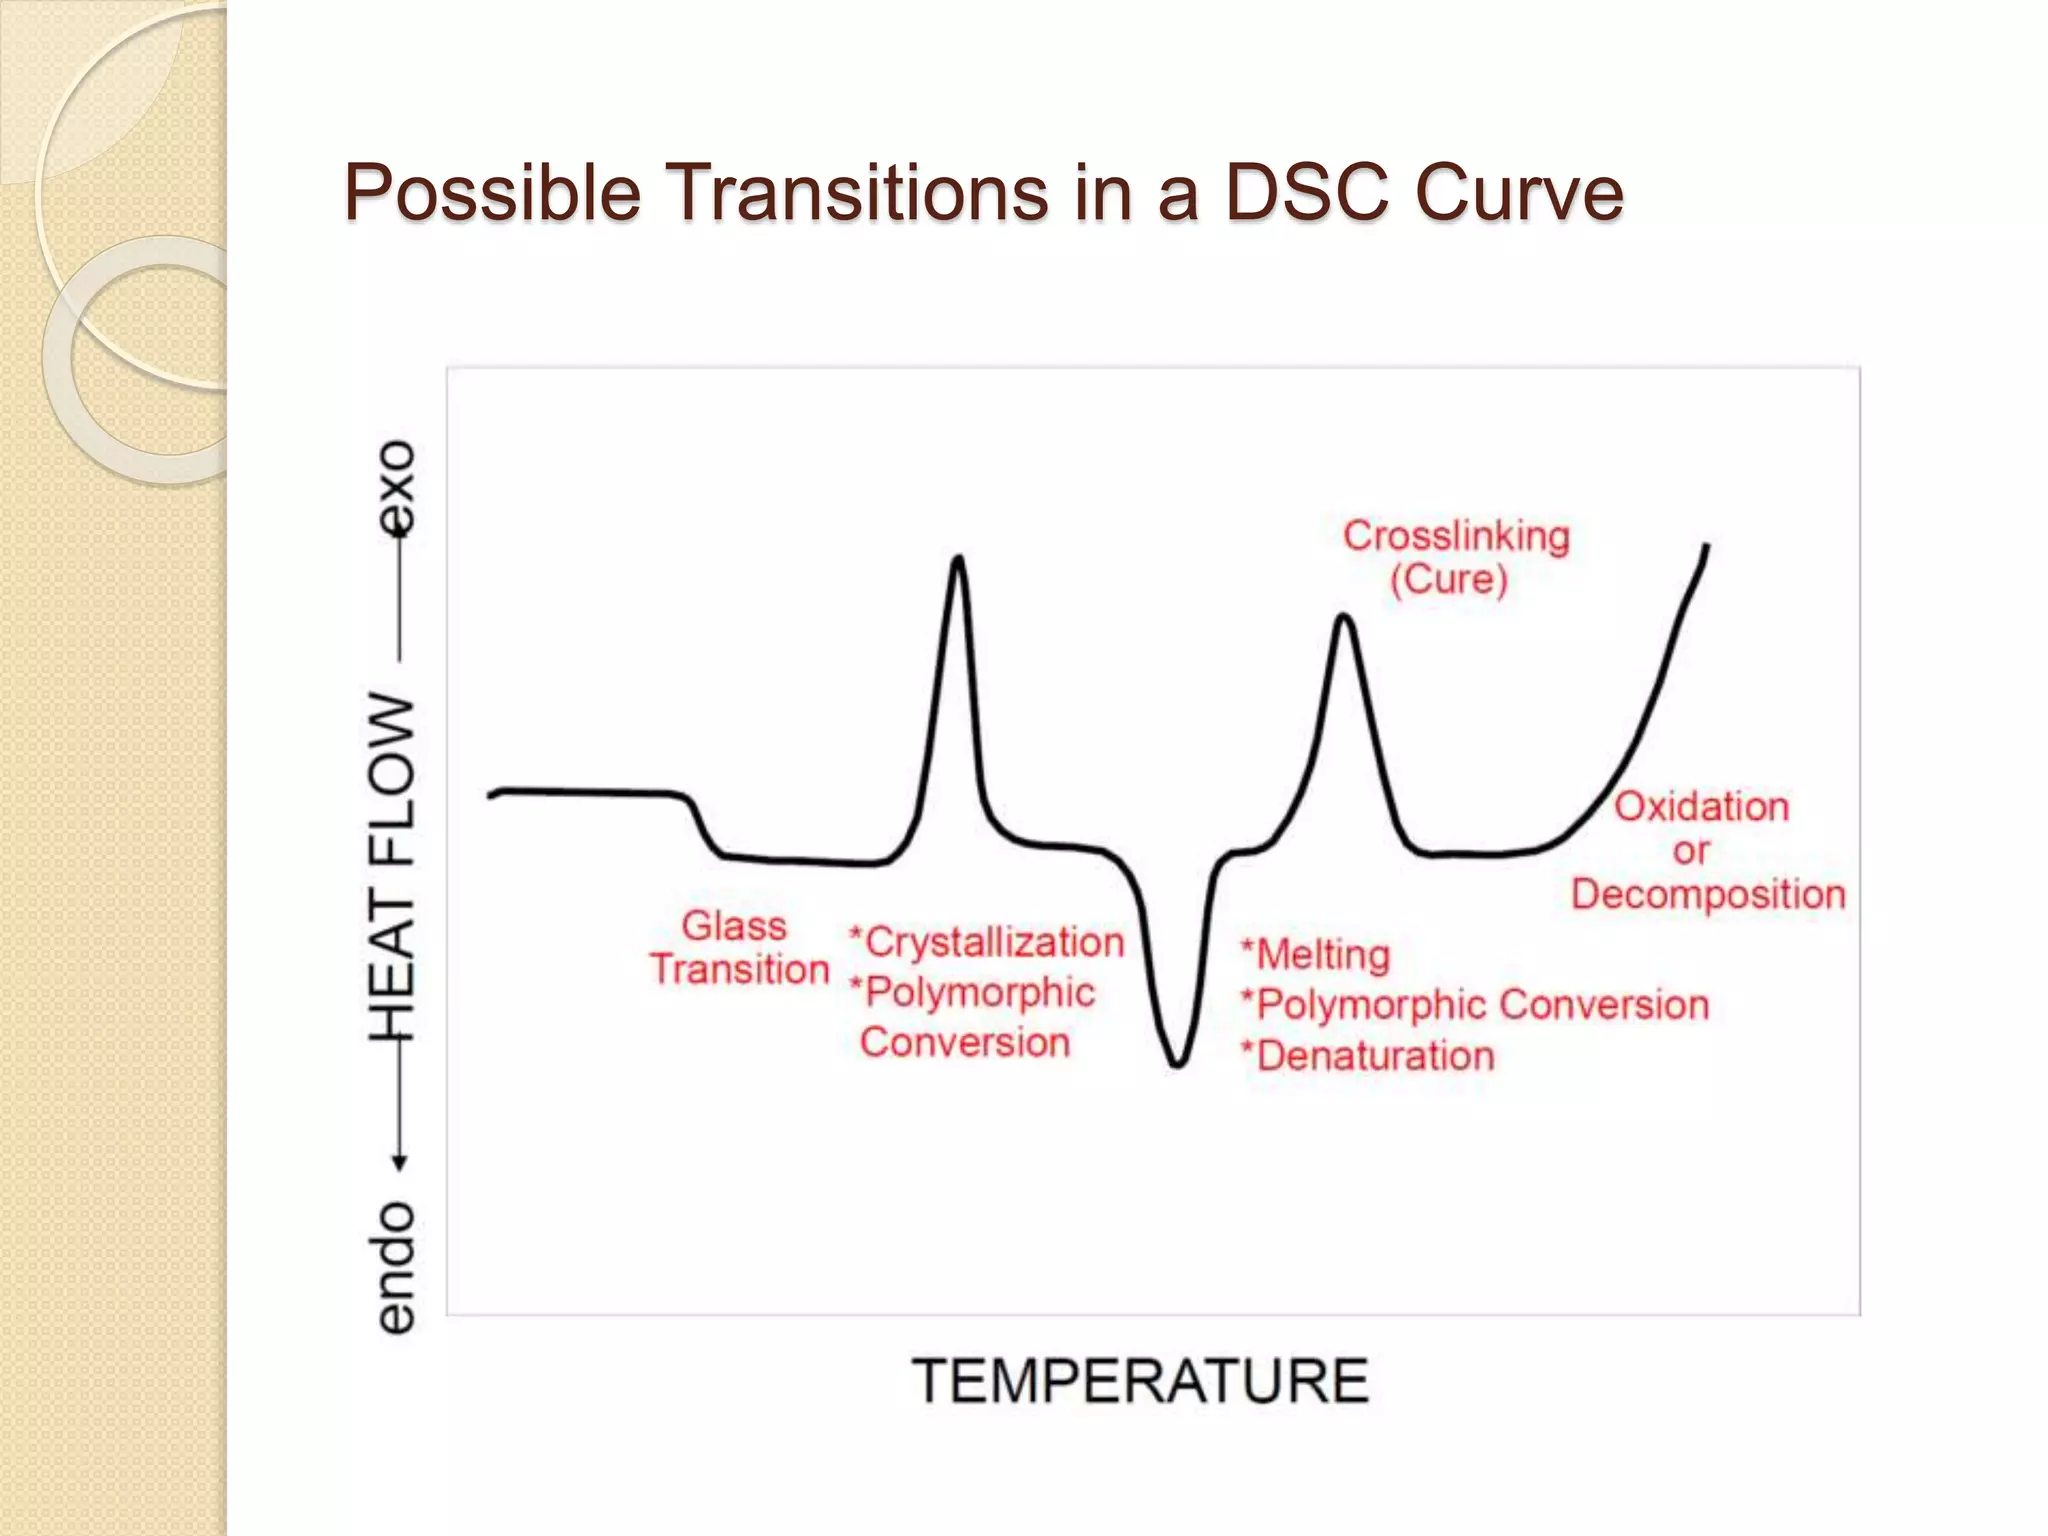
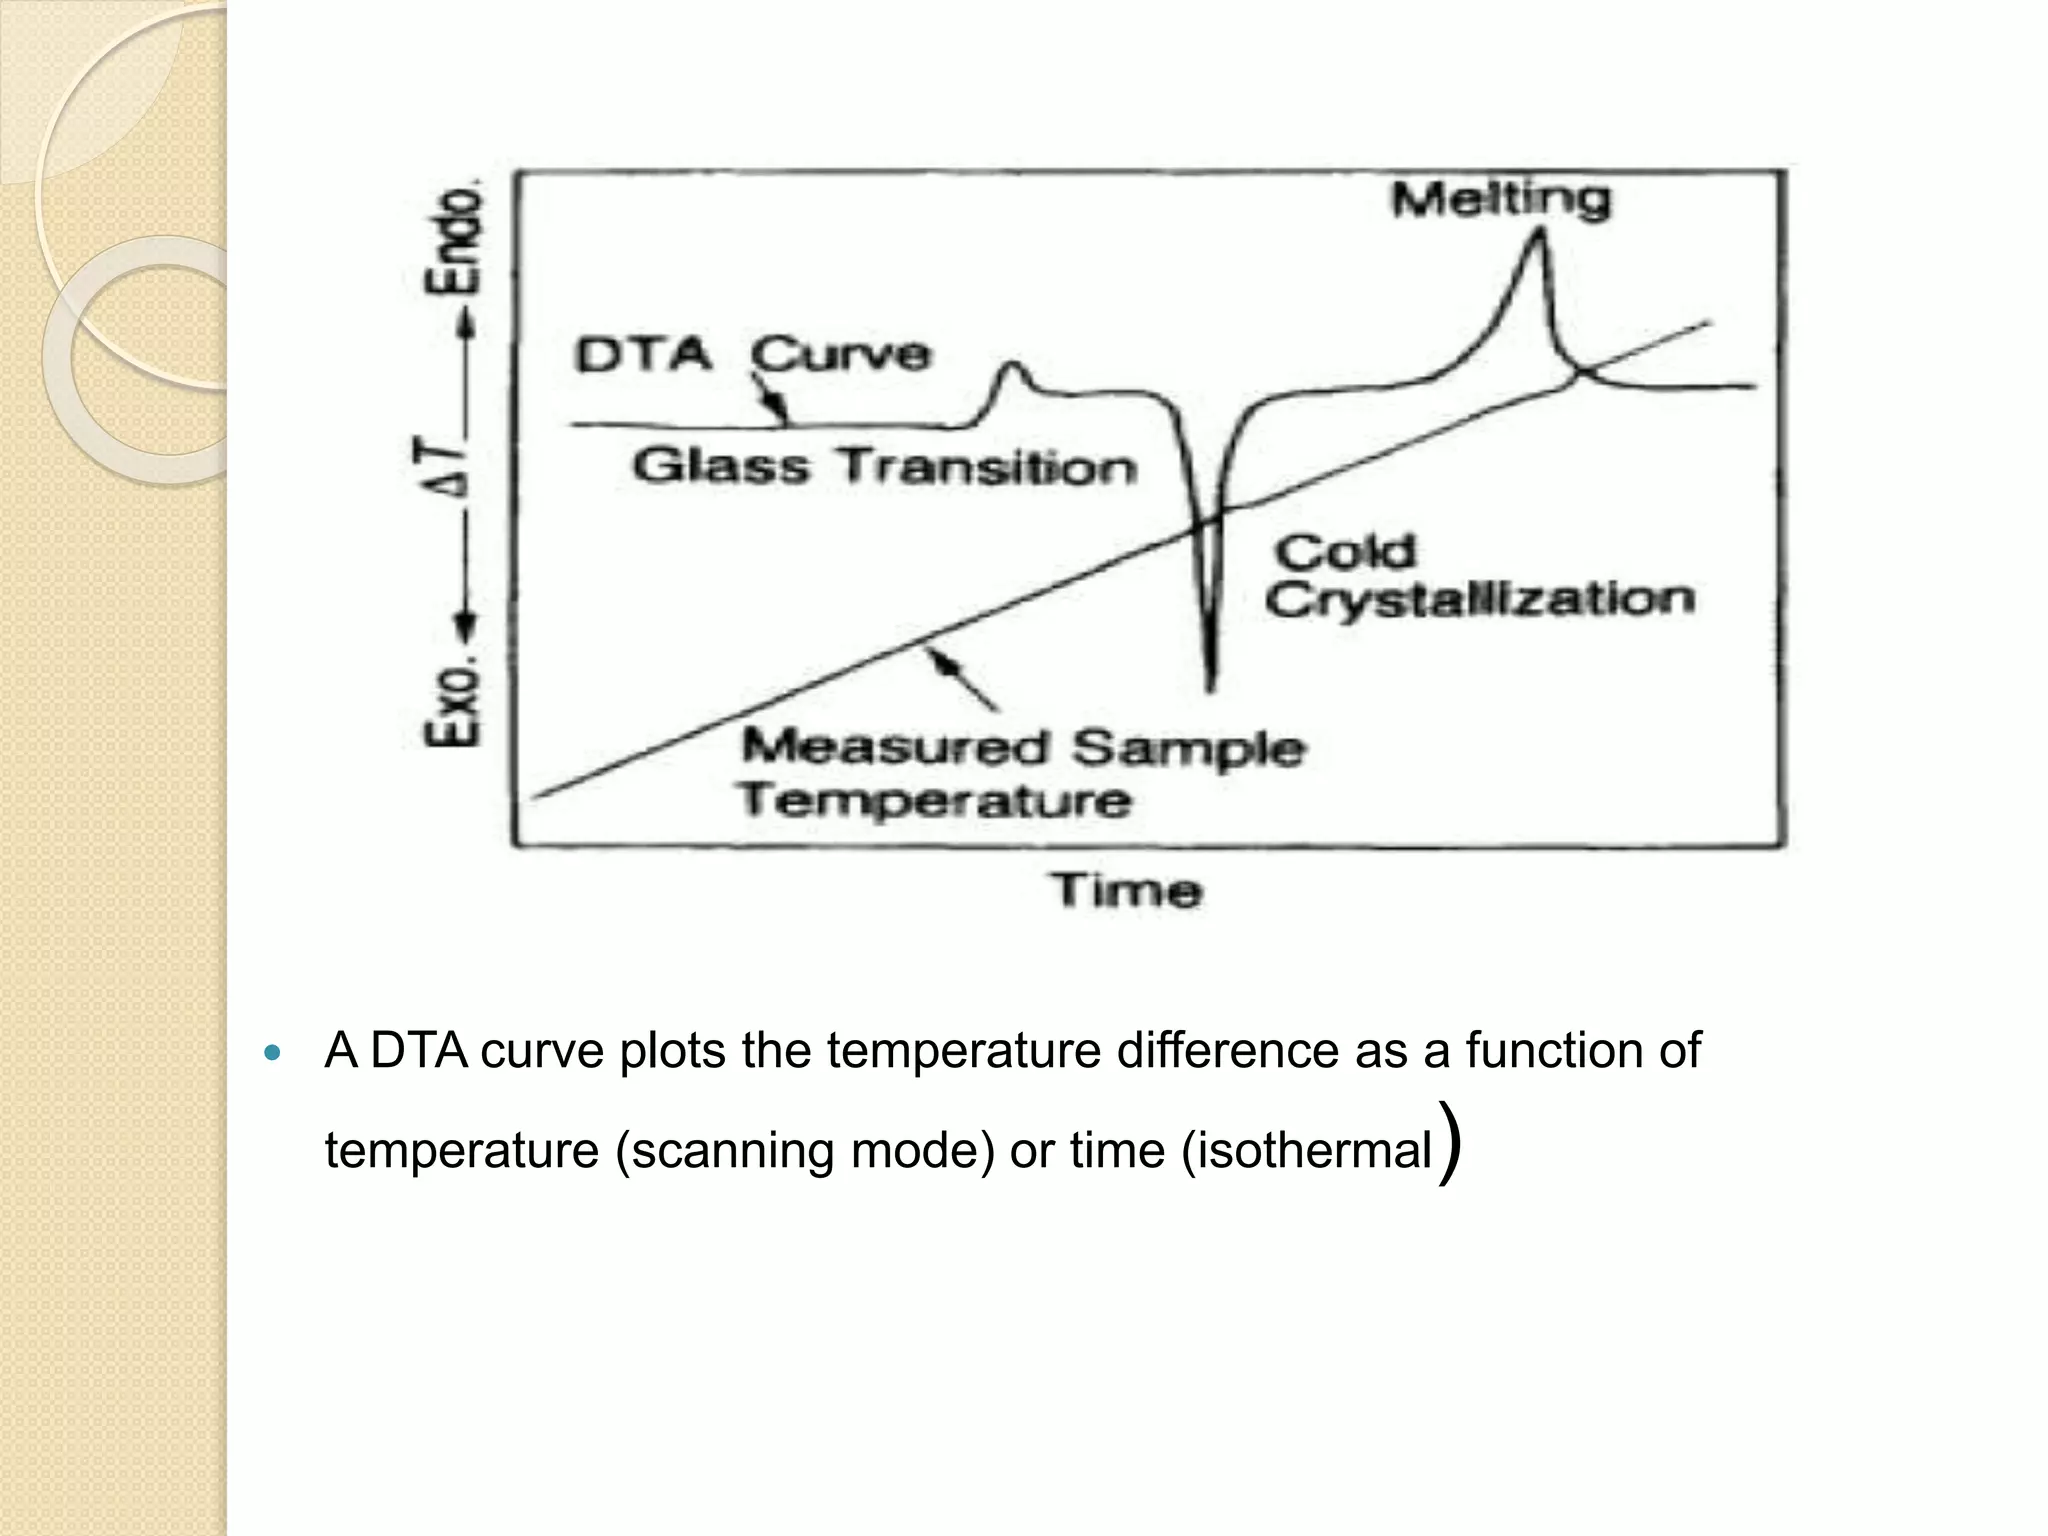
This document discusses thermal characterization techniques for polymers. It provides an overview of polymer morphology and different thermal characterization methods including DSC, DTA, TGA, and TMA. These techniques are used to measure properties like glass transition temperature, melting point, heat capacity, and thermal decomposition. The document also defines important thermal concepts and terms and provides examples of applications of these characterization methods for polymers.
Brief intro about crystalline and amorphous structures,
glass transition temperature,
free volume theory of glass transition temperature,
factors effecting glass transition temperature etc.
Brief intro about crystalline and amorphous structures,
glass transition temperature,
free volume theory of glass transition temperature,
factors effecting glass transition temperature etc.
A polymer is a large molecule, or macromolecule, composed of many
repeated subunits. The structure of a polymer is defined in terms of
crystallinity. This might also be thought of as the degree of order or regularity
in how the molecules are packed together. A well-ordered polymer is
considered crystalline. The opposite is an amorphous polymer. Almost
all amorphous polymers possess a temperature boundary. Above this
temperature the substance remains soft, rubbery and flexible, and below
this temperature it becomes hard, glassy and brittle.
The temperature, below which a polymer is hard and above which
it is soft is called the glass transition temperature.
For example:-
When an ordinary natural rubber ball if cooled below -70oC becomes so
hard and brittle that it will break into several pieces like a glass ball falling on a
hard surface.
This happens because there is a temperature boundary for amorphous.
The transition from the rubber to the glass-like state is an important feature of
polymer behavior, marking as it does a region where dramatic changes in the
physical properties, such as hardness and elasticity, are observed.
The hard, glassy, brittle state is known as the glassy state and the soft,
rubbery, flexible state is the rubbery or viscoelastic state. The glass transition
temperature is denoted by Tg.
Tf is another term for temperature, when a polymer is heated further, it forms
a viscous liquid and starts flowing, this state is known as viscous-fluid state
and the temperature is termed as flow temperature (Tf).
Tg is an important characteristic property of any polymer as it has an
important bearing on the potential application of a polymer.
Differential Thermal Analysis (DTA),principle of DTA, working of DTA, instrumentation of DTA, thermogram factors affecting DTA curve, advantages and disadvantages, applications of DTA, Thermogravimetry (TG),types of TG, principle of TG, working of TG, instrumentation of TG, thermogram of TG, factors affecting TG curve, advantages and disadvantages, applications of TG
For analytical students
Differential thermal analysis is a technique through which we can measure the change in temperature as a function of time or temperature
you can surely get concept of this technique along with the applications of this technique
In DSC the heat flow is measured and plotted against temperature of furnace or time to get a thermo gram. This is the basis of Differential Scanning Calorimetry (DSC).
The deviation observed above the base (zero) line is called exothermic transition and below is called endothermic transition.
Introduction
Why do we need plasticizers?
Mechanism of action of plasticizers
Properties of plasticizers
Classification of plasticizers
Selection of plasticizers
Effect of plasticizer on permeability of film.
Effect of plasticizer on mechanical properties of film.
Effect on residual internal stress.
Effect of plasticizers on release rates of drug.
Texture of plasticized films.
Limitations.
Conclusion.
Differential Scanning Calorimetry (DSC) is one of the important thermal analytical techniques in which specific physical properties of a material are measures as a function of temperature. It is used both in qualitative and quantitative analysis.
DSC is a technique for measuring the energy necessary to establish a nearly zero temperature difference between a substance and an inert reference material as the two specimens are subjected to identical temperature regimens in an environment heated or cooled at a controlled rate.
This technique was developed by E.S.Watson and M.J.O' Neill in 1964.
The device used to measure this is Calorimeter.
There are two types of DSC systems commonly used:
1. Power compensated DSC
2. Heat -flux DSC
A High resolution of PC-DSC is nowadays widely used known as Hyper DSC.
Seminar of U.V. Spectroscopy by SAMIR PANDASAMIR PANDA
Spectroscopy is a branch of science dealing the study of interaction of electromagnetic radiation with matter.
Ultraviolet-visible spectroscopy refers to absorption spectroscopy or reflect spectroscopy in the UV-VIS spectral region.
Ultraviolet-visible spectroscopy is an analytical method that can measure the amount of light received by the analyte.
Richard's aventures in two entangled wonderlandsRichard Gill
Since the loophole-free Bell experiments of 2020 and the Nobel prizes in physics of 2022, critics of Bell's work have retreated to the fortress of super-determinism. Now, super-determinism is a derogatory word - it just means "determinism". Palmer, Hance and Hossenfelder argue that quantum mechanics and determinism are not incompatible, using a sophisticated mathematical construction based on a subtle thinning of allowed states and measurements in quantum mechanics, such that what is left appears to make Bell's argument fail, without altering the empirical predictions of quantum mechanics. I think however that it is a smoke screen, and the slogan "lost in math" comes to my mind. I will discuss some other recent disproofs of Bell's theorem using the language of causality based on causal graphs. Causal thinking is also central to law and justice. I will mention surprising connections to my work on serial killer nurse cases, in particular the Dutch case of Lucia de Berk and the current UK case of Lucy Letby.
THE IMPORTANCE OF MARTIAN ATMOSPHERE SAMPLE RETURN.Sérgio Sacani
The return of a sample of near-surface atmosphere from Mars would facilitate answers to several first-order science questions surrounding the formation and evolution of the planet. One of the important aspects of terrestrial planet formation in general is the role that primary atmospheres played in influencing the chemistry and structure of the planets and their antecedents. Studies of the martian atmosphere can be used to investigate the role of a primary atmosphere in its history. Atmosphere samples would also inform our understanding of the near-surface chemistry of the planet, and ultimately the prospects for life. High-precision isotopic analyses of constituent gases are needed to address these questions, requiring that the analyses are made on returned samples rather than in situ.
Earliest Galaxies in the JADES Origins Field: Luminosity Function and Cosmic ...Sérgio Sacani
We characterize the earliest galaxy population in the JADES Origins Field (JOF), the deepest
imaging field observed with JWST. We make use of the ancillary Hubble optical images (5 filters
spanning 0.4−0.9µm) and novel JWST images with 14 filters spanning 0.8−5µm, including 7 mediumband filters, and reaching total exposure times of up to 46 hours per filter. We combine all our data
at > 2.3µm to construct an ultradeep image, reaching as deep as ≈ 31.4 AB mag in the stack and
30.3-31.0 AB mag (5σ, r = 0.1” circular aperture) in individual filters. We measure photometric
redshifts and use robust selection criteria to identify a sample of eight galaxy candidates at redshifts
z = 11.5 − 15. These objects show compact half-light radii of R1/2 ∼ 50 − 200pc, stellar masses of
M⋆ ∼ 107−108M⊙, and star-formation rates of SFR ∼ 0.1−1 M⊙ yr−1
. Our search finds no candidates
at 15 < z < 20, placing upper limits at these redshifts. We develop a forward modeling approach to
infer the properties of the evolving luminosity function without binning in redshift or luminosity that
marginalizes over the photometric redshift uncertainty of our candidate galaxies and incorporates the
impact of non-detections. We find a z = 12 luminosity function in good agreement with prior results,
and that the luminosity function normalization and UV luminosity density decline by a factor of ∼ 2.5
from z = 12 to z = 14. We discuss the possible implications of our results in the context of theoretical
models for evolution of the dark matter halo mass function.
The increased availability of biomedical data, particularly in the public domain, offers the opportunity to better understand human health and to develop effective therapeutics for a wide range of unmet medical needs. However, data scientists remain stymied by the fact that data remain hard to find and to productively reuse because data and their metadata i) are wholly inaccessible, ii) are in non-standard or incompatible representations, iii) do not conform to community standards, and iv) have unclear or highly restricted terms and conditions that preclude legitimate reuse. These limitations require a rethink on data can be made machine and AI-ready - the key motivation behind the FAIR Guiding Principles. Concurrently, while recent efforts have explored the use of deep learning to fuse disparate data into predictive models for a wide range of biomedical applications, these models often fail even when the correct answer is already known, and fail to explain individual predictions in terms that data scientists can appreciate. These limitations suggest that new methods to produce practical artificial intelligence are still needed.
In this talk, I will discuss our work in (1) building an integrative knowledge infrastructure to prepare FAIR and "AI-ready" data and services along with (2) neurosymbolic AI methods to improve the quality of predictions and to generate plausible explanations. Attention is given to standards, platforms, and methods to wrangle knowledge into simple, but effective semantic and latent representations, and to make these available into standards-compliant and discoverable interfaces that can be used in model building, validation, and explanation. Our work, and those of others in the field, creates a baseline for building trustworthy and easy to deploy AI models in biomedicine.
Bio
Dr. Michel Dumontier is the Distinguished Professor of Data Science at Maastricht University, founder and executive director of the Institute of Data Science, and co-founder of the FAIR (Findable, Accessible, Interoperable and Reusable) data principles. His research explores socio-technological approaches for responsible discovery science, which includes collaborative multi-modal knowledge graphs, privacy-preserving distributed data mining, and AI methods for drug discovery and personalized medicine. His work is supported through the Dutch National Research Agenda, the Netherlands Organisation for Scientific Research, Horizon Europe, the European Open Science Cloud, the US National Institutes of Health, and a Marie-Curie Innovative Training Network. He is the editor-in-chief for the journal Data Science and is internationally recognized for his contributions in bioinformatics, biomedical informatics, and semantic technologies including ontologies and linked data.
2. Content
Polymer characterization technique.
General terms of Thermodynamics.
Thermal behavior of
polymers(Tg,Tm,Tc).
Technique of Thermal characterization
DSC,
DTA,TGA,TMA.
Reference.
3. POLYMER AND POLYMER
MORPHOLOGY
Polymers are large macromolecules consisting of
repeating structural units.
The morphology of most polymers is semi-
crystalline. That is, they form mixtures of small
crystals and amorphous material and melt over a
range of temperature instead of at a single melting
point.
Thermoplasts : Polymers soften when heated and
harden when cooled.
Thermosets: These polymers become
permanently hard when cooled. They do not soften
during subsequent heating.
5. Thermal Analysis/ Characterization
The term thermal analysis (TA) is
frequently used to describe analytical
experimental techniques which investigate
the behaviour of a sample as a function of
temperature.
IUPAC definition - a group of techniques in
which a physical property is measured as
a function of temperature, while the
sample is subjected to a controlled
temperature programme.
7. General terms of Thermodynamics
Temperature : it is the average kinetic energy of
the atoms or molecules of the system.
Heat : Heat is a form of energy, which in
spontaneous processes flows from a higher -
temperature body to a lower - temperature body.
heat flow can be defined as a process in which
two thermodynamic systems exchange energy. The
flow of heat continues until the temperature of the
two systems or bodies becomes equal. This state
is called thermal equilibrium
There are three major forms of heat flow:
conduction, convection, and thermal radiation
8. Latent Heat :The latent ( “ hidden ” ) heat is the
amount of heat absorbed or emitted by a material
during a phase transition. the current term is the
heat of transition
Enthalpy: Enthalpy is the measurement of energy
in a thermodynamic system. The quantity of
enthalpy equals to the total content of heat of a
system,
H ≡ U + pV
H is the enthalpy SI unit Joule.
Entropy : The measure of the level of disorder in a
closed but changing system, a system in which
energy can only be transferred in one direction
from an ordered state to a disordered state
9. Heat Capacity : Heat capacity indicates how much
heat is needed to increase the sample temperature
by 1°C. The heat capacity of a unit mass of a
material is called specific heat capacity . The SI
units for heat capacity are J/(K · mol) or J/(K · kg).
10. Crystallisation Temperature :( Tc)
When polymers fall into these crystalline
arrangements, they give off heat to the system, thus
the process is exothermic. In fact the heat flow drops
as one can note from the big dip in the plot of (q/t) vs.
T
11. Glass Transition Temperature:
A glass transition temperature (Tg) is the temperature
above which material changes from a hard and
relatively brittle "glassy" state into a viscous or
rubbery state as the temperature is increased. Each
polymer with an amorphous structure has its own
unique glass transition temperature.
12. Melting Point : The melting point ( Tm ) is the
temperature at which a crystalline solid changes to
an isotropic liquid. Upon melting the polymers
absorb heat, thus melting is an endothermic
transition. From a DSC curve the melting point of a
low molecular mass, high - purity substance can be
determined as the point of intersection of the
leading edge of the melting peak with the
extrapolated baseline.
This determination of the melting point is not
suitable for low - molecular - mass substances of
13. Differential Scanning Calorimetry
Differential scanning calorimetry or DSC is
a thermoanalytical technique in which the
difference in the amount of heat required to
increase the temperature of a sample and
reference is measured as a function of temperature
These measurements provide quantitative and
qualitative information about physical and chemical
changes that involve endothermic or exothermic
processes, or changes in heat capacity.
14. Involves general measurement of heat flow in and
out of the system i.e. endothermic and exothermic
reaction.
Endothermic reaction on a DSC occurs from:
1. Melting
2. Glass transitions
3. Decompositions (rarely)
Exothermic reaction measured by DSC is
indicative of:
1. Condensation
2. Molecular reorganizations like crystallization.
15. Types of DSC:
HEAT FLUX DSC :
Here the difference in heat
flow into the sample and
reference is measured while
the sample temperature is
changed at a constant rate. More popular, more stable
baseline.
The sample and reference are enclosed
in the same furnace
The difference in energy required to maintain
them at a nearly identical temperature is provided
by the heat changes in the sample
16. Power compensating DSC
•Each sample has own
heater.
•Temperature of samples
controlled independently.
• Less power required
with endotherm Sample.
• In this the power needed to maintain the sample
temperature equal to the reference temperature is
measured. It has lower sensitivity but response time is
more and high resolution.
17. Instrumentation:
Heat is transferred through the discs and up into
the material through pans.
The differential heat into the two pans is directly
proportional to the difference in the outputs of the
two thermocouple junctions.
The sample temperature is measured by the
chromel and alumel junction under the sample
18.
19. Reference Material
Reference should have same physical
properties as sample
Reference should not have any
transformations during heating
Commonly used, SiC, Al2O3, empty
crucible
20. The Heat capacity (Cp) of the system is the quantity of
heat required to raise the temperature of the system by
1°C. Units Joules /°C.
Cp = q/ ΔT
Heat flux is given by:
ΔH = Cp ΔT
(or)
dH/dt = Cp dT/dt + f(T,t)
where:
Cp = specific heat capacity (J/K/mol)
T = temperature (°C)
H = Enthalpy (J /mol)
dH/dt = heat flow (J/min.)
dT/dt = heating rate (°C/min.)
f(T,t) = Kinetic response of the sample ( J/mol)
DSC : HEAT CAPACITY MEASUREMENT
21. APPLICATIONS:
Inorganic materials, salts and complexes has
been measured to study their physical properties,
chemical changes and qualitative thermal
behavior .
One special use of DSC for physical changes is
the determination of purity.
Quantitative applications include determination of
heats of fusion, crystallisation of materials.
Glass transition temperatures and melting points
are useful for qualitative estimation of materials,
although thermal methods alone cannot be used
for identification.
22. In this DSC profile, exothermic heat flow is
measured versus temperature.
25. Tg ( glass transition temperature):
Seen in an amorphous material.
No latent heat associated with it, and such
transitions are referred to as second order
transitions.
All amorphous polymers undergo a change from
glassy state to rubbery state and vice versa at
certain temperature.
Characteristic for each polymer.
Glassy plastics, Tg > RT
Rubbery material, Tg < RT
Ex. Tg for polystyrene= 373K
Tg for polyvinyl alcohol= 358K
26. Variants of DSC
Conventional – linear temperature (cooling,
heating)
programme
Fast scan DSC – very fast scan rates (also linear)
MTDSC (modulated temperature DSC) –more
complex temperature programmes, particularly
useful in the investigation of glass transitions
(amorphous materials)
HPDSC (high pressure DSC) – stability of
materials,
oxidation processes
27. DIFFERENTIAL THERMAL
ANALYSIS (DTA)
Differential Thermal Analysis (DTA) measures the
temperatures and temperature differences
(between sample and reference) associated with
transitions in materials as a function of time and
temperature in a controlled atmosphere.
This differential temperature is then plotted against
time, or against temperature (DTA curve
or thermogram).
Changes in the sample, either exothermic or
endothermic, can be detected relative to the inert
reference.
A DTA curve provides data on the transformations
that have occurred, such as glass transitions,
crystallization, melting and sublimation.
28.
29. The temperature difference is finite only when:
1. Heat is evolved or absorbed due to exothermic or
endothermic activity in the sample or
2. Heat capacity of the sample is changing abruptly.
Temperature difference is directly proportional to
the heat capacity, hence curves resemble specific
heat curves, but are inverted:
Heat evolution is registered as an upward peak
Heat absorption as a downward peak
30.
31. A DTA consists of a sample holder comprising
thermocouples, sample containers and a ceramic
or metallic block; a furnace; a temperature
programmer; and a recording system.
The key feature is the existence of two
thermocouples connected to a voltmeter. One
thermocouple is placed in an inert material such
as Al2O3, while the other is placed in a sample of
the material under study.
32.
33. A DTA curve plots the temperature difference as a function of
temperature (scanning mode) or time (isothermal)
34. DTA : Applications
In the study of polymeric materials:
1. Physical changes and thermal
transitions
2. Chemical reactions like:
dehydration,
degradation and curing, etc.
35. THERMOGRAVIMETRIC
ANALYSIS (TGA)
Changes in weight with temperature are measured.
Mostly solid samples are used.
Ideal sample: small, powdered and evenly spread
in crucible (usually platinum pan).
The sample is kept in definite environment and
changes in temperature are tuned to
preprogrammed rate.
Initial sample range: 7-8 to 10-11mg.
36. General considerations
Suitable samples for TG are solids that undergo
one of the two general types of reaction:
Processes occuring without change in mass (e.g.,
the melting of a sample) obviously cannot be
studied by TG.
Reactant(s) Product(s)+Gas (a mass
loss)
Gas+Reactant(s) Product(s) (a mass
gain)
38. 1. The electro balance and its controller
2. The furnace and temperature sensor
3. The programmer or a computer
4. Data acquisition device/ recorder/ plotter
A sensitive vacuum reading balance with sensitivity
of 0.1 μm is used to follow the weight change.
Sample weight is recorded under pressure of 10-4
mm to 1 atm.
Now a days, coupled with IR or MS to measure
chemical nature of the evolved gases being lost
from sample.
Instrumentation
39. • The sample is placed in a small electrically heated oven
with a thermocouple to accurately measure the
temperature.
• The atmosphere may be purged with an inert gas to
prevent oxidation or other undesired reactions.
40. The environment of furnace can be changed as
desired.
Ex. Air, nitrogen, inert atmosphere of Ar, etc. with use
of gas inlet and outlet chutes.
Dynamic and static modes can be applied.
Results represented as TG curves, variation of the
apparent mass of sample Vs. temperature is
plotted.
Mass generally represented as: mass loss
𝑊𝑜 − 𝑊𝑡
Where, Wo = initial mass
Wt = mass at a given temperature
Typical plots are usually of one/two/three or even
multi-step uturned S type of curves.
41. In order to ascertain steps in TGA traces, the
derivative thermogravimetric (DTG) curves are
frequently constructed.
DTG curve is represented by:
Rate of mass change per pre-selected
temperature interval, dm/dt Vs. temperature
DTG curve has well defined peaks superimposing
on rapid fall in the mass loss as observed in TGA
curve.
43. Ti :
Lowest
temperature at
which the onset of
a mass change can
be detected
Tf :
Lowest temperature
by which the
process responsible
for the mass change
has been completed
44. Thermogravimetric analysis (TGA): Uses
Typical applications include:
1. Pharmaceutical engineering research & in
industrial quality control.
2. Assessment of thermal stability.
3. Assessment of decomposition temperature.
4. Extent of cure in condensation polymers.
5. Composition and some information on sequence
distribution in copolymers.
6. Composition of filled polymers.
7. Used for drug stability studies and the kinetics of
decomposition.
45. Thermomechanical Analysis (TMA)
Measurement of mechanical response of a polymer
system as temperature is changed.
These responses include:
1. expansion and extension of materials or
2. changes in viscoelastic properties and heat
distortions, such as shrinking.
The temperature range used is: -1500C to 7000C.
46. Instrumentation:
1. Probe assembly(generally quartz glass)
2. Furnace
3. Recorder(LVDT)
4. Thermocouple
The furnace, containing the sample and probe,
controls the temperature.
Any motion due to expansion, melting, or other
physical change(in test sample) delivers an electric
signal to a recorder.
47.
48. Uses:
Measurement of:
1. Penetration or heat deflection
2. Torsion modulus
3. Stress-strain behavior
Mechanical and Viscoelastic properties of hair and
stratum corneum of the skin (Humphries et al.)
To look at polymer films and coatings used in
pharmaceutical processes.
49. Reference:
Hatakeyama T., Quinn F.X., Thermal Analysis
Fundamentals and Applications to Polymer
Science,
Second Edition, John Wiley & Sons Ltd. , 1999.
JOSEPH D. MENCZEL, R. BRUCE PRIME,
THERMAL ANALYSIS OF POLYMERS
Fundamentals and Applications, A JOHN WILEY &
SONS, INC., PUBLICATION ,2009.
H. K. D. H. Bhadeshia, Differential Scanning
Calorimetry, University of Cambridge, Materials
Science & Metallurgy.
50. RESEARCH PAPER
Characterization of Cellulose Acetate
Phthalate (CAP)
P. Roxin, Anders Karlsson, Satish K. Singh
Dept. of Pharmaceutical Analytical Chemistry,
Pharmacia and Upjohn AB, S-751 82 Uppsala,
Sweden.
Drug Development and Industrial Pharmacy,
24(1 I), Page .1025-1041 (1998).
www.dekker.com
Copyright 1998 by Marcel Dekker, Inc.
51. ABSTRACT
Cellulose acetate phthalate (CAP) is a commonly
used enteric coating polymer.
CAP powder has been studied by various methods
to determine characteristics that have an influence
on its functionality.
Other characteristics, such as the molecular mass
distribution, have not been reported earlier.
Fourier transform infrared spectroscopy (FTIR),
nuclear magnetic resonance (NMR), and thermal
analysis have also been performed on fresh
samples, as well as samples stored under various
temperature und humidity conditions
52. INTRODUCTION
Cellulose acetate phthalate is a commonly used
tablet coating material employed to produce so-
called enteric films, which resist prolonged contact
with the strongly acidic gastric fluid, but soften,
swell, and finally dissolve in the mildly acidic or
neutral intestinal environment.
In this work, they report an examination of some of
the polymer characteristics, including the effect of
storage. While a number of these characteristics
have been studied earlier, others (such as the
molecular mass distribution) have not been
reported.
new methods have also been developed to enable
a more rapid examination of these characteristics
than that allowed by the pharmacopoeia methods,
for instance.
53. Materials and Methods
CAP was obtained from Eastman Chemical
Company
Sr.No. Batch No.
1) 50103
2) 50105
3) 50106
4) 40706
5) 50104
54. Methods
Thermo gravimetric Analysis:
Mettler TA4000 system using
a TGA5O analyzer.
Mass of sample : 20mg
Sample Pan: Al2O3 crucibles.
heating rate : 5°C/min
temperature interval : 50°C-600°C.
Nitrogen atmosphere was used in the
temperature range 50°C-600°C, and
oxygen was used over 500°C.
55. DSC
CAP powder samples were subject to
differential scanning calorimetry (DSC)
on a Mettler TA4000 system using a
DSC30 analyser. Sample masses of
approximately 10mg were placed in
aluminium pans with crimped lids and
also lids with pinholes. The scanning rate
was 10°C/min over the range 50°C-
300°C. Nitrogen flow rate was 50ml/min.
56.
57.
58. Results and discussion:
CAP samples were analysed by TGA to obtain separated
vaporization and thermal degradation steps, such that absolute
values of water content, degree of substituents measured in acetic
and phthalic acid, and pyrolysis products were know. A TGA
thermogram is shown in next slide for a fresh CAP sample Batch
no.40706.
DSC was used to measure the glass transition temperature Tg of
the CAP powders. A typical thermogram is shown in next slide, in
which both water loss and glass transition phenomena are clearly
visible.
Batch No. Tg ("C)
50103 174
50105 173
50106 172
40706 172
50104 172
59. On examining the storage data in Table , it is seen
that only the storage at the most severe conditions (40°C
65.6 mbar 89% RH) seems to have any measurable
effect on this parameter. From the analysis of total acetic
and phthalic content above, we know that, under this storage
condition, CAP loses a large fraction of substituents
in 15 weeks, so we are essentially measuring a different
polymeric material along with free acetic and phthalic
acids serving as plasticizers.
60. Cellulose acetate phthalate powder has been
studied
by various methods. New methods have been
developed to examine free-acid content,
substituent composition, and molecular mass
distribution; FTIR, NMR, and thermal analysis have
also been performed on fresh samples, as well as
samples stored under various temperature and
humidity conditions.
Glass transition temperatures of CAP samples
were
measured. However, this characteristic of the
polymer is
judged not to be as sensitive to the loss of
substituents
Conclusion