Download as PDF, PPTX

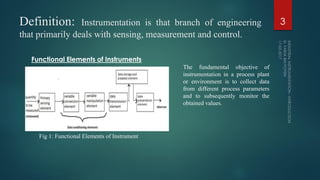
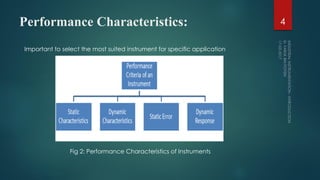
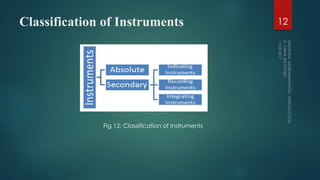
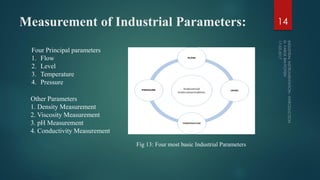


The document provides a comprehensive introduction to industrial instrumentation, covering fundamental concepts such as functional elements, performance characteristics, statistical analysis, and measurement standards. It details various industrial parameters essential for monitoring and control, including flow, level, temperature, and pressure, and elaborates on process control systems and instrumentation classifications. Additionally, it discusses the significance of signal conditioning and the roles of different types of switches in control applications.


![Lesson[1].pdf process and instrumentation notes](https://cdn.slidesharecdn.com/ss_thumbnails/lesson1-240610173012-2b12f7a8-thumbnail.jpg?width=640&height=640&fit=bounds)