1. Introduction toInstrumentationinOil and Gas
Overviewofinstrumentationand
controlsystems
Explain the key components and functions of
instrumentation and control systems used in
oil and gas facilities.
Roleof instrumentationin oil and
gasproductionandprocessing
Discuss how instrumentation supports critical
operations, such as monitoring, control, and
optimization of oil and gas processes.
Basicterminologyandconcepts
Introduce fundamental terms and concepts
related to instrumentation, such as sensors,
transmitters, signals, and control loops.
4.
Overview of instrumentationandcontrol systems
Instrumentation in the oil and gas serves as the nervous system of process plants,
ensuring operations remain within defined parameters to produce materials of
consistent quality and meet required specifications. It plays a critical role in
maintaining safe operating conditions by detecting out-of-tolerance operations and
initiating automatic shutdowns to prevent hazardous events.
The instrumentation system comprises various components including sensor
elements, signal transmitters, controllers, indicators, alarms, actuated valves, logic
circuits, and operator interfaces. These components work together in a coordinated
manner to provide real-time monitoring and automated control across upstream,
midstream, and downstream operations.
Instrumentation is present throughout all phases of the oil and gas lifecycle—from
exploration and production (upstream) through transportation and processing
(midstream), to refining and distribution (downstream). Each phase requires
specialized instrumentation and qualified personnel for engineering, installation,
commissioning, and maintenance.
5.
An instrumentation systemis a combination of devices and components designed to measure,
monitor, and control physical quantities such as temperature, pressure, flow, level, speed, and many
others. These systems are essential in industrial process to ensure processes operate safely, efficiently,
and accurately.
Overview of instrumentation andcontrol systems
6.
Key Measurements Oil& Gas Plant
• GasComposition
• Pressure
• Temperature
• FlowRate
• LiquidLevel
• Density
• CalorificValue
6
7.
1. Introduction toInstrumentationinOil and Gas
Main
Components
of
an
Instrumentation
System
• Converts a physical quantity (e.g., temperature, pressure) into an
electrical signal (voltage, current, resistance).
• Example: A thermocouple converts temperature into a voltage.
1.Sensor
(Transducer):
• Processes the raw signal from the sensor to make it suitable for
further processing. Functions: amplification, filtering, isolation, and
conversion (e.g., analog to digital).
• Example: Amplifying a weak voltage signal from a sensor.
2.Signal
Conditioning Unit:
2.Signal
Conditioning Unit:
• Collects and digitizes the conditioned signals for processing and
analysis.
• Often includes analog-to-digital converters (ADC).
3.Data Acquisition
System (DAS):
• Interprets the data, applies algorithms, and makes decisions.
• Can be a microcontroller, computer, or programmable logic controller
(PLC).
4.Processing Unit:
• Shows the measured values in a human-readable form (digital
display, chart recorder, computer screen).
• Can also trigger alarms or control signals.
5.Display/Output
Unit:
• Uses the processed data to adjust the process automatically
(feedback control).
• Example: Adjusting the heating element to maintain a set
temperature.
6.Control Unit
(Optional):
8.
Maintains operations withindefined specifications through continuous
measurement and automatic adjustment of control valves, ensuring
consistent product quality and optimal performance.
Automatic shutdown systems activate when parameters exceed safe
limits, preventing equipment damage, environmental releases, and
personnel injuries through rapid response protocols.
Continuous monitoring of composition, pressure, and temperature
ensures product meets pipeline specifications and customer
equirements with 99.9% reliability.
Real-time data acquisition enables predictive maintenance,
performance optimization, and regulatory reporting with historical
trending and advanced analytics capabilities.
Overview of instrumentation andcontrol systems
9.
Instrumentation in processcontrol refers to the collection of devices and
systems used to measure, monitor, and control various parameters within
an industrial process. The data acquired by these instruments is then
used to automate processes, optimize efficiency, and ensure safety.
Overview of instrumentation andcontrol systems
10.
Role of instrumentationin oil and gas production and
processing
The primary functions of instrumentation in oil and gas operations include monitoring key
process variables such as pressure, temperature, level, flow, composition, density, vibration,
position, power, current, and voltage. These measurements provide the foundation for
process control, safety systems, and operational decision-making.
In processing facilities like oil & gas plants, instrumentation ensures product consistency,
optimizes energy usage, minimizes waste, and supports compliance with environmental
regulations.
Safety is perhaps the most critical role of instrumentation in oil and gas operations. When
parameters exceed predefined limits, instrumentation systems trigger alarms to alert
operators to potential issues. In more critical situations, these systems can initiate automatic
safety actions such as closing shutdown valves, tripping pumps or compressors, or isolating
sections of the plant to bring the facility to a safe state. This automatic response capability is
essential for preventing catastrophic events in an industry where process upsets can have
severe consequences.
11.
Basic terminology andconcepts
Measurement:The process of determining the magnitude of a physical variable (e.g.,
pressure, temperature). Accurate measurement is the first step in any control system,
as decisions can only be as good as the data upon which they are based.
Control Loop: A closed-loop system where a measured variable is compared to a
setpoint, and corrective action is taken to minimize deviation. Control loops are
fundamental to process automation and can be found throughout oil and gas facilities,
from simple flow control to complex multivariable systems.
Setpoint: The desired value of a process variable that the control system aims to
maintain. Setpoints are established based on process requirements, safety
considerations, and optimization goals.
Final Control Element: A device (typically a control valve) that implements the control
action by adjusting the process (e.g., modulating flow). The final control element is the
"muscle" of the control system, making the physical changes needed to maintain
process conditions.
12.
Transmitter: A devicethat converts a sensor's output into a standardized signal (e.g.,
4–20 mA) for transmission to a control system. Transmitters enable signals to be
transmitted over long distances without degradation and provide a common interface
for different types of sensors.
Sensor/Transducer: A sensing element that detects changes in a physical parameter
and converts it into an electrical or mechanical signal. Sensors are the "eyes and ears"
of the instrumentation system, providing the raw data needed for monitoring and
control.
Calibration: The process of adjusting an instrument to ensure it provides accurate
measurements.
Calibration: The act of comparing an instrument's output to a reference standard to
identify and correct any measurement errors.
Accuracy: The degree of closeness between a measured value and the true or
accepted standard value.
Precision: The closeness of agreement among a series of measurements of the same
quantity under the same conditions. It is a measure of the repeatability of a
measurement.
Basic terminology andconcepts
13.
Range: The regionbetween the maximum and minimum values that an instrument is
designed to measure.
Span: The algebraic difference between the upper and lower limits of the range.
Tolerance: The permissible deviation from a specified value. It defines the acceptable
error for a measurement.
As Found Data: The data recorded from an instrument before any adjustments are
made during calibration.
As Left Data: The data recorded from the instrument after adjustments have been
made. If no adjustments were needed, the "As Left" data is the same as the "As
Found" data.
Traceability: The ability to relate a measurement result to a national or international
standard through an unbroken chain of comparisons. This ensures that the
measurement is accurate and reliable.
Zero: The instrument's reading when the measured variable is at its minimum value.
Scale: The range of values that an instrument can measure, including the markings
and graduations.
Basic terminology andconcepts
Pressure Measurement
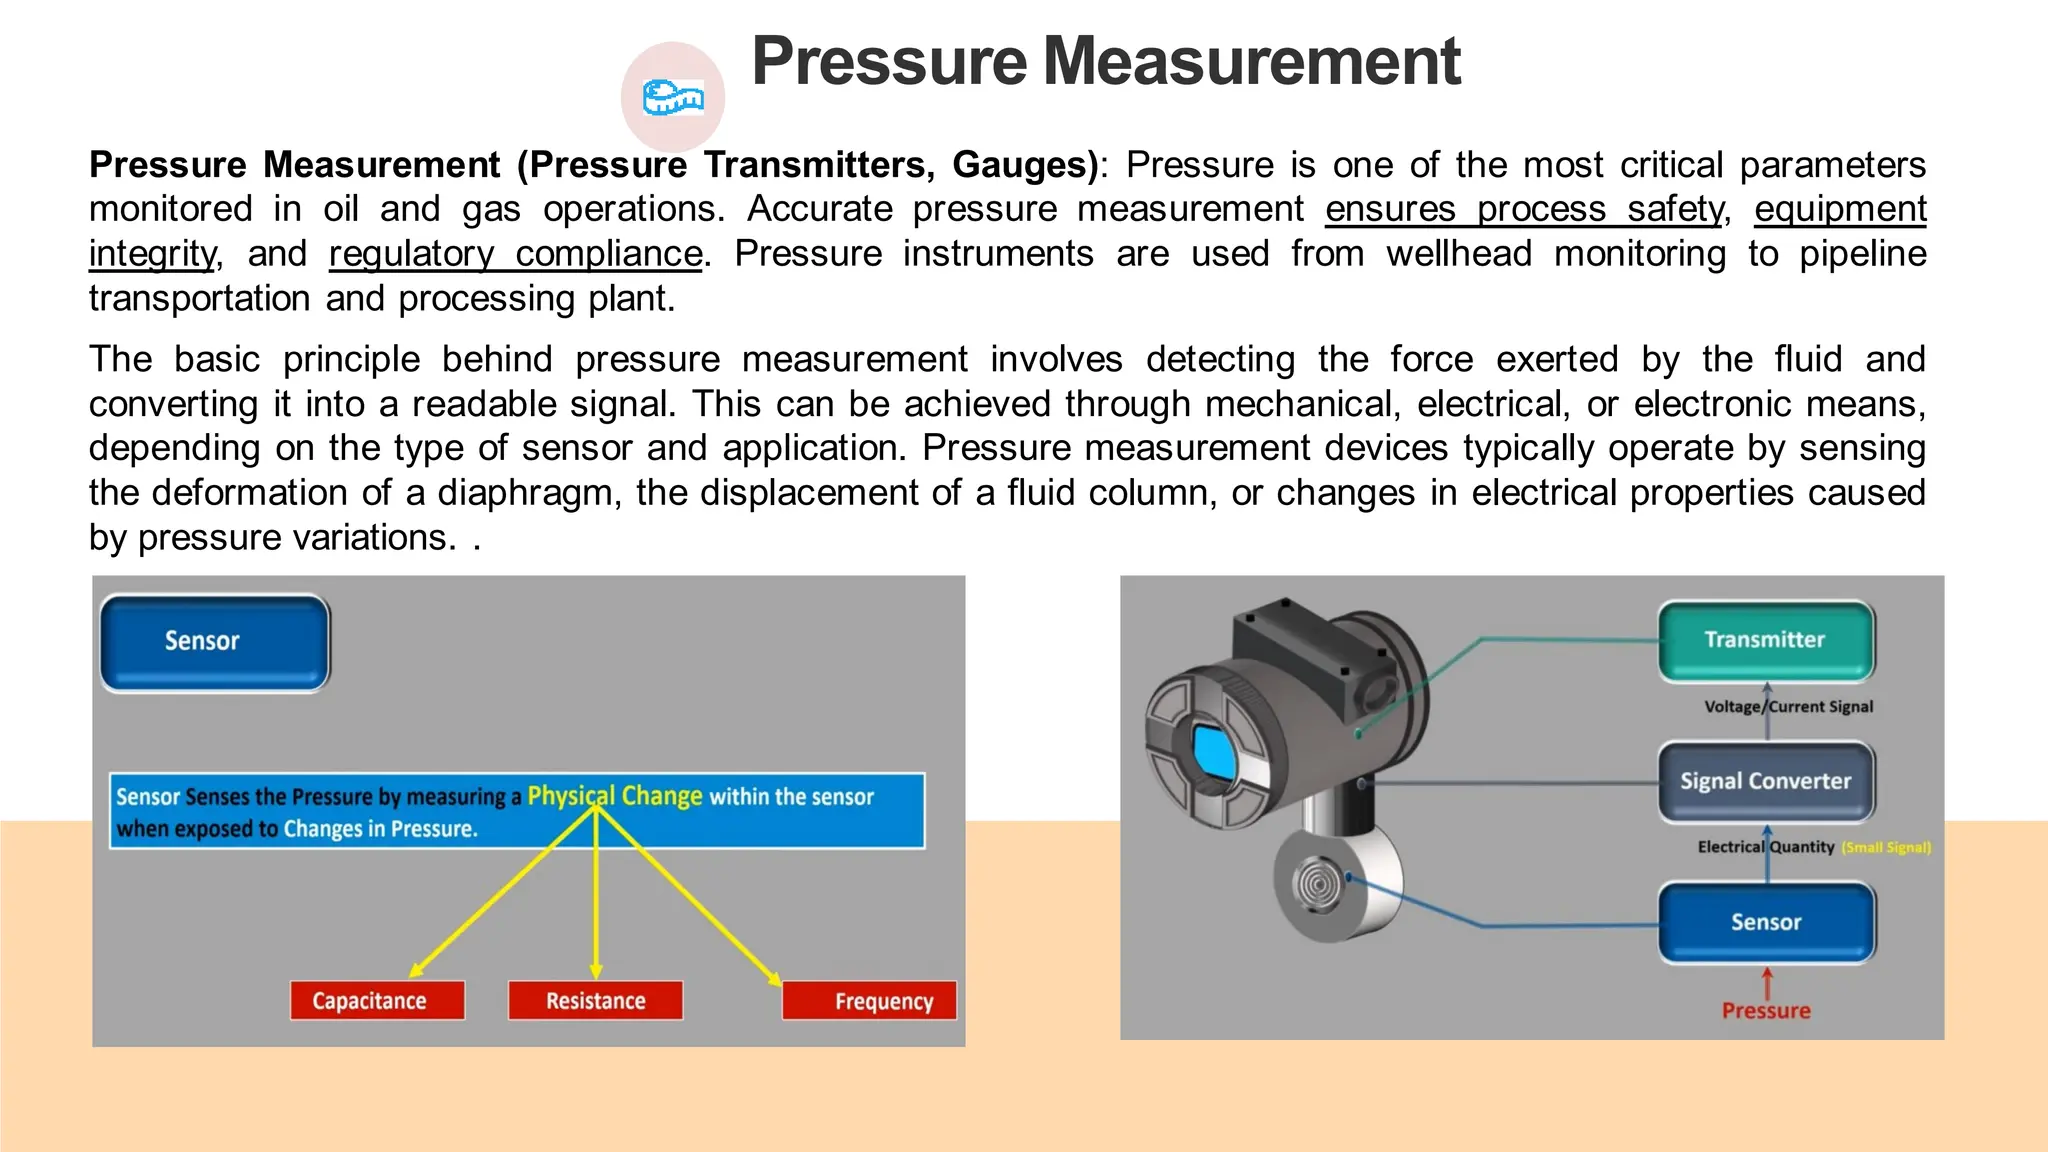
Pressure Measurement(Pressure Transmitters, Gauges): Pressure is one of the most critical parameters
monitored in oil and gas operations. Accurate pressure measurement ensures process safety, equipment
integrity, and regulatory compliance. Pressure instruments are used from wellhead monitoring to pipeline
transportation and processing plant.
The basic principle behind pressure measurement involves detecting the force exerted by the fluid and
converting it into a readable signal. This can be achieved through mechanical, electrical, or electronic means,
depending on the type of sensor and application. Pressure measurement devices typically operate by sensing
the deformation of a diaphragm, the displacement of a fluid column, or changes in electrical properties caused
by pressure variations. .
16.
Pressure measurement devicesutilize various sensor types to detect pressure changes and convert them into
electrical signals, which are then processed by a transmitter. These sensors are often integrated into pressure
transmitters, which amplify and condition the signal, providing a standardized output like the industrial 4-20 mA signal.
Sensor Types:
Strain Gauge: These sensors, often used in pressure transmitters, rely on the principle that a material's electrical
resistance changes when subjected to strain (mechanical deformation) caused by pressure.
Capacitive: These sensors measure pressure by detecting changes in capacitance between two plates, where
one plate is deflected by the pressure.
Piezoelectric: These sensors generate an electrical charge when subjected to pressure, making them suitable for
dynamic pressure measurements (rapid changes in pressure).
Resonant: These sensors utilize a vibrating element whose frequency changes with pressure, allowing for highly
accurate measurements.
Silicon-on-Sapphire (SoS): This technology combines the robustness of sapphire with the sensitivity of silicon,
resulting in highly accurate and durable sensors.
Piezoresistive: These sensors utilize the change in electrical resistance of a material when subjected to
pressure. They are widely used due to their low cost, high precision, and good linearity.
Pressure Measurement
17.
Pressure Measurement: Pressuremeasurement is critical for safety, efficiency, and process control in the oil
and gas industry. A wide variety of devices are used, from simple mechanical gauges for local readings to
sophisticated electronic transmitters that send signals to a control system.Here are the main types of
pressure measurement devices used in oil and gas plants:
1. Pressure Gauges: Pressure gauges are mechanical instruments that provide a direct, local reading of
pressure. They are essential for on-site monitoring by plant personnel.
Bourdon Tube Gauges: The most common type of mechanical pressure gauge. They use a C-
shaped, helical, or spiral tube that straightens out as pressure increases. This movement is linked
to a pointer that indicates the pressure on a dial. Bourdon tube gauges are suitable for a wide
range of pressures, including high pressures.
Diaphragm Gauges: These gauges use a flexible, corrugated diaphragm to measure pressure.
The diaphragm deflects under pressure, and this movement is converted into a reading on a dial.
Diaphragm gauges are often used for low-pressure applications and for measuring viscous or
corrosive fluids.
Bellows Gauges: Similar to diaphragm gauges, these use an expandable bellows to measure
pressure. As pressure increases, the bellows expands, and this movement is translated into a
pressure reading.
Pressure Measurement
18.
Pressure Gauges
Function:Providelocal, visual
indicationofpressure
BourdonTubeGauges DiaphragmGauges
Pressure gauges are vital instruments for monitoring the condition and performance of various
systems, enabling quick and direct assessment of pressure levels at the point of measurement.
19.
Pressure Gauges
Bourdon tubepressure gauge is a mechanical
instrument used to measure pressure by
detecting the deformation of a curved, hollow
tube. When pressure is applied, the tube tends
to straighten, and this movement is translated
into a pointer rotation on a dial, indicating the
pressure reading.
Diaphragm pressure gauge uses the deflection of a thin, flexible
membrane to measure fluid pressure in a system. Diaphragm
gauges are often more accurate than bellows gauges, especially
in low-pressure applications. The diaphragm isolates internal
components from the media, making this gauge suitable for
corrosive or contaminated liquids or gasses.
20.
Pressure Gauges
Bellows gaugeconsists of a thin-walled, metallic cylinder with deep folds or convolutions. One end is sealed, and the
other is connected to the pressure source. The sealed end moves in response to pressure changes. to straighten, and
this movement is translated into a pointer rotation on a dial, indicating the pressure reading. Bellows are generally
more sensitive to pressure changes than diaphragms and can be used for a wider range of pressures. They are also
known for their resistance to shock and vibration.
21.
2. Pressure Transmittersand Transducers: These devices convert pressure into an electrical
signal (e.g., 4-20 mA or digital signal. This process involves amplification, linearization, and
potentially temperature compensation. The transmitter then sends this signal to a control
system or display device for monitoring and control purposes.
Gauge Pressure Transmitters: These measure pressure relative to atmospheric
pressure. They are the most common type and are used in a wide array of industrial
processes.
Absolute Pressure Transmitters: These measure pressure relative to a perfect
vacuum, making them independent of atmospheric pressure changes. They are used in
applications where atmospheric pressure fluctuations would affect the measurement..
Differential Pressure (DP) Transmitters: These devices measure the difference
between two pressures. They are versatile and used to measure flow rates (by
measuring the pressure drop across an orifice plate), liquid levels in tanks (by
comparing the pressure at the top and bottom of the tank), and filter performance.
Multivariable Transmitters: These advanced devices combine pressure, temperature,
and sometimes flow measurement into a single instrument. They are used for complex
applications, such as mass flow measurement of natural gas.
Pressure Measurement
3. Diaphragm sealsare not a measurement device on their own, but they are a crucial component used with pressure gauges
and transmitters in the oil and gas industry.
Function: A diaphragm seal is a flexible membrane that isolates the pressure measuring instrument from the process
medium. The space between the diaphragm and the instrument is filled with a non-compressible fluid. When the
process fluid exerts pressure on the diaphragm, the pressure is transmitted through the fill fluid to the instrument,
which then takes the measurement.
Applications: Diaphragm seals are essential when the process fluid is corrosive, viscous, or contains suspended
solids that could clog the instrument. They also protect the instrument from extreme temperatures.
Pressure Measurement
Device Type Pressure Range Accuracy Response Time Typical Application
Bourdon Tube Pressure
Gauge
0 to 6000 psi
±1.5% full
scale
Seconds
Local pressure
indication
Electronic Pressure
Transmitter
0 to 10,000 psi
±0.1% to
±0.25%
Milliseconds
Remote monitoring
and control
Differential Pressure
Transmitter
0 to 500 psi
±0.1% to
±0.5%
Milliseconds
Flow, filter
monitoring
Piezoelectric Pressure
Sensor
Up to 20,000 psi ±0.5% Microseconds
Dynamic pressure
measurement
24.
Pressure Switches
On/Off DevicesSafetyInterlocks Alarms andControlActions
Pressure switches play a critical role in ensuring the safe and reliable
operation of industrial and commercial systems by monitoring pressure
levels and triggering necessary actions to maintain optimal conditions.
25.
Maintaining pressure withinsafe and efficient limits is critical in oil and gas operations.
Pressure control involves regulating the pressure to prevent equipment damage, ensure
process stability, and comply with safety standards. Control methods include:amplify and
condition the signal, providing a standardized output like the industrial 4-20 mA signal.
Pressure Relief Valves: Mechanical devices that automatically release pressure when it
exceeds a set limit, protecting equipment from overpressure conditions.
Control Valves: Actuated valves modulate fluid flow based on pressure feedback to
maintain desired pressure levels within pipelines and vessels.
Pressure Regulators: Devices that reduce and stabilize pressure downstream of a high-
pressure source, ensuring consistent operating conditions.
Automated Control Systems: Integration of pressure transmitters with PLCs or DCS allows
for real-time pressure monitoring and automated adjustments through control valves and
safety systems.
Pressure Control Methods
26.
Temperature Measurement: isa cornerstone of instrumentation in oil and gas plant facilities, playing a pivotal
role in process control, safety assurance, and equipment protection. Accurate temperature data is essential for
optimizing process, maintaining product quality, preventing equipment damage, and ensuring safe operating
conditions in environments that often experience extreme thermal variations.
Several temperature sensing technologies are widely employed in oil and gas plants, each with distinct
advantages, limitations, and suitability for specific applications. The most common types include thermocouples,
resistance temperature detectors (RTDs), infrared sensors, bimetallic and thermistors.
Temperature Measurement
27.
Thermocouples areamong the most prevalent temperature sensors in industrial settings
due to their wide temperature range, durability, and fast response times. They operate on
the Seebeck effect principle, where a voltage is generated at the junction of two dissimilar
metals when exposed to a temperature gradient. This voltage correlates to the
temperature difference between the measurement junction and a reference junction,
allowing temperature determination.
Thermocouples are classified by their metal combinations, such as Type K (Chromel-
Alumel), Type J (Iron-Constantan), and Type T (Copper-Constantan), each offering
different temperature ranges and sensitivities. For example, Type K thermocouples are
suitable for temperatures from -200°C to 1260°C, making them ideal for high-temperature
processes like furnace monitoring and catalytic cracking units.
Their rugged construction enables operation in harsh environments, including high
pressure, corrosive atmospheres, and vibration-prone areas common in oil and gas plants.
However, thermocouples require careful calibration and compensation for cold junction
effects to maintain accuracy.
Temperature Measurement
Thermocouples
28.
RTDs measuretemperature by correlating the resistance of a metal element, typically
platinum, to temperature changes. The resistance increases predictably with temperature,
allowing precise measurement. Platinum RTDs (Pt100 or Pt1000) are the industry
standard due to their excellent stability, repeatability, and linearity over a wide temperature
range (-200°C to 850°C). RTDs offer higher accuracy and stability than thermocouples but
generally have slower response times and are more fragile.
They are commonly used in applications requiring precise temperature control, such as
refining processes, heat exchangers, and environmental monitoring within oil and gas
facilities. RTDs are often housed in protective sheaths to shield them from mechanical
damage and corrosive substances.
Their output is typically converted to a standardized electrical signal (4-20 mA or digital
protocols) for integration with control systems.
Temperature Measurement
ResistanceTemperatureDetectors(RTDs)
29.
Infrared sensorsmeasure temperature without direct contact by
detecting the thermal radiation emitted by an object. This non-
intrusive method is invaluable for measuring moving parts,
hazardous or inaccessible areas, and surfaces where sensor
insertion is impractical.
IR sensors are widely used for monitoring equipment such as
rotating machinery, electrical panels, and flare stacks in oil and
gas plants. They provide rapid temperature readings and can be
configured for continuous monitoring or spot checks.
However, IR sensors require careful consideration of emissivity—
the efficiency with which a surface emits infrared radiation—which
varies with material and surface condition. Calibration and
environmental factors such as dust, steam, or smoke can affect
measurement accuracy.
Temperature Measurement
Infrared (IR) TemperatureSensors
30.
Thermistor isa type of temperature sensor that utilizes a semiconductor material
with a resistance that varies significantly with temperature changes. They are
commonly used for accurate and cost-effective temperature measurement in
various. They are highly sensitive and accurate within a limited temperature range
(-50°C to 150°C), making them suitable for applications like ambient temperature
monitoring and HVAC systems within plant facilities.
Thermistors are made from sintered semiconductor materials, and their resistance
changes dramatically with temperature variations. Most thermistors exhibit a
negative temperature coefficient (NTC), meaning their resistance decreases as
temperature increases. A smaller subset has a positive temperature coefficient
(PTC), where resistance increases with temperature.
Thermistors are typically made from metal oxides, such as cobalt, nickel, iron,
copper, and manganese.
High sensitivity: Thermistors offer a large change in resistance for small
temperature changes, providing good resolution. Repeatability and stability: They
are known for their reliable and consistent performance.Cost-effectiveness:
Thermistors are a relatively inexpensive option for temperature measurement.
Temperature Measurement
Thermistors
31.
Bimetallic thermometerelement is a bimetallic strip, made of
two different metals bonded together with different thermal
expansion rates. This element is crucial for temperature
sensing in bimetallic thermometers, as it bends or curls in
response to temperature changes, with the degree of
bending indicating the temperature. Bimetallic strips can be
arranged in various ways, including flat, spiral, single-helix,
and multiple-helix configurations, depending on the specific
application.
It uses a bimetallic strip made of two different metals, such
as steel and brass, which are bonded together. Because
these metals have different coefficients of thermal
expansion, they expand or contract at different rates when
exposed to a change in temperature. This unequal
expansion forces the strip to bend or curl. This mechanical
movement is then used to turn a pointer on a calibrated
scale, indicating the temperature.
Temperature Measurement
Bimetallic thermometer
32.
The following tablesummarizes typical specifications for common temperature measurement devices used in oil
and gas facilities, highlighting their operating ranges, accuracy, response times, and typical applications.
Temperature Measurement
SpecificationsandAccuracy
Sensor Type Temperature Range Accuracy Response Time
Typical
Applications
Thermocouple (Type K)-200°C to 1260°C ±1.1°C or ±0.4% <1 second
High-temperature
processes, furnaces
RTD (Pt100) -200°C to 850°C ±0.1°C to ±0.3°C 1 to 5 seconds
Refining, heat
exchangers, precise
control
Infrared Sensor -50°C to 1000°C (varies) ±1% to ±3% <0.5 seconds
Non-contact
measurement, rotating
equipment
Thermistor -50°C to 150°C ±0.1°C to ±0.5°C <1 second
Ambient monitoring,
HVAC
33.
Temperature measurementis intrinsically linked to control systems that regulate
process conditions to maintain safety, efficiency, and product quality.
In oil and gas plants, temperature control strategies involve feedback loops where
temperature sensors provide real-time data to controllers, which then adjust
actuators such as control valves, heaters, or coolers.
Programmable Logic Controllers (PLCs) and Distributed Control Systems (DCS) are
commonly employed to execute temperature control algorithms. These systems
receive sensor inputs, compare measured temperatures to set points, and modulate
control elements to maintain desired conditions. For example, in a distillation
column, temperature sensors at various trays feed data to the DCS, which adjusts
reflux rates and heat input to optimize separation efficiency.
Advanced control strategies, such as cascade control and model predictive control,
are also implemented to handle complex temperature regulation scenarios involving
multiple interacting variables. Integration with safety instrumented systems ensures
that temperature excursions beyond safe limits trigger alarms or emergency
shutdowns to prevent hazardous situations.
Temperature Measurement
TemperatureControlSystems
34.
Flow measurementis a critical component of instrumentation in oil and gas plant facilities,
essential for monitoring and controlling the movement of liquids and gases throughout the
production, processing, and transportation stages. Accurate flow measurement ensures optimal
process efficiency, product quality, safety, and regulatory compliance.
Flow refers to the quantity of fluid passing through a given cross-sectional area per unit time. It
can be expressed in terms of volumetric flow rate (e.g., cubic meters per hour) or mass flow rate
(e.g., kilograms per second). Both measurements are vital in oil and gas operations, depending
on the process requirements. Volumetric flow is often used for liquids, while mass flow is critical
when dealing with gases or multiphase fluids where density variations affect process calculations.
Flow measurement relies on detecting changes in fluid velocity, pressure, or other physical
properties as the fluid moves through a pipeline or conduit. The fundamental challenge is to
convert these physical changes into an accurate, reliable signal that reflects the true flow rate
under varying process conditions.
Oil and gas plants employ a variety of flow meter types, each with unique operating principles,
advantages, and limitations. The most widely used flow meters include differential pressure
meters, turbine meters, ultrasonic meters, and Coriolis meters.
Flow Measurement
35.
Differential pressure (DP)flow meters operate on the principle of
Bernoulli’s equation, where a constriction in the flow path causes a
pressure drop proportional to the square of the flow velocity.
Common DP meters include orifice plates, venturi tubes, and flow
nozzles. These devices create a measurable pressure differential
between upstream and downstream points, which is converted into
flow rate using calibration curves or equations.
DP flow meter introduces a restriction in the flow path, such as
an orifice plate, venturi tube, or flow nozzle.
As the fluid passes through the restriction, its velocity
increases, causing a decrease in pressure. The difference in
pressure before and after the restriction (the differential
pressure) is measured by pressure sensors. Using the
measured differential pressure and other parameters, the flow
rate is calculated using established formulas.
Differential PressureFlowMeters
Flow Measurement
36.
Key Components:.
PrimaryElement: Creates the pressure drop (e.g., orifice plate,
venturi tube, nozzles, pitot tubes, Annubars).
Secondary Element: Measures the differential pressure (e.g.,
pressure transmitter).
Tertiary Element: May include a flow computer, temperature or
pressure transmitters for more complex calculations.
Advantages:
High Accuracy and Reliability: DP flow meters are known for their
consistent and accurate measurements.
Wide Range of Applications: They can be used with liquids, gases,
and steam, in various industries.
No Moving Parts (in some designs): This reduces maintenance
requirements and improves reliability.
Suitable for High Pressure and Temperature: DP flow meters can
handle demanding conditions.
Differential PressureFlowMeters
Flow Measurement
37.
Turbine flow metersmeasure flow by detecting the rotational speed
of a turbine wheel placed in the flow stream. The rotational speed is
directly proportional to the velocity of the fluid. These meters
provide high accuracy and repeatability, especially for clean, steady
flows of liquids and gases.
Fluid flows through a pipe and impinges on the turbine blades,
causing them to rotate.
The faster the fluid flows, the faster the rotor spins.
A sensor (magnetic pickup, Hall effect sensor, etc.) detects the
rotor's rotation and generates an electrical pulse or signal for
each blade that passes. The frequency of these pulses is
directly proportional to the flow rate.
The pulses are sent to a transmitter, which converts them into a
flow rate reading (e.g., gallons per minute, liters per second).
TurbineFlow Meters
Flow Measurement
38.
Key Components:.
TurbineRotor: The rotating part of the meter, typically
made of a ferromagnetic material.
Sensor: Detects the rotor's rotation (e.g., magnetic
pickup, Hall effect sensor).
Housing: Encloses the rotor and sensor.
Straightening Vanes: Optional components that help to
stabilize the flow and ensure even distribution across
the rotor.
Advantages:
High Accuracy: Turbine flow meters can offer high
accuracy, especially when calibrated.
Wide Flow Range: They can handle a wide range of
flow rates.
Relatively Simple Design: The basic design is relatively
straightforward, making them reliable and cost-effective.
Versatility: Suitable for measuring a variety of liquids
and gases.
TurbineFlow Meters
Flow Measurement
Disadvantages:
Moving Parts: The rotor and bearings are subject to
wear and tear, requiring periodic maintenance.
Fluid Compatibility: Not suitable for all fluids, especially
those with high viscosity or particulate content.
Pressure Drop: The presence of the rotor can cause a
pressure drop in the flow.
39.
Ultrasonic flowmeter isa device that measures the flow rate of a fluid (liquid or gas) by emitting and
receiving ultrasonic waves through the fluid. It works by measuring the time it takes for the ultrasonic waves
to travel through the fluid in both upstream and downstream directions. The difference in travel time is then
used to calculate the flow velocity and, subsequently, the flow rate.
Here's a explanation:
Transducers: Ultrasonic flowmeters use transducers that act as both transmitters and receivers of
ultrasonic waves.
Transit Time Measurement: The transducers are typically mounted on the exterior of the pipe, and they
emit ultrasonic pulses into the fluid.
Upstream and Downstream: One transducer emits a pulse that travels downstream with the flow, while
the other emits a pulse that travels upstream against the flow.
Time Difference: The time it takes for the ultrasonic pulses to travel through the fluid is measured in both
directions.
Flow Velocity Calculation: The difference in transit times is directly related to the velocity of the fluid. A
faster transit time in the downstream direction indicates a higher flow velocity.
Volumetric Flow Rate: Knowing the fluid's velocity and the pipe's cross-sectional area, the flowmeter can
calculate the volumetric flow rate (e.g., gallons per minute, cubic meters per hour).
UltrasonicFlowMeters
Flow Measurement
40.
There are twomain types: transit-time and Doppler ultrasonic meters.
Transit-time flowmeters: these meters measure the time difference
between ultrasonic pulses traveling with and against the flow.
Doppler flowmeters: these meters utilize the Doppler effect, which
is a change in frequency of a wave when the source and observer
are moving relative to each other, to determine flow velocity.
Advantages of ultrasonic flowmeters:
Non-intrusive: They can be clamped onto the outside of the pipe,
eliminating the need to cut into the pipe and disrupt flow.
Wide flow range: They can measure a wide range of flow rates.
Low maintenance: They typically do not have moving parts,
reducing the need for maintenance.
Suitable for various fluids: They can be used for a variety of fluids,
including liquids and gases.
High accuracy: They can provide accurate flow measurements.
UltrasonicFlowMeters
Flow Measurement
41.
Coriolis flow metersare a type of flow meter that directly
measures mass flow rate using the Coriolis effect. They
are known for their high accuracy and ability to measure
various fluid properties like mass flow, density, and
temperature. They are widely used across various
industries for their versatility and reliability. .
Here's a explanation:
Coriolis flow meters work by passing the fluid
through a vibrating tube.
As the fluid flows through the vibrating tube, the
Coriolis effect causes a twisting or deflection of the
tube.
Sensors detect this deflection, and the magnitude of
the deflection is directly proportional to the mass
flow rate of the fluid.
Coriolis FlowMeters
Flow Measurement
42.
Key features andbenefits:
Direct mass flow measurement: Coriolis flow meters are unique in that
they directly measure mass flow rate, unlike other flow meters that may
need to calculate mass flow from other measurements.
High accuracy:They offer high accuracy in measuring mass flow rate,
making them suitable for critical applications.
Multi-variable measurement: Coriolis flow meters can also measure
fluid density and temperature in addition to mass flow.
Versatility: They can be used to measure both liquids and gases, and
they are relatively insensitive to changes in fluid properties like density
and viscosity.
Wide range of applications: They are used in various industries,
including oil and gas, chemical processing, food and beverage, and
pharmaceuticals.
Reliability and low maintenance: With no moving parts in the flow path,
they offer high reliability and low maintenance requirements.
Coriolis FlowMeters
Flow Measurement
43.
Limitations:
Higher initialcost: Coriolis flow meters can have a higher
initial purchase price compared to some other flow meter
technologies.
Pressure drop: They may introduce a higher pressure drop
in the flow line compared to some other flow meter types.
Sensitivity to vibration: Although generally robust, they can
be sensitive to external vibrations, which may affect
accuracy in some cases.
Coriolis FlowMeters
Flow Measurement
In summary, Coriolis flow meters are a reliable and accurate technology for
measuring mass flow rate and other fluid properties, making them a popular choice in
many industrial applications.
44.
Choosing the appropriateflow meter technology depends on several factors, including fluid type, flow range, accuracy
requirements, pressure and temperature conditions, installation constraints, and maintenance considerations. E.g, DP
meters are preferred for high-pressure steam lines, while Coriolis meters excel in applications requiring precise mass
flow measurement of hydrocarbons. Other considerations include the presence of particulates, fluid viscosity,
corrosiveness, and the need for non-intrusive measurement. Cost, availability of spare parts, and compatibility with
existing control systems also influence selection.
SelectionCriteria for FlowMeters
Flow Measurement
Type Principle Accuracy Operating Range Advantages Applications
Differential
Pressure
Pressure drop
across restriction
±0.5% to
±2%
Wide (liquids,
gases, steam)
Simple, robust,
cost-effective
General process
flow, steam lines
Turbine
Rotational speed of
turbine
±0.2% to
±1%
Moderate to high
flow rates
High accuracy,
good repeatability
Custody transfer,
clean fluids
Ultrasonic
Time difference of
sound pulses
±1% to
±2%
Wide (liquids,
gases)
Non-intrusive, no
pressure loss
Corrosive fluids,
large pipes
Coriolis
Coriolis force on
vibrating tube
±0.1% to
±0.2%
Wide (mass flow)
Direct mass flow,
multi-parameter
Custody transfer,
multiphase fluids
45.
Flow measurement isoften integrated with control systems to
regulate flow rates, maintain process stability, and ensure safety.
Control valves, actuated by signals from flow controllers or
distributed control systems (DCS), adjust fluid flow based on
measured values. Feedback loops enable automatic correction of
flow deviations, optimizing production and preventing
overpressure or underflow conditions..
Valves are the primary mechanism for controlling flow. They
can be categorized into various types, including:
Choke valves: These valves are used to restrict flow and
manage pressure, especially in wellheads.
Pressure-reducing valves: These valves lower the
pressure of fluids within a system.
Flow-restricting valves: These valves limit the amount
of fluid passing through a specific point.
Throttling valves: These valves can be adjusted to
control flow rate and pressure.
FlowControl
Flow Measurement
46.
Flow measurement isoften integrated with control systems to
regulate flow rates, maintain process stability, and ensure safety.
Control valves, actuated by signals from flow controllers or
distributed control systems (DCS), adjust fluid flow based on
measured values. Feedback loops enable automatic correction of
flow deviations, optimizing production and preventing
overpressure or underflow conditions..
Valves are the primary mechanism for controlling flow. They
can be categorized into various types, including:
Choke valves: These valves are used to restrict flow and
manage pressure, especially in wellheads.
Pressure-reducing valves: These valves lower the
pressure of fluids within a system.
Flow-restricting valves: These valves limit the amount
of fluid passing through a specific point.
Throttling valves: These valves can be adjusted to
control flow rate and pressure.
FlowControl
Flow Measurement
47.
In oil andgas plants, level measurement is vital for maintaining the
correct volume of fluids in storage tanks, separators, scrubbers, and
process vessels. Precise level control prevents overfilling, which can
cause spills, fires, or explosions, and underfilling, which may lead to
pump cavitation, loss of process control, or damage to downstream
equipment. For example, in separators, maintaining the correct liquid
level ensures efficient phase separation and prevents carryover of
liquids into gas lines. In storage tanks, level measurement supports
inventory management, custody transfer, and regulatory compliance.
Level control also contributes to process optimization by enabling
automated control of feed rates, discharge flows, and chemical dosing.
Integration of level measurement with control systems such as PLCs
and DCS allows real-time monitoring and automated responses to
changing process conditions, enhancing safety and operational
reliability.
Several level measurement technologies are employed in oil and gas
facilities, each suited to specific applications, fluid types, and
environmental conditions. The most common methods include float-
based, ultrasonic, radar, capacitance, and differential pressure level
measurement.
Level Measurement
48.
Level Measurement
Float levelmeasurement in oil and gas applications utilizes a buoyant float that rises and falls with the liquid level,
transmitting this information to a gauge or sensor. This method is commonly used in storage tanks, separators,
and other equipment for continuous level monitoring and point level detection. Float level measurement systems
often incorporate safety features like explosion-proof housings for hazardous environments in the oil and gas
industry.
Here's a explanation:
A float, typically made of a material with a specific gravity between the liquid and vapor, is placed in the tank.
As the liquid level changes, the float rises or falls, following the surface of the liquid.
This movement is then translated into a readable measurement, either through a mechanical linkage or an
electronic sensor.
Applications in Oil and Gas:
Continuous Level Monitoring: Float level sensors can provide real-time data on the liquid level in storage
tanks, allowing for efficient inventory management and preventing overfilling or running dry.
Separation Equipment: In separators and knockout drums, float level switches help maintain optimal liquid
levels for efficient separation of oil, water, and gas.
Point Level Detection: Float level switches can trigger alarms or control pumps and valves when the liquid
level reaches a certain point.
FloatLevelMeasurement
49.
Level Measurement
Types ofFloat Level Measurement Systems:
Mechanical Float Level Gauges: These systems use mechanical
linkages, such as cables, tapes, or pulleys, to transmit the float's position
to a visual indicator.
Magnetic Float Level Gauges: These systems use a magnet attached to
the float and a magnetic indicator outside the tank to display the level.
Float Level Transmitters: These systems use sensors, like reed switches
or magnetostrictive sensors, to convert the float's movement into an
electrical signal that can be transmitted to a control system.
Advantages:
Simplicity and Reliability: Float level measurement is a relatively simple
and reliable method, especially for continuous level monitoring.
Suitable for Hazardous Environments: Float level systems can be
designed with explosion-proof housings and materials suitable for
hazardous areas in oil and gas facilities.
Accuracy: Float level measurement can provide accurate and precise
measurements, especially when using high-resolution sensors.
FloatLevelMeasurement
50.
Level Measurement
Ultrasonic levelmeasurement is a non-contact method for determining the level
of liquids or solids within a container, using sound waves. The sensor emits an
ultrasonic pulse, and by measuring the time it takes for the echo to return, the
distance to the surface is calculated. This distance, combined with the known
tank dimensions, allows for accurate level measurement.
how it works:
Sound Wave Emission: An ultrasonic transducer emits high-frequency sound
waves towards the liquid surface.
Reflection: These waves travel through the air (or gas) above the liquid and
reflect off the liquid's surface.
Time Measurement: The sensor measures the time it takes for the reflected
sound wave (echo) to return.
Distance Calculation: Using the speed of sound and the measured time, the
distance to the liquid surface is calculated.
Level Determination: This distance, combined with tank dimensions, allows
for precise level determination.
UltrasonicLevelMeasurement
51.
Level Measurement
Advantages ofUltrasonic Level Measurement:
Non-contact: The sensor doesn't need to be submerged in the liquid,
reducing maintenance and potential contamination.
High Precision: Ultrasonic sensors offer accurate and reliable level
measurements.
Versatile: Suitable for a wide range of liquids and applications, including
corrosive and hazardous environments.
Easy Installation: Ultrasonic sensors can be easily mounted on top of tanks
or vessels.
Cost-effective: Compared to some other level measurement technologies,
ultrasonic sensors can be a cost-effective solution.
Applications in Oil and Gas:
Storage Tanks: Monitoring liquid levels in crude oil tanks, refined product
tanks, and chemical storage tanks.
Pipelines: Measuring liquid levels in pipelines to monitor flow and detect
leaks.
Process Vessels: Monitoring liquid levels in reactors, separators, and other
process vessels.
Fuel Tanks: Measuring fuel levels in storage tanks and on vehicles.
Compressor Stations: Monitoring lubricant levels in compressor stations.
UltrasonicLevel Measurement
52.
Level Measurement
Limitations:
Temperatureand Pressure: Accuracy can be
affected by extreme temperatures and
pressures.
Foam and Vapor: Foam and vapor layers
can interfere with the ultrasonic signal.
Environmental Conditions: Extreme weather
conditions can affect signal transmission.
UltrasonicLevel Measurement
In summary, ultrasonic level measurement is a widely used and effective technology for monitoring liquid levels
in the oil and gas industry. Its non-contact nature, accuracy, and versatility make it a valuable tool for a variety of
applications.
53.
Level Measurement
Radar levelmeasurement in the oil and gas industry
provides a reliable and accurate method for
determining liquid or solid levels in tanks and
vessels, even in challenging conditions. This
technology utilizes radar pulses that are emitted and
reflected by the material surface, allowing for non-
contact measurement of the level.
how it works:
Radar level sensors emit radar signals
(electromagnetic waves) towards the surface of
the material.
These signals reflect off the surface and return
to the sensor.
The sensor calculates the level based on the
time it takes for the signal to travel to and from
the surface (time-of-flight method).
RadarLevelMeasurement
54.
Level Measurement
Advantages
Non-contactmeasurement: Radar level sensors do not physically touch the
material, reducing the risk of contamination or damage to the sensor.
High accuracy: Radar level measurement is known for its precision, even in
challenging environments.
Insensitive to process conditions: Radar is not affected by changes in
temperature, pressure, or the presence of dust or foam, unlike some other
measurement technologies.
Wide range of applications: Radar level sensors can be used for various
materials and tank sizes in the oil and gas industry, including liquids like oil
and gas, as well as solids.
Improved safety and efficiency: Accurate level measurement helps prevent
overfilling, dry runs, and other issues that could lead to safety hazards or
operational disruptions.
Suitable for harsh environments: Radar can withstand extreme
temperatures, pressures, and corrosive materials commonly found in oil
and gas operations.
Remote monitoring capabilities: Many radar level transmitters can be
integrated with remote monitoring systems, allowing for real-time data
collection and analysis.
RadarLevelMeasurement
55.
Level Measurement
Specific applicationsin oil and gas:
Storage tanks: Monitoring oil and gas levels in storage tanks
for inventory management and custody transfer.
Process vessels: Measuring levels in reactors, separators,
and other process equipment.
Sump pits: Monitoring waste or overflow liquids in sump pits.
Offshore applications: Measuring levels in tankers,
wellheads, and other offshore facilities.
LPG tanks: Measuring levels in liquefied petroleum gas
(LPG) tanks.
Considerations:
Radar signal reflection: The radar signal's ability to reflect off
the material surface can be affected by factors like the
material's dielectric constant and surface roughness.
Tank geometry: Accurate level measurement requires proper
consideration of the tank's shape and dimensions.
RadarLevelMeasurement
56.
Level Measurement
Capacitance levelmeasurement in the oil and gas industry is a reliable and
cost-effective method for monitoring liquid levels, particularly in tanks and
vessels, and for detecting interfaces between different liquids. This
technique relies on the change in capacitance between a probe and the
tank wall as the liquid level rises or falls. The change in capacitance is
directly related to the dielectric constant of the liquid and its permittivity
relative to air or vapor. .
how it works:
A capacitance level sensor consists of a probe (electrode) and the tank
wall, which act as the two plates of a capacitor.
As the liquid level changes, the amount of liquid between the probe
and the tank wall changes, altering the capacitance.
A higher liquid level means more liquid with a higher dielectric constant
is present, increasing the capacitance.
The sensor measures this capacitance change and converts it into a
level reading.
CapacitanceLevelMeasurement
57.
Level Measurement
Advantages::
Cost-effective:Capacitance level measurement is a relatively
inexpensive method compared to other technologies.
Suitable for various liquids and solids: It can be used for both
conductive and non-conductive liquids, as well as bulk solids.
Interface measurement: Capacitive sensors can accurately detect the
interface between two immiscible liquids, even with emulsions or rag
layers.
Point level detection: Capacitance level switches are effective for
simple on/off level detection.
Considerations:
Dielectric constant difference: For interface measurement, the dielectric
constants of the two liquids must be significantly different.
Buildup: Conductive buildup on the probe can affect accuracy, requiring
occasional cleaning and maintenance.
Sensitivity to conductivity changes: Changes in the conductivity of the
liquid can also affect readings, especially in interface measurements.
CapacitanceLevelMeasurement
58.
Level Measurement
Applications inOil and Gas:
Tank gauging: Monitoring liquid levels in storage tanks for inventory
management.
Interface detection: Separating different layers of liquids in process
vessels, such as oil and water.
Point level detection: Triggering alarms or controlling pumps when a
certain liquid level is reached.
Level measurement in pipelines and process vessels: Monitoring liquid
levels in various stages of oil and gas processin
CapacitanceLevelMeasurement
59.
Level Measurement
Differential pressure(DP) level measurement in the oil and gas industry uses a DP
transmitter to measure the difference between two pressures, which, when combined with
fluid density, allows for the calculation of liquid or liquefied gas levels in vessels. This
method is reliable, accurate, and widely used in pressurized tanks for various purposes,
though temperature can affect its accuracy and requires mitigation. DP systems are
versatile, offering configurations with direct or remote mount seals and wireless options to
adapt to diverse process conditions, such as high temperatures or corrosive media.
how it works:
Pressure Sensing: A DP transmitter has two ports: a high-side port and a low-side
port.
Hydrostatic Pressure: The high-side port is typically placed at or near the bottom of
the vessel to measure the hydrostatic pressure exerted by the fluid column.
Reference Pressure: The low-side port measures a reference pressure, such as the
static pressure or head pressure above the liquid in a pressurized tank, or it can be
vented to the atmosphere for gauge pressure measurement.
Level Calculation: The transmitter then measures the difference between these two
pressures (the DP reading) and uses the fluid's specific gravity to calculate the liquid
level.
Output: The level is displayed as a reading or sent as a signal to a controller.
Differential PressureLevelMeasurement
60.
Level Measurement
Oil andGas Applications:
Pressurized Tanks: Ideal for measuring levels in pressurized tanks used for storage or processing, ensuring
consistent output and managing specific operational conditions.
Liquefied Gases: Effectively measures levels in vessels containing liquefied gases.
Safety and Compliance: Provides critical, accurate readings for safety interlocks, compliance with regulations,
and preventing overflows or pump damage.
Key Components and Considerations
DP Transmitters: Devices that measure the pressure difference, available in mechanical, electronic, and digital
types.
Remote Seals: Used to separate the transmitter from the process media, preventing damage from corrosive or
abrasive liquids and protecting electronics from high heat, according to P.I. Process Instrumentation.
Temperature Compensation: Because temperature changes can affect fluid density and transmitter accuracy,
specialized components or configurations, like thermal range expanders, are used to mitigate these effects.
Specific Gravity (SG): The density of the liquid, which is crucial for accurate level calculation.
Temperature Effects: Temperature changes can affect the density of the liquid and the pressure readings,
potentially impacting accuracy. Temperature compensation is often incorporated to mitigate these effects.
Differential PressureLevelMeasurement
61.
Level Measurement
Level measurementand control are indispensable for the safe and efficient operation of oil and gas plant facilities.
The choice of level measurement technology—whether float, ultrasonic, radar, capacitance, or differential
pressure—depends on the specific application, fluid characteristics, and environmental conditions. Understanding
the principles, advantages, and limitations of each method enables professionals to design and maintain reliable
level instrumentation systems. Accurate level measurement supports process optimization, prevents hazardous
conditions, and ensures compliance with regulatory standards.
Technology Measurement
Principle
Accuracy Suitable
Applications
Advantages Limitations
Float Mechanical
displacement
±1-2% Clean liquids, low
pressure tanks
Simple, low cost,
easy maintenance
Mechanical wear, not
suitable for harsh fluids
Ultrasonic Time-of-flight of
sound pulses
±0.25-1% Open tanks, sumps,
non-contact liquids
Non-contact, no
moving parts
Affected by vapor, foam,
turbulence
Radar (Guided/Non-
contact)
Time-of-flight of
microwave pulses
±0.1-0.5% Harsh
environments,
pressurized vessels
High accuracy,
unaffected by vapor
Higher cost, requires
calibration
Capacitance Change in electrical
capacitance
±0.5-1% Liquids, slurries,
interface
measurement
Versatile, suitable
for solids/liquids
Sensitive to coating,
requires grounding
Differential Pressure Hydrostatic pressure
difference
±0.1-0.5% Pressurized tanks,
interface level
Reliable, widely
used
Density and temperature
dependent
Selection Criteria for Level
62.
Level Measurement
LevelControl
Level controlsystem regulates the amount of liquid, gas, or other fluid in
a container to a desired setpoint, using sensors to detect the level, a
controller to compare it to the setpoint, and actuators like pumps or
valves to adjust the input or output. These systems are crucial in
industries to prevent overflows, maintain consistent product quality,
ensure safety, and optimize process efficiency by automating the
monitoring and maintenance of fluid levels...
Typical level control system consists of three main components:
Sensor (Level Detector): This device measures the level of the
fluid within the tank or vessel. Common types include floats,
probes, pressure-based sensors, and more sophisticated
electronic sensors.
Controller: The sensor's reading is sent to a controller, which
compares it to the predetermined setpoint.
Actuator: If the measured level deviates from the setpoint, the
controller sends a signal to an actuator, which adjusts the flow
of fluid into or out of the container. This could be a pump to add
fluid or a valve to drain it. .
63.
3.Control Valves andAccessories
Typesof ControlValvesandActuators
ValveSizing andSelection
ValvePositionersandAccessories
MaintenanceandTroubleshooting
By understanding thevarious types ofcontrol valves, their sizing andselection, theuse ofpositioners and
accessories, andbestpractices formaintenance andtroubleshooting, attendees will beequipped toeffectively
manage thecontrol valves andfinal elements in their oiland gas facilities.
64.
3.Control Valves andAccessories
Typesof ControlValvesandActuators
Explore the different types of control valves,
including globe, ball, butterfly, and more, as well as
the various actuator types (pneumatic, electric,
hydraulic) used to operate them.
Control valves are the most common final control elements in process systems, regulating fluid flow to maintain
desired process conditions. They are the workhorses of process control, modulating flow in response to signals
from control systems to maintain process variables at their setpoints.
Main types of control valves used in oil and gas applications:
Globe Valves
Butterfly Valves
Ball Valves
Diaphragm Valves
Actuators provide the motive force to operate
the valve and include:
Pneumatic Actuators
Electric Actuators
Hydraulic Actuators
65.
Globe Valves: Thesevalves use linear motion of a plug to
control flow. They offer precise throttling control and are
widely used in applications requiring fine modulation. Globe
Valves use linear motion of a plug to control the flow rate.
These are specifically used to give ultra-precise control and
are commonly sought out for processes requiring throttling
systems (ControlValvesFo, 2025). The design of globe
valves provides excellent control characteristics, making
them ideal for applications where precise flow regulation is
required. Characteristics of globe valves:
Excellent throttling capability
Good shut-off characteristics
Available in a wide range of sizes and pressure
ratings
Can handle high pressure drops
Suitable for both liquid and gas services
GlobeValves
Types of Control Valves
66.
Globe valve typesare mainly categorized by their body
pattern and disk design. Globe valves are chosen for their
precise flow regulation, good shutoff, and high-pressure
handling in applications.
Types by Body Pattern
Standard (T-type) Globe Valve: The most common
type, featuring a "T" or "Z" shaped internal flow
path, which is suitable for high-pressure drop
services and provides excellent throttling and
shutoff capabilities.
Angle Globe Valve: This type has a single inlet and
outlet, but the fluid path is at a 90-degree angle,
creating a straight flow and reducing turbulence
compared to a standard valve.
Y-type (Oblique) Globe Valve: Also known as an
oblique globe valve, it has a lower flow resistance
and a more streamlined path for the fluid compared
to the standard type, reducing pressure drop.
GlobeValves
Types of Control Valves
67.
Types by DiskDesign
Ball-type Disk: A simple design for low-pressure, low-
temperature systems, primarily for stopping and starting
flow rather than precise throttling.
Needle-type Disk: Features a long, tapered plug that
provides more precise and accurate throttling compared
to ball or composition disks, making it ideal for fine flow
control.
Composition Disk: Incorporates a hard, non-metallic
insert to achieve superior shutoff, ensuring a tight seal
when the valve is closed.
GlobeValves
Types of Control Valves
68.
Butterfly valve isa mechanism that regulates the flow of
materials within large pipe diameters by the quarter-turn
rotation of a disc. These valves feature a rotating disc that
modulates flow. They are lightweight and compact, ideal for
large-diameter pipelines and low-pressure drop applications.
A rod feeds through the center of a disc and this rod is
connected to an actuator that controls the motion of the
disc.Butterfly Valves are manufactured with a rotating ball
and a bore used to control the flow of fluid. They get their
name from being very lightweight and compact. They stand
out for their ability to function in low-pressure drops.
Characteristics of globe valves:
Compact design with relatively low weight
Lower cost compared to other valve types of
similar size
Quick operation with quarter-turn actuation
Good for large pipe sizes
Lower pressure drop compared to globe valves
Butterfly Valves
Types of Control Valves
69.
Ball valve isa flow control device which operates using a
spherical ball with a hole (also known as a bore) through the
middle. When the valve handle is turned, the ball rotates to
align the bore with the flow path—allowing fluid to pass
through.These valves use a rotating ball with a bore to
start/stop or modulate flow. They provide tight shutoff and
are used in on-off and modulating services. Ball Valves also
have a rotating ball and a bore that is used to control flow.
These valves have extremely tight shut-off abilities and are
best used in processes that require frequent and sharp on-
off functions. Characteristics of ball valves:
Excellent shut-off capability
Low torque requirements for operation
Suitable for both on-off and modulating service
Available in full-bore and reduced-bore designs
Good for high-pressure and high-temperature
applications
Ball Valves
Types of Control Valves
70.
These valves employa flexible diaphragm to seal the flow
path. They are ideal for corrosive or abrasive fluids due to
full isolation of the process from the actuator. Diaphragm
Valves have a flexible diaphragm that operates the closure
function. What makes these valves unique is that they
present an extra-tight shut-off capability, which is needed
when the fluids are corrosive Characteristics of ball valves:
Excellent corrosion resistance
No stuffing boxes, reducing leakage potential
Suitable for slurries and viscous fluids
Easy maintenance with minimal downtime
Good for sanitary applications
DiaphragmValves
Types of Control Valves
71.
Valve actuators arecategorized by their motion (linear or rotary) and
their power source (pneumatic, hydraulic, electric), with some also being
self-actuated or manually operated. Linear actuators move a valve stem
in a straight line, typically for valves like globe and gate valves, while
rotary actuators rotate the valve stem for ball, butterfly, and plug valves.
Pneumatic actuators use compressed air, hydraulic actuators use
pressurized fluid, and electric actuators use motors for precise control.
Type by motion:
Linear Actuators: These actuators move a valve stem in a
straight line, opening or closing the valve through linear force.
They are used for valves like globe, gate, and rising stem ball
valves. Common types include diaphragm and piston
actuators.
Rotary Actuators: These actuators convert a control signal
into rotary motion, operating quarter-turn valves or those
requiring multi-turn rotation. Common rotary valves include
ball, butterfly, and plug valves.
Types Actuators
72.
Type by powersource:
Pneumatic Actuators: These use compressed air to generate
force for valve actuation. They are common, space-saving, and
low-maintenance but may lose air pressure or be susceptible to
contamination.
Hydraulic Actuators: These use pressurized hydraulic fluid to
operate the valve, offering high force and power. However, fluid
leaks are a concern, and the systems can be complex and
large.
Electric Actuators: These use an electric motor to initiate valve
actuation, providing high precision. They are often used for
applications requiring precise control but may have higher costs
and motor wear over time.
Other Types:
Self-Actuated Valves: These operate without an external power
source, such as spring-return actuators that are used for fail-
safe applications.
Manual Actuators: While not truly "actuated" in the automated
sense, manual operators are sometimes included as a basic
way to control a valve, although they may be too slow for certain
applications.
Types Actuators
73.
Proper valve sizingis critical to ensure optimal performance, energy efficiency, and process stability. An incorrectly
sized valve can lead to poor control, excessive wear, and increased energy consumption.
Key factors in valve selection include::
Process fluid type: The nature of the fluid (gas, liquid, slurry) affects valve selection. For example, slurries may
require valves with minimal flow restrictions to prevent clogging, while corrosive fluids require compatible
materials of construction.
Operating pressure and temperature: These parameters determine the pressure rating of the valve and the
materials that can be used. High-temperature applications may require special materials or designs to prevent
leakage or binding.
Flow rate and required turndown ratio: The flow rate determines the size of the valve, while the turndown ratio
(the ratio of maximum to minimum controllable flow) affects the type of valve selected. Some valve types have
better turndown characteristics than others.
Material compatibility: The valve materials must be compatible with the process fluid to prevent corrosion or
erosion. Common materials include stainless steel, carbon steel, and exotic alloys for severe services.
Noise and cavitation considerations: In liquid services, high pressure drops can cause cavitation, which can
damage the valve and piping. In gas services, high velocities can cause excessive noise. Special valve trims or
designs may be required to mitigate these issues.
Fail-safe requirements: The valve must fail in a safe position (open, closed, or last position) upon loss of power
or air supply. This is determined by the process safety requirements.
Valve Sizing and Selection
74.
The sizing processmust also consider the installed characteristics of the
valve, which can differ from the inherent characteristics due to the
interaction between the valve and the process system. This is particularly
important in applications where the valve pressure drop varies significantly
with flow rate.
Valve Sizing and Selection
75.
Valve Positioners: Thesedevices ensure that the valve stem position
corresponds to the control signal. They improve accuracy, response time,
and linearity by comparing the actual valve position to the desired position
and adjusting the air supply to the actuator accordingly.
Types of positioners include:
Analog positioners: Use mechanical or pneumatic means to compare
input signal and valve position
Digital (smart) positioners: Use microprocessors for more precise
control and offer additional features such as diagnostics and
communication capabilities
Electro-pneumatic positioners: Convert electrical signals to pneumatic
signals to control pneumatic actuators
Valve Positioners and Accessories
Modern smart positioners offer advanced features:
Auto-calibration and setup, valve signature capture for diagnostics, Partial stroke testing for safety
valves, Communication protocols,Advanced diagnostics for predictive maintenance,
76.
Accessories enhance theperformance and functionality of control
valves:
I/P Converters: These devices convert electrical signals (4–20 mA)
to pneumatic signals (3–15 psi). They are used when electronic
control systems need to interface with pneumatic actuators.
Booster Relays: These increase actuator speed by amplifying air
flow. They are particularly useful for large actuators or applications
requiring fast valve response.
Limit Switches: These indicate fully open/closed positions and are
used for interlocks, alarms, or status indication in control systems.
Solenoid Valves: These are used for on-off control or emergency
shutdown. They can quickly vent air from actuators to fail valves to
their safe position.
Valve Positioners and Accessories
These accessories play a crucial role in ensuring the proper operation
and integration of control valves into process control systems.
77.
Regular maintenance preventsfailures, extends valve life, and ensures process reliability.
Control valves are mechanical devices subject to wear and require periodic attention to
maintain optimal performance.
Common issues with control valves:
Stiction: This is static friction causing delayed response when the valve begins to move.
Stiction can cause oscillations in control loops and poor control performance. It is often
caused by tight packing, lubrication issues, or stem friction.
Hysteresis: This is the difference in response during opening versus closing. Hysteresis
can be caused by mechanical backlash, loose linkages, or actuator issues. It results in
different valve positions for the same control signal depending on whether the signal is
increasing or decreasing.
Cavitation and Flashing: These phenomena occur in liquid services when the pressure
drops below the vapor pressure of the liquid. Cavitation can cause noise, vibration, and
erosion of valve components. Flashing occurs when the pressure remains below the vapor
pressure, resulting in two-phase flow that can damage valve trim.
Erosion and Corrosion: These are wear mechanisms that can degrade valve performance
over time. Erosion is caused by high-velocity fluids or particulates in the stream, while
corrosion is caused by chemical attack from the process fluid.
Maintenance and Troubleshooting
78.
Preventive maintenance schedulesshould include visual inspections, functional tests, and
documentation of performance trends. A well-planned maintenance program will include:
Routine visual inspections for leaks, corrosion, and physical damage
Regular testing of valve response and calibration
Lubrication of moving parts as recommended by the manufacturer
Replacement of wear items such as packing, gaskets, and seals
Diagnostic testing using smart positioners or portable test equipment
Predictive maintenance techniques can help identify issues before they lead to failure:
Monitoring valve signatures to detect changes in performance
Tracking actuator air consumption to detect leaks
Analyzing control loop performance to detect valve issues
Using non-destructive testing techniques to assess valve condition
Troubleshooting control valve problems requires a systematic approach:
Verify the control signal is reaching the valve
Check the air supply (for pneumatic actuators)
Verify the valve is receiving the signal and responding
Check for mechanical binding or obstruction
Verify the process conditions are within design limits
Consult diagnostic data from smart positioners if available
Maintenance and Troubleshooting
79.
4.Control Systems andLogic
• Basics of control loops
Examines the fundamental components and principles
of control loops, including sensors, controllers, and final
control elements.
• PID control
Introduces the Proportional-Integral-Derivative (PID)
control algorithm and its applications in process control.
• Programmable Logic Controllers (PLCs)
Provides an overview of PLCs, their architecture,
programming, and role in industrial automation.
• Distributed Control Systems(DCS)
Explores the features and benefits of DCS, including
centralized monitoring, control, and data management.
• Supervisory Control and Data
Acquisition (SCADA) systems
Examines the role of SCADA systems in remote
monitoring, data acquisition, and supervisory control of
industrial processes.
• Safety Instrumented Systems(SIS)
Covers the purpose, design, and implementation of SIS
for ensuring safe plant operations.
80.
A control loopconsists of four main components: sensor, transmitter, controller, and final control element. These components work together to
maintain a process variable at its desired setpoint. The sensor measures the process variable, the transmitter converts this measurement into a
standardized signal, the controller compares this signal to the setpoint and calculates a corrective action, and the final control element (typically
a control valve) implements this action in the process.
The controller compares the measured process variable (PV) to the setpoint (SP) and calculates an output signal using a control algorithm. The
difference between the PV and SP is called the error, and the controller’s job is to minimize this error by adjusting its output to the final control
element.
PID Control (Proportional-Integral-Derivative) is the most common control strategy in the process industries. PID controllers use three
terms to calculate the output:
Proportional (P): The output is proportional to the error. A larger error results in a larger change in the output. The proportional term
reduces response time but may leave a steady-state error (offset) because it only responds to the current error, not the accumulated error
over time.
Integral (I): This term eliminates steady-state error by integrating past errors. If the error persists over time, the integral term continues to
increase the output until the error is eliminated. The integral term is essential for processes that require precise control at the setpoint.
Derivative (D): This term predicts future error based on the rate of change of the error. It provides a damping effect that can improve
stability, particularly in processes with long time constants or dead time. The derivative term responds to how quickly the error is changing,
not just its magnitude.
Basics of control loops
81.
Analog Control Moduleis a critical component in control systems,
particularly PLC, DCS or SCADA. It is designed to handle analog signals,
which represent continuous physical quantities such as temperature,
pressure, flow, and level. These modules enable the system to process and
control analog inputs and outputs effectively.
Analog control modules typically have multiple input channels
that can accept signals from various sensors (e.g., thermocouples,
pressure transducers, flow meters).
Analog control modules can also provide output channels to
send control signals to actuators, control valves, or other devices.
Analog inputs-output signals are usually in the form of voltage
(0-10V) or current (., 4-20 mA).
Analog control modules work in conjunction with control
algorithms (e.g. PID control) to maintain desired setpoints by
adjusting outputs based on the measured inputs. They play a vital
role in closed-loop control systems.
Analog control modules are essential for processing continuous
signals in control systems. They enable precise monitoring and
control of various physical parameters, making them crucial for
maintaining optimal operating conditions in industrial processes.
PID Module is dedicated computational unit that implements a
Proportional-Integral-Derivative (PID) control algorithm,
which continuously adjusts the output of a system based on the
difference between a desired setpoint and the measured
feedback value, aiming to maintain a precise control over a
process variable like temperature, pressure, or speed. It
calculates the necessary corrective action by considering three
components:
Proportional (P): Directly proportional to the current error
between the setpoint and the measured value.
Integral (I): Accumulates the past errors, helping to
eliminate steady-state errors.
Derivative (D): Represents the rate of change of the error,
helping to anticipate future trends and prevent overshoot.
Basics of control loops
82.
Discrete Control Moduleis an essential component in control systems,
particularly in Programmable Logic Controllers (PLCs) and Distributed
Control Systems (DCS). This module is designed to handle discrete signals,
which are binary in nature, representing two states: ON (1) and OFF (0).
Discrete control modules are crucial for managing processes that require
precise control over equipment and machinery.
Discrete control modules process binary signals, allowing them to read
inputs from devices such as switches, sensors, and push buttons, and to
control outputs to devices like relays, contactors, and indicator lights.
The modules can interpret the state of input devices and execute control
logic based on predefined conditions. For example, if a safety switch is
activated (input ON), the module can trigger an output to stop a motor.
Users can program the control logic using various programming
languages supported by the PLC, DCS or SCADA, such as Ladder Logic,
Function Block Diagram, or Structured Text, allowing for customized
control strategies.
Applications of Discrete Control Modules,
Safety Systems: Implemented in emergency stop circuits and safety
interlocks to ensure safe operation of equipment.
Process Control: Employed in batch processes where discrete
actions (e.g., starting or stopping a pump) are necessary based on
specific conditions.
Basics of control loops
83.
The PID controlleroutput is calculated as: Output = Kp × e + Ki × ∫e dt + Kd ×
de/dt
Where:
Kp is the proportional gain
Ki is the integral gain
Kd is the derivative gain
e is the error (SP - PV)
Tuning PID parameters (Kp, Ki, Kd) is essential for optimal performance and
stability. The goal of tuning is to achieve fast response to setpoint changes and
disturbances while maintaining stability and minimizing overshoot. Various
tuning methods exist, including:
Manual tuning based on experience and process knowledge
Ziegler-Nichols tuning method
Lambda tuning for processes with specific dynamic characteristics
Auto-tuning features available in moderncontrollers
Basics of control loops
Poorly tuned controllers can lead to oscillations, slow response, or instability. The proper tuning
depends on the process characteristics, including process gain, time constant, and dead time.
84.
PLCs are digitalcomputers used for automation of electromechanical processes. They
were developed in the 1960s to replace relay-based control systems and have evolved
into sophisticated control platforms with extensive capabilities
PLCs are ruggedized for industrial environments and programmed using ladder logic or
function block diagrams. Ladder logic resembles electrical relay logic diagrams, making it
intuitive for electricians and technicians, while function block diagrams use graphical
representationsof control functions that are easier for engineers to understand.
Key characteristics of PLCs include:
Modular design allowing expansion as needed
High reliability and long mean time between failures (MTBF)
Fast scan times for real-time control
Extensive I/O capabilities for various signal types
Communication interfaces for networking and data exchange
PLCs are used extensively in discrete control, sequencing, and interlocking applications in
the oil and gas industry. Common applications include:
Wellhead control and monitoring
Compressor and pump control
Tank farm automation
Emergency shutdown systems
Fire and gas detection systems
Programmable Logic Controllers (PLC)
85.
Modern PLCs offeradvanced features such as:
Structured text programming for complex algorithms
Built-in PID control capabilities
Data logging and trending
Web server capabilities for remote access
Integration with enterprise systems
PLC programming follows the IEC 61131-3 standard, which defines five programming
languages:
Ladder Diagram (LD)
Function Block Diagram (FBD)
StructuredText (ST)
Instruction List (IL)
Sequential Function Chart (SFC)
The choice of programming language depends on the application, the background of the
programmingpersonnel, and company standards.
Programmable Logic Controllers (PLC)
DCS are integratedsystems used for continuous process control in
large-scale plants. They provide centralized monitoring and
decentralized control, with multiple controllers distributed across the
plant. This architecture provides better reliability than centralized
systems because a failure in one controller does not affect the entire
system.
DCS architecture typically includes:
Operator stations for monitoring and control
Engineering stations for system configuration and programming
Process controllers for executing control algorithms
Input/output modules for interfacing with field instruments
Communication networks for data exchange betweencomponents
DCS offer advanced features that make them suitable for complex
process control applications:
Historical data logging for process analysisand troubleshooting
Comprehensive alarm management systems
Advanced process control capabilities
Redundant components for high availability
Integration with business systems for enterprise-wide optimization
Distributed Control Systems (DCS)
88.
In the oiland gas industry, DCS are commonly used in:
Refineries and petrochemical plants
Large gas processing facilities
LNG plants
Offshore platformswith extensive processing facilities
DCS differ from PLCs in several ways:
DCS are designed for continuous process control, while
PLCs excel at discrete control
DCS have built-in process control algorithms and
databases, while PLCs require programming for each
function
DCS offer more sophisticated operator interfaces and
data management capabilities
DCS are typically more expensive than PLCs but offer
more functionality for process applications
The choice between DCS and PLC depends on the
application requirements, plant size, and budget. Many
facilities use a combination of both, with PLCs for discrete
control and safety systems and DCS for continuous process
control.
Distributed Control Systems (DCS)
89.
SCADA systems providehigh-level monitoring and control over
geographically dispersed assets (e.g., pipelines, wellheads). They collect
data from remote terminal units (RTUs) and present it via human-
machine interfaces (HMIs). SCADA systems enable operators to monitor
and control processes from central locations, reducing the need for
personnel at remote sites.
Key components of SCADA systems include:
Master Terminal Units (MTUs) or SCADA servers that host the
applicationsoftware
Remote Terminal Units (RTUs) or Programmable Logic Controllers
(PLCs) that interface with field devices
Communication systems that transfer data between field devices and
the central location
Human-Machine Interfaces (HMIs) that display process information
to operators
Alarm systems that notify operators of abnormal conditions
Data historians that store process data for analysisand reporting
Supervisory Control and Data Acquisition (SCADA) Systems
90.
SCADA systems enableremote operation, alarm
notification, and data analysis. They are particularly
valuablein the oil and gas industry for:
Pipeline monitoring and control
Oil and gas field operations
Water injection systems
Offshore platform monitoring
Terminal operations
Modern SCADA systems offer advanced capabilities such
as:
Web-basedaccess for remote monitoring
Integration with Geographic Information Systems
(GIS)
Advanced alarm management and analysis
Mobile access for field personnel
Predictive maintenance capabilities
Cybersecurity features to protect against threats
Supervisory Control and Data Acquisition (SCADA) Systems
91.
Communication systems area critical component of SCADA systems.
Various communication technologies are used, including:
Radio systems (licensed and unlicensed)
Satellite communications
Cellularnetworks (4G, 5G)
Fiberoptic cables
Microwave links
The choice of communication technology depends on factors such as
distance, data requirements, terrain, cost, and reliability requirements.
Supervisory Control and Data Acquisition (SCADA) Systems
SCADA systems differ from DCS in that they are designed for geographically dispersed
applications, while DCS are optimized for concentrated process plants. However, the boundaries
between these systems are blurring as technology advances, with many modern systems
incorporating features of both architectures.
92.
In summary, thechoice between PLC, DCS, and
SCADA depends on the specific requirements of
the application:
PLCs are typically used for discrete control
applications and are best suited for
controlling machinery and equipment at a
local level. They are highly reliable and can
handle fast response times.
DCS is designed for continuous and
complex processes, providing integrated
control and monitoring across large
systems. It is ideal for industries with
intricate processes that require real-time
data and control.
SCADA systems focus on supervisory
control and data acquisition, providing
operators with a high-level overview of the
entire system. SCADA is often used in
conjunction with PLCs and DCS to
monitor and control processes from a
centralized location.
Control Systems and Logic
SIS are independentsystems designed to bring the
process to a safe state when dangerous conditions
occur. They are separate from the basic process
control system (BPCS) to ensure that a failure in the
BPCS does not compromise the safety system.
SIS operate based on Safety Integrity Level (SIL)
ratings (SIL 1 to SIL 4), defined by IEC 61511. The SIL
rating indicates the level of risk reduction provided
by the safety function:
SIL 1: Low risk reduction (probability of failure on
demand between 10^-1 and 10^-2)
SIL 2: Medium risk reduction (probability of
failure on demand between 10^-2 and 10^-3)
SIL 3: High risk reduction (probability of failure
on demand between 10^-3 and 10^-4)
SIL 4: Very high risk reduction (probability of
failure on demand between 10^-4 and 10^-5)
Safety Instrumented Systems (SIS)
95.
Examplesof SIS inoil and gas applicationsinclude:
Emergency shutdown (ESD) systems that close valvesand stop equipment in hazardous conditions
Fire and gas detection systems that initiate alarms and shutdowns
High-integrity pressure protection systems (HIPPS) that prevent overpressure
Burner management systems for furnaces and boilers
SIS components must be carefully selected and designed to meet the required SIL rating. This includes:
Sensors with appropriate diagnosticcoverage
Logic solvers with sufficient reliabilityand diagnostics
Final elements (valves) with adequate shutdown capability
Redundancy and voting logic to achieve the required reliability
SIS must be designed, installed, commissioned, and maintained according to the IEC 61511 standard,
“Functional safety – Safety instrumented systems for the process industry sector.” This standard
provides a lifecycle approach to safety instrumented systems, from hazard assessment through
decommissioning. Regular testing of SIS is essential to ensure they will function when needed. This
includes:
Logic solver testing to verify proper operation
Final element testing to ensure valvescan close when required
Sensor testing to verify proper operation and calibration
Integration testing to ensure the system functions as a whole
Safety Instrumented Systems (SIS)
96.
5.Signal Types andWiring
AnalogandDigitalSignals Wiring StandardsandPractices
Examine industry-standard wiring practices,
protocols, and guidelines for
instrumentation and control system
installations.
Intrinsic SafetyandHazardousArea
Wiring
Understanding signal types, wiring standards, and safety considerations is crucial for the proper design,
installation, and maintenance of instrumentation and control systems in oil and gas facilities.
97.
Signal Types andWiring
Oil and gas instrumentation uses two primary signal types, analog (continuous values for temperature,
pressure, flow) and digital (on/off for switches, discrete commands). Wiring involves specialized, rugged
cables with armored and twisted-pair configurations for noise reduction and durability. Cables are
categorized by core/pair/triad (number of conductors) and voltage grade (e.g., 250V, 600V) depending on
signal type and local conditions, such as using multi-pair cables for analog signals and multi-core cables
for discrete signals
98.
Analog and DigitalSignals
Instrumentation systems use various types of signals to transmit
information between field devices and control systems. The choice of
signal type depends on factors such as distance, noise immunity, accuracy
requirements, and compatibilitywith existing systems.
Analog Signals are continuous signals that represent physical
measurements as voltage or current values. The most common analog
signals in industrial instrumentation are:
1. 4–20 mA current loops: This is the most common standard for
transmitting sensor data in the oil and gas industry. The 4–20 mA
range is used because it is immune to voltage drop over long distances
and provides “live zero” capability (4 mA represents the minimum
measurement, allowing detection of broken wires). Current signals are
also less susceptible to electrical noise than voltage signals.
Advantagesof 4–20 mA signals:
Immune to voltage drops in wiring
Less susceptible to electrical noise
Can transmit signals over long distances (up to several kilometers)
Live zero allows detection of broken wires or failed transmitters
Can power field devices (two-wire transmitters)
99.
Analog and DigitalSignals
2. 0–10 V: This voltage signal is used in some control systems but is more
susceptible to noise and voltage drop than current signals. It is
typically used for shorter distances and in less noisy environments.
Advantagesof 0–10 V signals:
Simple to interface with many control systems
Easy to measure and troubleshoot
Lower power consumption than current loops
Suitable for short-distance applications
Limitations of 0–10 V signals:
Susceptible to voltage drop over long distances
More affected by electrical noise
No live zero capability (0 V could mean zero measurement or
broken wire)
Cannot power field devices
100.
Analog and DigitalSignals
Digital Signals instrumentation uses signals with discrete values,
typically represented as binary 0s and 1s, to convey information about
the on/off status of devices like switches or valves. These digital
signals are discrete, rather than continuous like analog signals, and
are processed by digital devices and control systems. Examples
include limit switches providing on/off status to a PLC and solenoid
valves receiving on/off commands from a control system.
Digital Inputs: device like a limit switch sends a digital input
signal to a control system to indicate a physical state, such as a
valve being fully open or a machine reaching its end of travel.
Digital Outputs: control system can send a digital output
signal to an actuator, such as a solenoid valve or a motor
starter, to turn it on or off. Examples: Pump Start/Stop, Valve
Open/Closed:
101.
Analog and DigitalSignals
The HART (Highway Addressable Remote Transducer) protocol is a
hybrid analog-digital standard for industrial process control and
instrumentation, superimposing digital communication on the
existing 4-20mA analog current loop using Frequency Shift Keying
(FSK) to allow two-way communication without interrupting the
process signal. It enables host systems, such as control rooms or
handheld devices, to remotely configure, monitor, and
troubleshoot "smart" field instruments, accessing additional
information like diagnostics, device health, and multiple process
variables.
Hybrid Analog-Digital Communication: HART uses the
reliable 4-20mA analog signal for the primary process variable
and adds a digital signal for supplementarydata.
Frequency Shift Keying (FSK): A digital signal is superimposed
on the analog loop using FSK (Bell 202 standard), which
represents 1s and 0s with different frequencies.
Phase-Continuous Modulation: The FSK signal is phase-
continuous, meaning it has zero average power and does not
interfere with the 4-20mA signal, making it seamless and
reliable.
102.
Analog and DigitalSignals
The capabilitiesof a HART Communicator?
The Main purpose of HART communicator is to
communicate
Provides various information instrument type, sensor
type, model number etc.
Givesyou access to change URV & LRV of SMART TX
It can be used to reset and set the reading value
Compatiblewith existing 4–20 mA systems
Provides additional digital information
Enables remote configuration and diagnostics
Relatively simple to implement
Widelysupported by instrument manufacturers
103.
Analog and DigitalSignals
Foundation Fieldbus: This is a fully digital, bidirectional communication protocol designed
specifically for process automation. It allows multiple devices to be connected to the same
communication segment, reducing wiring costs and enabling advanced control strategies.
Advantagesof Foundation Fieldbus:
Reduced wiring costs (multiple devices on one cable)
Improved accuracy (digital signals are not affected by noise)
Advanced diagnostics and predictive maintenance capabilities
Control in the field (devicescan execute control algorithms)
Standardized device descriptions for interoperability
Profibus: This is another widely used industrial communication protocol that comes in several
variants, including Profibus DP (for high-speed communication with peripherals) and Profibus PA
(for process automation in hazardous areas).
Advantagesof Profibus:
High communication speed (up 12Mbps)
Wide acceptance in industrial automation
Support for both discrete and process applications
Robust communication in industrial environments
Large installed base of devices and systems (up to 126 devices per network)
104.
Analog and DigitalSignals
Modbus: This is one of the oldest and simplest communication protocols, originally
developed by Modicon (now Schneider Electric) for PLC communication. It remains
populardue to its simplicity and openness.
Advantagesof Modbus:
Simple protocol that is easy to implement
Widelysupported by many devices and systems
No licensing requirements
Suitable for simple communication needs
Low overhead and efficient use of bandwidth
Modbus RTU (Remote Terminal Unit): Serial communication protocol.
ModbusASCII: Serial communication protocol using ASCII characters.
ModbusTCP/IP: Ethernet-based communication protocol.
The choice between analog and digital signals depends on the application
requirements, existing infrastructure, and budget. Many facilities use a combination
of both, with 4–20 mA HART for critical measurements and digital protocols for less
critical applicationsor where advanced features are needed.
Signal wiring inan instrumentation system transmits signals from
sensors and field instruments to control systems and vice-versa,
using specialized cables designed for reliability and noise
immunity, often with shielding, to convey information in process
industries. Key aspects include using voltage or current-based
signals, implementing noise reduction techniques like differential
amplifiers and proper cable shielding and grounding, and
terminating signals onto terminal blocks or integrated within
digital communication protocols like HART for remote
diagnostics.
Instrumentation cables: are specific types of cables designed
to carry electrical signals reliably from field instruments to
control panels and back.
These systems transmit information in the form of electrical
signals, commonly voltages or currents, which can represent
various process variableslike temperature, pressure, or flow.
Proper wiring is essential for reliable operation of
instrumentation systems. Poor wiring practices can lead to
signal noise, ground loops, intermittent operation, and safety
hazards.
Wiring Standards and Practices
107.
Key wiring standardsand practices include:
1. Cable Types: Different types of cables are used for different
applications:
Twisted-pair cables for analog signals to reduce
electromagnetic interference
Shielded cables for noise-sensitiveapplications
Multi-paircables for multiple signals in one cable
Armored cables for mechanical protection in harsh
environments
Fire-resistant cables for safety-critical applications
2. Shielding and Grounding: Proper shielding and grounding are
critical for noise immunity:
Cables for analog signals should be individuallyshielded
Shields should be grounded at one end only (typically at the
control system end) to prevent ground loops
Grounding should follow a single-point grounding philosophy
where possible
Safety grounds (protective earth) should be separate from
instrument grounds
Wiring Standards and Practices
108.
Key wiring standardsand practices include:
3. Segregation: Power and signal cables should be segregated to avoid
noise coupling:
Signal cables should be routed separately from power cables
If crossing is unavoidable, signal and power cables should cross at
90 degrees
Different signal types (e.g., analog, digital, low-level) should be
segregated
High-voltage and low-voltage circuits should be in separate
conduits or trays
4. Termination: Proper termination ensures reliable signal transmission:
Connections should be made using proper terminals (not wire
nuts)
Screw terminals should be tightened to the proper torque
Crimp connections should be made with the proper tools
Solder connections should be avoided in field terminations
(vibration can cause failure)
Terminal blocks should be properly labeled for identification
Wiring Standards and Practices
109.
Key wiring standardsand practices include:
5. Color Coding: Standardized color coding helpswith identificationand maintenance:
Wire colors should followcompany or industry standards
Typical color coding includes red for positive, black for negative, and green/yellow for
ground
Shield wires are often bare or tinned copper
Multi-conductorcables use different colors for each conductor
6. Documentation: Proper documentation is essential for maintenance and troubleshooting:
Wiring diagrams should show all connections and wire numbers
Cable schedules should list all cables, their routing, and termination points
Loop drawings should show the complete signal path from field device to control system
As-builtdrawings should be updated after any changes
Wiring Standards and Practices
Following ISA and IEC (IEC 60079-14) standards for cable types, shielding, grounding, and termination
ensures reliable operation of instrumentation systems. These standards provide detailed guidance on
best practices for industrial instrumentation wiring.
110.
Intrinsic safety (IS)is a method to prevent fires and explosions in hazardous areas by limiting electrical and thermal
energy to a level too low to cause ignition. In an IS system, a safety barrier (such as a Zener diode or isolating
barrier) limits the energy from the safe area, and intrinsically safe (IS) wiring and field devices are used within the
hazardous area. Key aspects include compatibility between the safety barrier and field device based on "entity
parameters" (voltage, current, capacitance, inductance), proper installation following codes like the National
Electrical Code (NEC), and specificrequirements for wire diameter and segregation from non-IS circuits.
Intrinsic Safety Principles:
Energy is limited to levels below what can cause ignition
Both electrical energy (voltage, current) and thermal energy are considered
Energy limitation is achieved through barriers or isolators
IS circuits are designed to prevent sparking and limit surface temperatures
Hazardous Area Classifications: Areas where explosive atmospheres may be present are classified according to the
likelihood and duration of the explosive atmosphere: IEC Zone Classification (used internationally)& NEC Division
Classification (used in North America):
Intrinsic Safety and Hazardous Area Wiring
111.
Intrinsic Safety Components:
IS Barriers: Devices that limit voltage and current to safe levels. They are typically installed in the safe
area and connected to field devices through IS wiring.
IS Isolators: Devices that provide galvanic isolation between safe and hazardous areas while limiting
energy. They can be installed in either safe or hazardous areas.
IS Field Devices: Instruments designed to operate with limited energy and not store sufficient energy to
cause ignition.
Intrinsic Safety Wiring Practices:
IS circuits must be separated from non-IS circuits
IS wiring should be in separate conduits or cable trays
IS and non-IS circuits should not share the same multi-conductorcable
IS wiring should be clearly identified (typicallywith blue color coding)
Grounding of IS systems must follow specificrules to maintain safety
Proper installation and maintenance of intrinsic safety systems are critical for safety. This includes:
Using only certified components
Following proper installation procedures
Maintaining separation between IS and non-IS circuits
Regular inspection and testing of IS systems
Proper documentation of IS systems
Intrinsic Safety and Hazardous Area Wiring
112.
6.Installation, Calibration, Commissioning& Maintenance
Installationbestpractices
Proper planning, mounting, and
integration of instrumentation to
ensure reliable and safe operation
Calibrationproceduresand
standards
Adherence to industry-recognized
calibration methods and guidelines
to ensure accuracy and precision
Commissioning&
Maintenance
Thorough functional testing, loop
checks, and pre-commissioning
activities to validate
instrumentation performance
Effective instrumentation installation, calibration, and commissioning are crucial
for ensuring the reliable and efficient operation of oil and gas facilities. By
following best practices and adhering to industry standards, professionals can
optimize the performance and longevity of instrumentation systems.
113.
Proper installation ofinstrumentation is critical for accurate measurement, reliable operation, and safety. Poor
installation practices can lead to measurement errors, equipment damage, and safety hazards.
Orientation and Location:
Instruments should be installed in locations that are accessible for maintenance and calibration
Pressure instruments should be installed to avoid liquid trapping in impulse lines (for gas service) or gas
pockets (for liquid service)
Temperature sensors should be installed where they can measure the representative process temperature
Flow meters require specific upstream and downstream straight pipe runs as specified by the
manufacturer
Level instruments should be installed to provide a clear view of the level being measured.
Supportand Protection:
Instruments should be properly supported to prevent stress on process connections
Vibration isolation may be required in high-vibrationareas
Weather protection should be provided for outdoor instruments
Heat tracing or insulation may be required for instruments in cold environments to prevent freezing
Sun shields may be needed for instruments exposed to direct sunlight to prevent overheating
Installation best practices
114.
Process Connections:
Rootvalvesshould be installed to allow isolation of instruments for maintenance
Block and bleed valves should be used for instruments that require calibration or maintenance while
the process is operating
Impulse lines should be as short as possible and sloped to prevent trapping of liquidsor gases
Seal pots or chemical seals may be required for corrosive, viscous, or high-temperature processes
Proper gasket and bolt materials should be used for process connections
Environmental Considerations:
Instruments should be protected from extreme temperatures, moisture, and corrosive atmospheres
Enclosures should be properly rated for the environmental conditions (NEMA, IP ratings)
Drain holes may be required in enclosures to prevent moisture accumulation
Breather devices may be needed to prevent pressure buildup in enclosures
Conduit seals should be used to prevent the passage of gases or liquids into conduit systems
Electrical Installation:
Wiring should follow proper segregation practices to prevent noise interference
Grounding should follow a single-pointgrounding philosophywhere possible
Surge protection should be installed for instruments in areas prone to lightning or electrical surges
Conduit and cable trays should be properly supported and secured
Labels should be applied to all wires and cables for identification
Installation best practices
115.
Documentation:
Installation shouldfollow P&IDs and loop diagrams
As-built drawings should be updated to reflect the actual
installation
Installation checklists should be completed and documented
Calibration and test results should be recorded
Deviations from design specifications should be documented and
approved
Following manufacturer guidelines and industry standards ensures proper
installation and reliable operation of instrumentation systems. The ISA has
published numerous standards and recommended practices for
instrumentation installation, including
ISA-RP5.1: Instrument Piping and Installation
ISA-RP5.2: Instrument Loop Diagrams
ISA-RP5.3: Installation, Operation, and Maintenance of Nuclear-
Safety-Related Instrumentation
Installation best practices
116.
Calibration verifies instrumentaccuracy by comparing its output to a known standard. It is a critical activity for
ensuring that measurements are accurate and reliable, which is essential for process control, safety, and regulatory
compliance.
Calibration Principles:
Calibration involvescomparing the instrument output to a reference standard of known accuracy
The reference standard should be traceable to national or international standards (e.g., NIST)
Calibration should be performed at multiple points across the instrument’s range
The calibration interval should be based on the instrument’s stability, application criticality, and
regulatory requirements
Calibration results should be documented and maintained for audit purposes
Calibration Procedures:
The instrument should be removed from service if possible, or isolated using block valves
The instrument should be allowed to stabilizeat ambient conditions
The reference standard should be connected to the instrument input
Test points should be applied in ascending and descending order to check for hysteresis
The instrument output should be recorded at each test point
Adjustments should be made if the instrument is out of tolerance
A final verification should be performed after adjustments
The instrument should be returned to service and documented
Calibration procedures and standards
117.
Calibration Standards:
Primarystandards have the highest accuracy and are used to calibrate secondary
standards
Secondary standards are used for routine field calibration
Working standards are used for less critical applications
The accuracy ratio between the standard and the instrument under test should be at
least 4:1 (preferably 10:1)
Calibration Intervals:
Critical instruments may require calibration every 3-6 months
Less critical instruments may be calibrated annually
Stable instruments in non-critical applications may have calibration intervals of 2-3
years
Calibration intervals should be reviewed periodically and adjusted based on calibration
history
Calibration Methods:
Bench calibration involves removing the instrument and calibrating it in a workshop
In-situ calibration is performed without removing the instrument from the process
Automated calibration systems can improve efficiency and consistency
Smart instruments often have self-calibration capabilities that can reduce the need for
external calibration
Calibration procedures and standards
118.
Calibration Documentation:
Calibrationcertificates should include instrument identification, date, standards used,
test points, results, and technician information
Calibration records should be maintained for the life of the instrument
Calibration software can help manage calibration schedulesand records
Calibration labels should be applied to instruments indicating the calibration date and
next due date
The metrology is a system to ensure the suitability of measurement by calibration method and
quality control… The certification also involves periodic calibration of these references executed by
an accredited external laboratory (WhatIsInstrumen, 2022). This ensures that measurements are
traceable to national standards and provides confidence in the accuracy of the measurements.
Calibration procedures and standards
120.
Testing and commissioningin an oil and gas plant is a systematic process of verifying that
instrumentation systems function correctly and safely, ensuring they meet design specifications
and operational requirements before plant startup. It involves rigorous testing of individual
instruments (e.g., sensors, transmitters), control valves, and integrated loops during both pre-
commissioning (static tests) and commissioning (dynamic tests), and culminates in a fully
integrated and functional plant ready for safe operation.
1. Pre-Commissioning (Static Checks): This phase focuses on confirming the physical
completion and proper installation of all components before they are energized or put
into dynamic operation:
Design Document Review: Reviewing all design documents, P&IDs (Piping
and Instrumentation Diagrams), and loop diagrams.
Mechanical Completion: Verifying that all piping, equipment, and valves are
correctly installed.
Electrical Checks: Performing continuity, insulation resistance, earthing, and
breaker tests.
Instrument Calibration: Calibrating individual instruments against known
reference values to ensure accuracy.
Flushing & Cleaning: Purging and cleaning process lines to remove debris.
Drying & Inerting: Purging lines with nitrogen or dry air.
2. .
Commissioning & Maintenance
121.
2. Commissioning (DynamicChecks): This phase introduces fluids or energy to the
systems to verify their dynamic performance and integration.
Loop Checks: Verifying the proper function of entire control loops from the
field device to the control system (DCS/PLC).
System Tests: Testing utilities (air, steam, power) and process systems under
actual or simulated load.
Safety System Verification: Testing emergency shutdown (ESD), fire and gas
systems, and alarms.
Control Valve & Safety Valve Testing: Performing stroke tests on control valves
and checking the blow-off pressure of safety valves.
Motor & Rotating Equipment Tests: No-load motor rotation checks,
alignment, and initial runs of pumps and compressors.
3. Start-Up & Performance Verification: The final phase where the plant is safely
brought online to produce its intended products and then its actual performance is
measured against design specifications.
Commissioning & Maintenance
122.
Effective maintenance activitiesin process control systems are crucial for
ensuring the reliability, efficiency, and safety of industrial operations. These
activities can be categorized into several types, each focusing on different aspects of
maintenance. Below is a detailed overview of key maintenance activities in process
control::
1. Preventive Maintenance, involves scheduled inspections, servicing, and repairs
to prevent equipment failures before they occur. This proactive approach helps
extend the lifespan of equipment and reduces unplanned downtime.
Regular inspection of control instruments and sensors.
Cleaning and lubrication of mechanical components.
Replacement of worn-out parts based on manufacturer recommendations.
2. Corrective maintenance is performed after a failure has occurred. The goal is to
restore equipment to its normal operating condition as quickly as possible.
Activities Include:
Troubleshooting and diagnosing the root cause of equipment failures.
Repairing or replacing faulty components (e.g., valves, actuators, sensors).
Testing and validating the functionality of repaired equipment.
Commissioning & Maintenance
123.
3. Calibration andTesting, calibration ensures that measurement devices
provide accurate readings. Regular testing of control systems is essential to
verify their performance and reliability. Activities Include:
Calibrate field sensors, actuator, positioner, and transmitters to ensure
accuracy.
Functional testing of control loops to verify proper operation,, SDVs.
Simulation of process conditions (cause effect matrix) to test the
response of control systems.
4. Data and Software Backup , robust data storage and software backups are
crucial for ensuring system availability and data integrity in case of failures
or incidents. Implement regular, automated backups to a separate location
and use appropriate software to manage and restore data.
5. Documentation and Record Keeping, Maintaining accurate records of
maintenance activities is essential for compliance, analysis, and continuous
improvement. Keeping logs of maintenance activities (history of equipment
performance), documenting calibration results and equipment
specifications
Commissioning & Maintenance
124.
Data and SoftwareBackup
Data and software backup is a critical aspect of maintaining the integrity, reliability, and availability of control systems in
industrial environments. Effective backup strategies ensure that essential data and software configurations are preserved,
allowing for quick recovery in case of system failures, data corruption, or other unforeseen events.
Key Components of Backup Strategy:
1. Data Backup:
Process Data: Historical data, real-time data, and logs generated by control systems.
Configuration Data: Settings and parameters for control devices, PLCs, DCS, and SCADA systems.
User Data: Information related to user accounts, permissions, and operational procedures.
2. Software Backup:
Control Software: Backup of the software applications used for programming and configuring control systems.
Operating System: Backup of the operating system and any necessary drivers or firmware.
Licenses and Keys: Ensure that software licenses and activation keys are backed up to avoid issues during recovery.
3. Backup Strategy:
Maintain clear documentation of backup procedures, including schedules, storage locations, and personnel.
Implement automated backup solutions to reduce the risk of human error and ensure consistency.
Determine the frequency of backups based on the criticality of the data. (daily, weekly, or monthly backups)
Determine the methode of backup (Full backup, Incremental Backup, or Differential Backup
Determine the storage of backup (onsite, offsite or cloud).
Regularly test backup and recovery processes to ensure that data can be restored successfully when needed.
Commissioning & Maintenance
125.
Documentation and Standards
InstrumentationDocuments
IndustryStandards
Compliance
Proper documentation and adherence to industry standards are crucial for ensuring the safe,
reliable, and compliant operation of instrumentation and control systems in oil and gas facilities.
126.
Instrumentation documents includeprocess diagrams (PFDs, P&IDs), instrument-specific documents (data sheets, index,
hookup diagrams, loop diagrams), control system documents (logic diagrams, control narratives), and system-wide
documents (instrumentation layout, cable schedules, and specifications). These documents are crucial for the design,
installation, operation, and maintenance of instrumentation and control systems in engineering projects.
Drawing & Diagram
Process Flow Diagram (PFD): A simplifieddiagram showing process streams, major equipment, and control
loops.
Piping and InstrumentationDiagram (P&ID): A detailed diagram showing the process piping,
instruments, and control system components.
Loop Diagram: Shows the detailed electrical and process connections for a specific instrument loop.
Hook-Up Diagram: Details the physical installation and mechanical connection of an instrument.
Logic Diagram: Illustrates the logical sequence and interrelationships betweenvarious control functions and
interlocks.
Causeand Effect Diagram: Defines the relationships between specificcauses (inputs) and their resulting
effects (outputs) within the control system.
Instrument Location Layout: Shows the physical placement of instruments within the plant or facility.
Control System Architecture Diagram: Depicts the overall structure of the control system, including
hardware and softwarecomponents.
Instrument Tray Layout: Details the routing and layout of instrument cable trays.
As-Built Drawings: Documentation reflecting the final, installed configuration of the syst
Instrumentation Document
127.
Data Sheet &Equipment List
Instrument Index (MasterTag List): A comprehensive list of all instruments in a project, with their
associated tag numbers and information.
I/O List: Lists all input and output points for a control system.
Cable Schedule: Details the types, quantities, and routing of all cablesused in the instrumentation system.
Junction Box (JB) Schedule: Lists all junction boxes, their locations, and terminal arrangements.
Instrument Data Sheet: Provides specificprocess conditions and performance requirements for individual
instruments.
Control Narrative: A written description of how a process is controlled and how different control loops and
systems interact.
InstrumentationSpecifications: Documents defining the standards, quality, and technical requirements for
instrumentation.
Bill of Materials(BOQ): A list of all materials and components required for the instrumentation system.
em.
Installationand Maintenance Procedures: Manuals and checklists for the installation, testing, and upkeep
of instruments
Instrumentation Document
128.
Oil and gasinstrumentation is governed by standards from organizations like API, ISA, ASME, ISO, and IEC. Key
standards include ISA 5.1 for symbol identification, ISA S84.01 for safety instrumented systems, API 520 for pressure relief
systems, and various ASME standards (like B31.3) for piping. General guidelines cover instrument protection, enclosure
requirements (like IP ratings), and installation practices for hazardous areas.
Key Standards Organizations:
American Petroleum Institute(API): Developsstandards for instrument design and construction in the oil and
gas industry, such as API 520 for pressure relief systems.
Instrumentation, Systems, and AutomationSociety (ISA): A leading organization for instrumentation and
control standards, including symbol identification (ISA 5.1) and safety systems (ISA S84.01).
American Societyof Mechanical Engineers (ASME): Provides codes for mechanical aspects, such as piping (e.g.,
ASME B31.3 for process piping)and pressure vessels.
International Organization for Standardization(ISO): Publishes international standards relevant to the oil and
gas sector, such as those for offshore installations and fire safety (e.g., ISO 13702).
International Electrotechnical Commission(IEC): Focuses on electrical and electronic standards, including for
hazardous areas and industrial equipment (e.g., IEC 60079-2).
Ingress Protection (IP): Instruments typicallyneed an IP rating (e.g., IP 65 or better) to prevent dust and water
ingress, especiallyin harsh offshore environments.
HazardousAreas: Electrical equipment must meet standards for hazardous locations to prevent ignition, such as
NFPA standards and ISA standards like those for flameproof or encapsulated equipment (ISA S12.22.01, ISA S12.23.01).
Industry Standards Compliance
129.
Oil and gasinstrumentation is governed by standards from organizations like API, ISA, ASME, ISO, and IEC. Key
standards include ISA 5.1 for symbol identification, ISA S84.01 for safety instrumented systems, API 520 for pressure relief
systems, and various ASME standards (like B31.3) for piping. General guidelines cover instrument protection, enclosure
requirements (like IP ratings), and installation practices for hazardous areas.
Key Standards Organizations:
American Petroleum Institute(API): Developsstandards for instrument design and construction in the oil and
gas industry, such as API 520 for pressure relief systems.
Instrumentation, Systems, and AutomationSociety (ISA): A leading organization for instrumentation and
control standards, including symbol identification (ISA 5.1) and safety systems (ISA S84.01).
American Societyof Mechanical Engineers (ASME): Provides codes for mechanical aspects, such as piping (e.g.,
ASME B31.3 for process piping)and pressure vessels.
International Organization for Standardization(ISO): Publishes international standards relevant to the oil and
gas sector, such as those for offshore installations and fire safety (e.g., ISO 13702).
International Electrotechnical Commission(IEC): Focuses on electrical and electronic standards, including for
hazardous areas and industrial equipment (e.g., IEC 60079-2).
Ingress Protection (IP): Instruments typicallyneed an IP rating (e.g., IP 65 or better) to prevent dust and water
ingress, especiallyin harsh offshore environments.
HazardousAreas: Electrical equipment must meet standards for hazardous locations to prevent ignition, such as
NFPA standards and ISA standards like those for flameproof or encapsulated equipment (ISA S12.22.01, ISA S12.23.01).
Industry Standards Compliance
130.
Instrumentation system safetyinvolves designing systems to detect hazards and perform automated shutdowns (Safety
Instrumented Systems - SIS) to prevent accidents, while environmental considerations include using instruments for
compliance, monitoring emissions, and preventing pollution. Key practices include conducting thorough risk assessments,
selecting certified equipment for hazardous areas, performing regular maintenance and calibration, providing comprehensive
personnel training, using appropriate Personal Protective Equipment (PPE), and implementing backup systems to ensure
reliability and continuous safe operation
Safety Considerations:
Risk Assessment: Identify potential process hazards and risks to determine the necessary safety integrity level (SIL) for the
instrumentation.
HazardousArea Classification: Determine and label hazardous areas to ensure that instruments and electrical equipment
are certified for use in those zones, such as those with flammablematerials.
Safety Instrumented Systems (SIS): Implement automated systems that can detect abnormal process conditions and
initiate safety actions, such as shutting down the process, to prevent hazardous situations.
Equipment Selection: Choose sensors, logicsolvers, and final elements that are appropriate for the applicationand meet
relevant safety standards (e.g., ATEX, IECEx, UL).
Redundancy: Install redundant instruments for critical safety functions to ensure continuous operation and safetyeven if
one component fails.
Personnel Training: Train operators and technicians to correctly use, interpret, and maintain instrumentation, especially
in hazardous environments.
Protective Measures: Ensure personnel wear appropriate PPE, like insulated gloves and safety glasses, to protect against
hazards such as electric shock or flying debris.
8.Safety and Environment Consideration
131.
Environmental Considerations:
Compliance:Use instrumentation to monitor process variablesand ensure adherence to environmental regulations.
Emissions Monitoring: Employ instruments to continuously monitor air and water emissions to control pollution and
prevent environmental damage.
Pollution Prevention: Implement robust instrumentation systems that can detect potential environmental releases and
trigger corrective actions to minimize their impact.
Data for Proactive Management: Utilize accurate data from instruments to develop proactive environmental management
strategies and improve overall environmental performance.
System Design: Incorporate environmental considerations from the initial design phase to minimize negative impacts
during the system's lifecycle.
8.Safety and Environment Consideration