Downloaded 96 times
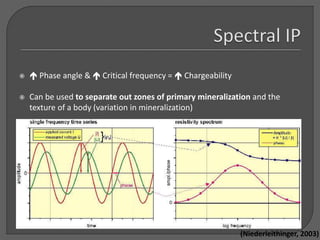

![ Use of spectral IP & Dipole-Dipole
Low FE = core of deposit (Potassic)
• Highly resistive core (potassic)= high apparent
resistivity
• High apparent resistivity = low Fe [(p0-p1)/p1]
High MF = high M = pyrite halo
Economic ore likely occurs between
Potassic and Phyllic zone (potassic core
has little sulfides, phyllic zone has high
sulfide due to pyritization)
200 million tons of 0.45% Cu
(Berger, 2008)](https://image.slidesharecdn.com/08322347-bd1b-48f2-93b7-1d727e31188c-150709060414-lva1-app6891/85/Induced-Polarization-Presentation-9-320.jpg)
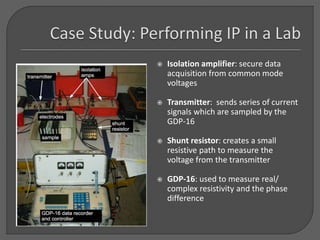
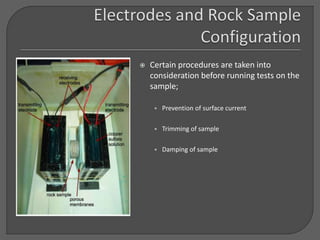


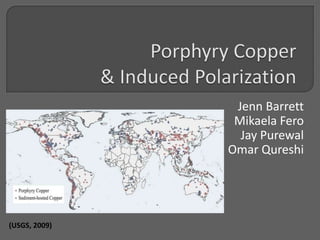
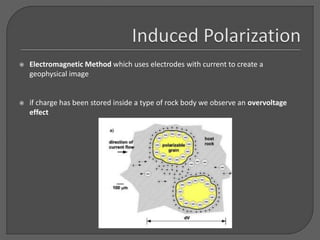
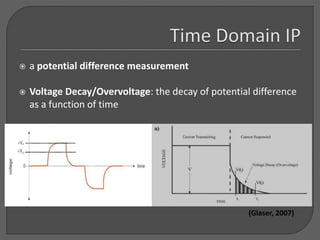
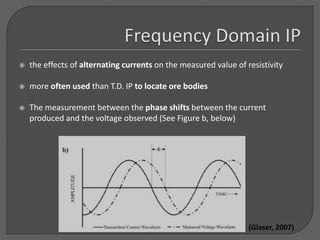
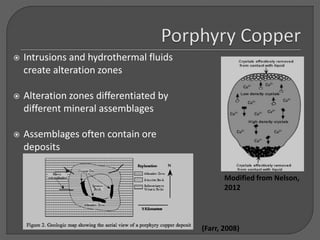
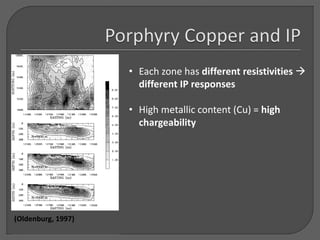
This document provides an overview of induced polarization (IP) surveying techniques for mapping porphyry copper deposits. It describes how IP uses electrical current to measure the resistivity and conductivity of rock bodies, which can help differentiate rock zones with varying mineral assemblages and locate ore deposits. Specifically, it outlines how spectral IP and dipole-dipole arrays are useful for mapping potassic cores and pyrite halos in porphyry systems. The document also gives examples of how certain IP parameters like phase angle and chargeability relate to mineralization.


