1. Geophysical Prospecting, 2016 doi: 10.1111/1365-2478.12363
Deep massive sulphide exploration using 2D and 3D geoelectrical and
induced polarization data in Skellefte mining district, northern Sweden
Saman Tavakoli∗
, Tobias E. Bauer, Thorkild M. Rasmussen, Pär Weihed
and Sten-Åke Elming
Division of Geosciences and Environmental Engineering, Luleå University of Technology, 971 87, Luleå, Sweden
Received January 2015, revision accepted October 2015
ABSTRACT
Geoelectrical and induced polarization data from measurements along three profiles
and from one 3D survey are acquired and processed in the central Skellefte District,
northern Sweden. The data were collected during two field campaigns in 2009 and
2010 in order to delineate the structures related to volcanogenic massive sulphide
deposits and to model lithological contacts down to a maximum depth of 1.5 km. The
2009 data were inverted previously, and their joint interpretation with potential field
data indicated several anomalous zones. The 2010 data not only provide additional
information from greater depths compared with the 2009 data but also cover a
larger surface area. Several high-chargeability low-resistivity zones, interpreted as
possible massive sulphide mineralization and associated hydrothermal alteration, are
revealed. The 3D survey data provide a detailed high-resolution image of the top
450 m of the upper crust around the Maurliden East, North, and Central deposits.
Several anomalies are interpreted as new potential prospects in the Maurliden area,
which are mainly concentrated in the central conductive zone. In addition, the contact
relationship between the major geological units, e.g., the contact between the Skellefte
Group and the Jörn Intrusive Complex, is better understood with the help of 2010
deep-resistivity/chargeability data. The bottommost part of the Vargfors basin is
imaged using the 2010 geoelectrical and induced polarization data down to 1-km
depth.
Key words: Skellefte District, Induced polarization, Volcanogenic massive sulphide,
Resistivity imaging, Petrophysical data.
INTRODUCTION
The Skellefte mining district in northern Sweden hosts ap-
proximately 80 known volcanogenic massive sulphide (VMS)
deposits (Fig. 1; Kathol and Weihed 2005). Currently, five
VMS deposits are mined in the area: Kristineberg, Renström,
Kankberg, Maurliden West, and Maurliden East, producing
Zn, Cu, Pb, Ag, Te, and Au (Fig. 1). In addition, an orogenic
gold deposit (Au) is mined at Björkdal.
∗E-mail: saman.tavakoli@ltu.se
The economic importance of the area led to numerous
geological and geophysical activities in order to understand
its geological evolution and hence targeting new ore deposits
(Padget, Ek, and Eriksson 1969; Allen, Weihed, and Svenson
1996; Weihed 2010; Bauer et al. 2011, 2013; Dehghannejad
et al. 2012; Skyttä et al. 2012; Tavakoli, Elming, and Thune-
hed 2012b; Tavakoli et al. 2012a; Garcı́a Juanatey 2012). A
general need to explore and map structures at larger depth,
e.g., down to 5 km, is discussed in de Kemp et al. (2011)
and Tavakoli et al. (2012a, b). This interest in studying deeper
targets led to several joint geophysical studies (e.g., Malehmir
et al. (2007); Hübert et al. (2009); Malehmir, Thunehed, and
1
C
2016 European Association of Geoscientists Engineers
2. 2 S. Tavakoli et al.
Figure 1 Simplified geological map of the Skellefte district and surroundings (modified after Kathol et al. 2005).
Tryggvason (2009); and Tavakoli et al. (2012a, b)), which
were successful in detecting high strain zones related to the
sulphide mineralization and visualizing lithological contacts.
Geoelectrical surveys with subsequent data inversion have
previously succeeded in visualizing complicated subsurface
geometries (Wong and Strangway 1981; Li and Oldenburg
2000; Magnusson, Fernlund, and Dahlin 2010; Commer et al.
2011) and are considered as a relatively new but useful tech-
nique in mineral exploration (Phillips et al. 2001), particularly
in the areas where resistivity contrast in the lithologies is sig-
nificant (Sultan et al. 2009).
A geoelectrical/induced polarization (IP) campaign in the
central Skellefte District was conducted in 2009 along two
sub-parallel profiles I and II to model the subsurface geology
around the Vargfors basin (Fig. 2; Tavakoli et al. 2012b). The
success of this campaign in detecting three highly conductive
zones (Tavakoli et al. 2012b) and the high demand to target
the ore at greater depths was the main motivation for con-
ducting the new 2010 geoelectrical/IP field work to study the
ore-hosting structures.
This study presents the results from geoelectrical/IP field
campaign in 2009 and 2010 (profiles I, II, and E-1) and mod-
elling and interpretation of a 3D geoelectrical /IP measure-
ments in the Maurliden area (Fig. 2). The 2009 (2D) and
2010 (2D and 3D) geoelectrical/IP data are then integrated to
check for eventual correlations between different data.
Malmqvist (1978) utilized the IP method to differ-
entiate between mineralization types in northern Sweden.
C
2016 European Association of Geoscientists Engineers, Geophysical Prospecting, 1–18
3. Sulphide exploration in Skellefte District, Sweden 3
Figure 2 Geological description of the central Skellefte District around the geoelectrical/IP profiles and the Vargfors basin. Location of the drill
holes near the study area and their lithological description are integrated on the map (modified after Bauer (2010) and Tavakoli et al. (2012b)).
Although the co-occurrences of graphitic schist with sul-
phide mineralizations, both indicating a high-chargeability
signature, often mask the related massive sulphide deposit
(Salmirinne and Turunen 2007), the IP method is the best
proven technique to differentiate between these two (Padget
et al. 1969). Therefore, even if the geoelectrical/IP techniques
do not entirely succeed to directly detect the VMS ore, they
are still capable of delineating the ore-bearing horizons and
high-strain zones, hence aiding mineral exploration (Olden-
burg et al. 1998).
This study thus aims at (i) integrating 2D geoelectrical/IP
data from 2009 and 2010 to verify and improve the present
understanding of the subsurface resistivity/chargeability dis-
tribution and also to detect ore-bearing high-strain zones (cf.,
Sandrin and Elming 2007) in the central Skellefte District;
(ii) better understanding the contact relationship between ma-
jor lithological units and confirming or otherwise improving
previous interpretations using shallow resistivity/chargeability
data; (iii) investigating the possibilities for detecting new min-
eralizations at greater depths (down to 1.5-km depth) along
profile E-1; and finally (iv) modelling and interpreting the
3D geoelectrical/IP response of the Maurliden mineralization
system within the top 450 m of the crust to prospect new
mineralization and to delineate the geometry of the known
Maurliden deposits.
GEOLOGICAL SETTING
The metasedimentary Bothnian Supergroup to the south of
the Skellefte District is suggested to form the basement to the
lowest stratigraphical unit in the study area, the 1.9 Ga–1.88
Ga Skellefte Group (Billström and Weihed 1996; Montelius
2005; Skyttä et al. 2011; Skyttä et al. 2012). The Skellefte
Group is composed of mainly felsic volcanic and volcaniclas-
tic rocks (Allen et al. 1996) and is overlain conformable to
unconformable by the mainly sedimentary Vargfors Group
(Allen et al. 1996; Bauer et al. 2011). The lowermost parts of
Vargfors Group are dominated by turbiditic mudstones and
sandstones and monomict conglomerates located throughout
the study area, whereas the upper parts of the stratigraphy
are dominated by polymict conglomerates restricted to the
Vargfors basin in the northern part of the central Skellefte
District (Bauer et al. 2013). Intrusive rocks in the study area
are dominated by the 1.89–1.87 Ga early-orogenic Jörn-type
C
2016 European Association of Geoscientists Engineers, Geophysical Prospecting, 1–18
4. 4 S. Tavakoli et al.
intrusive rocks (Wilson et al. 1987; González-Roldán 2010;
Skyttä et al. 2011).
Structures in the study area are characterized by a distinct
pattern of NNW–SSE striking normal faults and NE–SW strik-
ing transfer faults that formed during crustal extension (Bauer
et al. 2011; Skyttä et al. 2012). Volcanogenic massive sul-
phide deposits in the Skellefte District formed as sub-seafloor
replacement within volcaniclastic sediments in the uppermost
parts of the Skellefte Group stratigraphy (Allen et al. 1996).
Allen et al. (1996) and Bauer et al. (2013) inferred that the
ore-forming hydrothermal fluids utilized the syn-extensional
faults as fluid conduits and the ore-forming minerals precipi-
tated in the vicinity of these faults.
METHOD AND RESULTS
The geoelectrical measurements (often loosely referred as re-
sistivity measurements) are conventionally conducted by in-
jecting a direct current or a low-frequency alternating current
(I) into the ground through two metallic electrodes (current
electrodes). The resulting potential distribution (φ) is then
measured by means of two additional electrodes (potential
electrodes; Parasnis 1997). The potential difference is then
measured, and results are presented as apparent resistivities.
The same electrode configuration is used to acquire both ap-
parent resistivity and induced polarization (IP) data. The time-
domain IP phenomenon is the cause of the voltage decay after
current turn-off. When the transmitted current to the ground
is switched off, the measured potential difference starts to de-
cay to zero. The decay is either related to (i) presence of the
clay minerals in the rock or sediment (membrane polarization)
or (ii) presence of the conductive minerals in rocks (electrode
polarization) such that the current flow is partly electrolytic
(through groundwater) and partly electronic (through the con-
ductive mineral). This effect is of particular interest in surveys
for metallic minerals such as disseminated sulphides.
In general, even low sulphide concentration such as por-
phyry copper mineralization and pyritic alteration, which is
related to some gold deposits, is likely to be well detected with
the IP method. Pyrite, pyrrhotite, and graphite, all regarded
as non-economical minerals, are among the most common
electronic conducting minerals; this may make the interpre-
tation of the IP data more complicated when targeting, e.g.,
volcanogenic massive sulphide (VMS) ore deposits (Madden
1985).
Simple geological problems can be imaged by 2D data.
However, where geological constraints are not sufficient or
geology is complex, 3D data are preferable, although the
3D field measurements are more costly and time consuming
(Storz, Storz, and Jacobs 2000; Phillips et al. 2001; Rutley,
Oldenburg, and Shekhtman 2001). Processing and interpreta-
tion of the 3D resistivity/IP data can be challenging, e.g., the
inversion algorithms for processing the 3D resistivity/IP data
allows the model resistivity values to vary in all three direc-
tions (x, y, and z), which is in contrast to the 2-D inversions
where the resistivity values vary in the x-and z-directions and
are constant in the y-direction. Moreover, inversion of the 3D
data is more time consuming compared with the conventional
2D data inversions as 3D surveys often involve a large number
of electrodes and measurements (Li and Oldenburg 2000).
All field measurements were carried out using the Scin-
trex IPR-12 time-domain resistivity/IP receiver that accepts
signals from up to eight potential dipoles simultaneously and
a Scintrex IPC7 2.5-kW transmitter (IPR-12 manual 1997).
Eleven time windows were simultaneously measured for each
dipole (between 50 ms and 1770 ms, and the widths of the
slices were 20 ms, 40 ms, 40 ms, 80 ms, 80 ms, 140 ms,
140 ms, 230 ms, 230 ms, 360 ms, and 360 ms). The receive
time was set to 2 seconds. The IP cycle time was 8 second, i.e.,
2s positive 2s off 2s negative 2s off.
The profiles were measured using a pole–dipole electrode
configuration with different approaches, i.e., fixed/variable
potential dipole lengths (Px-Py), fixed/variable current-
potential electrode distance (C1-P1), forward/forward–reverse
measurements, and 2D/3D survey (Fig. 3).
In IP surveys, the electromagnetic (EM) coupling between
the IP transmitter and receiver circuits can affect the mea-
sured data, particularly for surveys with great investigation
depths. However, the good horizontal coverage and higher
signal strength of the pole–dipole method, as well as its lower
EM coupling due to the separation of the circuitry of the cur-
rent and potential electrodes compared with other electrode
arrays, make this array attractive. Details on the electrode
configuration are provided in Table 1 and Fig. 3.
We followed three interpretation approaches: (i) shallow
2D models along profiles I and II; (ii) deeper 2D model along
profile E-1; and (iii) 3D model in an area nearby the Maurliden
deposits.
PROFILES I AND II
The 2009 data were collected and modelled by Tavakoli et al.
(2012b). Using a pole–dipole array, the survey was carried
out in such a way that geological features with a lateral exten-
sion (d) 100 m could be mapped down to 430 m in depth
(Table 1; Fig. 3a; Tavakoli et al. 2012b). To reduce the
C
2016 European Association of Geoscientists Engineers, Geophysical Prospecting, 1–18
5. Sulphide exploration in Skellefte District, Sweden 5
Figure 3 Electrode arrays for the 2D and 3D
field surveys. (a) Pole–dipole electrode configu-
ration for profiles I and II. (b) Example of two
dipole configurations of the pole–dipole array
for profile E-1; two receiver groups (RG1 and
RG2) were located 0.4 km apart. (b-I) The re-
mote current electrode C1 is located 0.4 km apart
from the closest potential electrode in the begin-
ning of the survey; the dipoles are connected ac-
cordingly to ensure an even coverage at shallow
and greater depths. (b-II) The current electrode is
placed between potential electrodes; the dipoles
are connected accordingly. (c) Pole–dipole elec-
trode configuration for 3D field survey; potential
electrodes are located 0.4 km apart, and the cur-
rent electrodes form a grid of 0.2 km × 0.4 km.
survey time and, therefore, additional costs, the measure-
ments for profiles I and II were conducted only in a for-
ward direction. The inversions of profiles I and II were car-
ried out using Res2Dinv (Loke 2012) with standard least
square method. Inversions of profiles I and II are summa-
rized after Tavakoli et al. (2012b), and the raw and in-
verted sections are shown in Figs. 4a, 4b, 6a, and 6b. The
result provided a high-resolution image of the subsurface
down to 430-m depth, and three alteration halos, which
can be associated with mineralization (e.g., Norrliden-N de-
posit) were outlined along profile I (Fig. 6a-I and 6a-II).
Besides, a zone with high conductivity was indicated along
profile II at x = 1 km–1.7 km with an upper boundary at
400-m depth and continuing downwards (Fig. 6b-II). For de-
tails on acquisition and inversion, see Tavakoli et al. (2012b).
PROFILE E-1
In order to image the spatial relationship between key geo-
logical units and to better understand the spatial patterns of
potential VMS hosting structures at greater depths, a geoelec-
trical survey was performed in 2010 to extend profile II to
the SW, as well as re-measuring profile II using a multiple-
electrode array (profile E-1; Fig. 2 and Fig. 3b-I and 3b-II).
C
2016 European Association of Geoscientists Engineers, Geophysical Prospecting, 1–18
6. 6 S. Tavakoli et al.
Table
1
Characteristics
of
the
2009
and
2010
field
surveys.
Dipole
Number
of
Actual
Effective
Current
Survey
Length/Surface
Electrode
length
Potential
Measured
Year
C1-C2
investigation
interpretation
injected
IP
domain
profiles
coverage
area
(km)
array
(km)
electrodes
(P)
data
measured
(km)
depth
(km)
depth
(km)
(mA)
(mS/S)
(I
and
II)
P
(I)=
6.8
P
(II)=5.6
Pole-dipole
0.2-0.4
5
Res
+
IP
2009
3
0.8
0.43
400-1600
Time
(E-1)
(E-1)
=
10
Pole-dipole
0.2-0.8
16
Res
+
IP
2010
6
2.2
1.5
150-2300
Time
3D
3.36
km
2
from
which
2.16
km
2
covers
the
interpretation
area
Pole-dipole
0.4-1.1
18
Res
+
IP
2010
4.6
0.45
0.45
500-2600
Time
Profile E-1 provides (i) a deeper image (down to 1.5 km) and
a longer lateral coverage than profile II; (ii) a nearly parallel
profile to profile I to correlate anomalies that occur between
the two profiles to gain a better understanding of the geome-
try and spatial distribution of the high-chargeability anomaly
in profile II (Tavakoli et al. 2012b); and finally (iii) remove
or decrease in the asymmetrical anomaly shape, which can
be caused by the pole–dipole method by using forward and
reverse measurements.
Data acquisition
As a basic setting for the pole–dipole method, the grounding
of the remote (fixed) current electrode (C2) was set at 6 km
from the moving electrode (C1) (Fig. 3b-I). The data were mea-
sured using an IPR-12 receiver (IPR-12 manual 1997) in the
field. One to eight potential dipoles were measured simultane-
ously. Input impedance was set to 16 M, and chargeability
can be detected within the range of 0 mV/V–300 mV/V. Two
groups of receivers consisting of potential electrodes (RG1
and RG2; Fig. 3b-I and 3b-II) were located 400 m apart
(Table 1). Each group of receivers encompassed eight poten-
tial electrodes with 200-m separation, making the total length
of each dipole group 1.4 km (Fig. 3b). In contrast to the shal-
low 2D-measurement conducted in 2009, electrode C1 did not
maintain a fixed distance to the potential dipoles; instead, C1
was moved between the dipoles. The dipole length was varied
between 200 m and 800 m. The specific electrode configura-
tion used in this survey gives a maximum penetration depth of
2.2 km, from which the top 1.5 km has better data coverage.
We restrict the interpretation down to the 1.5-km depth. The
data coverage zones and pseudosections of the resistivity and
chargeability data for profile E-1 are shown in Fig. 5.
Data processing
Inverse modelling of the direct-current resistivity and IP data
for profile E-1 was carried out using Res2Dinv (Loke 2012).
The standard least square inversion was used, which attempts
minimizing the square of difference between the measured and
calculated apparent resistivities. According to Sasaki (1992),
the inversion with smoothness constraints is not very sensitive
to Gaussian noise as long as the damping factor is properly
chosen according to the noise level. However, for datasets
where the noise comes from non-random source human mis-
takes or instrument problems, this criterion is less satisfactory.
Res2Dinv allows the users to apply the smoothness constraints
to the model providing a so-called smoothness-constrained
C
2016 European Association of Geoscientists Engineers, Geophysical Prospecting, 1–18
7. Sulphide exploration in Skellefte District, Sweden 7
Figure 4 Apparent resistivity/IP pseudosections of 2009 profiles I and II. (a-I) Data coverage for profile I down to 0.8 km and location of the
current and potential electrodes during the survey. (a-II) Resistivity pseudosection of profile I. (a-III) IP pseudosection of profile I. (b-I) Data
coverage for profile II down to 0.8 km and location of the current and potential electrodes during the survey. (b-II) Resistivity pseudosection of
profile II. (b-III) IP pseudosection of profile II.
least square inversion, which is based on the following equa-
tions (equations (1) and (2); Loke 2012):
(JT
J + λF) qk = JT
g − λFqk, (1)
where
F = αxCT
x Cx + αzCT
z Cz, (2)
where J in equation (1) denotes the Jacobian matrix of partial
derivatives, JT
is the transpose of J, and λ is the damping (Mar-
quardt) factor. Parameters q and g stand for the model change
vector and the data misfit vector, respectively. In equation
(2), Cx and Cz represent the horizontal and vertical roughness
filters, respectively, and αx and αz are the relative weights
given to the smoothness filters in the x- and z-directions.
The inversion enables users to adjust the damping
factor and roughness filters to suit different types of data
with different qualities. The optimization method tries to
reduce the difference between the calculated and measured
apparent resistivity values by adjusting the resistivity of the
model blocks subject to the smoothness constraints used.
A common way to measure this difference is to use the
root-mean-squared (RMS) error.
We applied smoothness constraint on both model change
vector and model resistivity values in order to get a smoother
variation in the resistivity values. Also, the damped least
C
2016 European Association of Geoscientists Engineers, Geophysical Prospecting, 1–18
8. 8 S. Tavakoli et al.
Figure 5 Apparent resistivity/IP pseudosections of 2010 profile E-1 and location of the current and potential electrodes during the survey. (a)
Combined forward and reverse measurement’s data coverage. (b-I) Forward resistivity measurement pseudosection of profile E-1 down to 2.2
km. (b-II) Forward IP measurement pseudosection of profile E-1 down to 2.2 km. (c-I) Reverse resistivity measurement pseudosection of profile
E-1 down to 2.2 km. (c-II) Reverse IP measurement pseudosection of profile E-1 down to 2.2 km.
C
2016 European Association of Geoscientists Engineers, Geophysical Prospecting, 1–18
9. Sulphide exploration in Skellefte District, Sweden 9
Figure 6 The 2D resistivity/IP models after inversion. (a-I) Resistivity depth section of profile I down to 0.43 km. (a-II) IP depth section of
profile I down to 0.43 km. (b-I) Resistivity depth section of profile II down to 0.43 km. (b-II) IP depth section of profile II down to 0.43 km.
(c-I) Resistivity depth section of profile E-1 down to 0.43 km. (c-II) IP depth section of profile E-1 down to 1.5 km. (c-III) The modelled geology
depth section of profile E-1 based on resistivity and IP interpretations.
square method combined with the smoothness constraint,
which is expected to resolve structures where the width and
thickness are smaller than the depth, was applied. Accord-
ing to deGroot-Hedlin and Constable (1990), it is extremely
difficult to find a model that fits the data well if the data
errors are underestimated. Since the field data were proven
to be not completely noise-free by repeated measurements in
the field, we used relatively large values for the initial and
minimum damping factors. The best way to determine the
optimal damping factors is to try different damping factor
C
2016 European Association of Geoscientists Engineers, Geophysical Prospecting, 1–18
10. 10 S. Tavakoli et al.
values while other parameters remain unchanged (Sasaki
1992). After trying different values and running the inversion,
the initial and minimum damping factors were set to 0.12 and
0.03, respectively (the allowed range for the initial and mini-
mum damping factors in Res2Dinv is 0.05–0.25 and 0.01–0.1,
respectively).
Since the model did not indicate any irregular variation
in the resistivity values in the lower sections, we used the
default depth weighting factor of 1.05 to compensate for the
resolution loss at greater depths. We also allowed the program
to determine the depth weighting factor automatically, which
the resulting section was similar to when 1.05 was used. The
effects of the side blocks were slightly diminished to decrease
the effect of artefacts in the inversion result.
One can either choose to set a value for the RMS data
misfit or alternatively use the relative changes in the RMS
error between the last two iterations. The program will stop
after the model indicates RMS error less than this limit. A
common approach is to choose the model at the iteration after
which the RMS error change is insignificant (Loke 2012). In
this work, the relative changes in RMS error seems to be
somewhat small moving from iteration six to seven, which is
the reason that the model after the sixth iteration was selected
as the final model result, even though the maximum number
of iterations was set to 10. After six iterations, respective RMS
errors of 7.2%, and 5.8% were achieved for resistivity and IP
data.
Prominent anomalies
The resistivity and chargeability contrasts in the inverted
depth sections of profile E-1 delineate the contacts between fel-
sic and mafic Skellefte Group volcanic rocks, Vargfors Group
sedimentary rocks, and the Jörn intrusion (Fig. 6c). However,
detailed interpretation of the conductive zones, (e.g., graphitic
schist or VMS deposits) is better indicated in the IP data by
six high-chargeability zones labelled S1–S6 (Fig. 6c-II). To the
SW at approximate profile coordinate x = 0.6 km, a resistiv-
ity/chargeability contrast separates the sandstone–mudstones
(Vargfors Group) from felsic volcanic rocks (Skellefte Group)
(Fig. 6c). The significantly lower resistivity of the sandstone–
mudstone (4 km; Fig. 6c-I) compared with the resistivity
of the felsic volcanic rocks (11 km; Fig. 6c-I) is in agree-
ment with the corresponding resistivity measured on drill-core
samples in the laboratory (Tavakoli et al. 2012b). The IP data,
however, do not indicate any clear signature along this con-
tact. Further towards NE, a high-resistivity material located
between x = 0.7 km and 2.2 km (upper U1; Fig. 6c-I) is ei-
ther an indication of unaltered felsic volcanic rocks, which
according to Tavakoli et al. (2012b) underlie major parts of
the Vargfors basin in this part, or a layer of andesite/basalt
with high resistivity. The dominant lithology throughout pro-
file E-1 is felsic volcanic rocks.
One of the key lithological contacts in this study is the
contact between the Skellefte Vargfors Group. The relatively
conductive structure at x = 2.2 km with a SW dip (V2; Fig. 6c)
depicts the Vargfors Group sedimentary rocks. The underlying
felsic volcanic rocks of the Skellefte Group can be seen at x =
2.6–2.9, which is also confirmed by drill-hole GRB5 (Fig. 2).
Also, the Vargfors basin, with inhomogeneous resistivity (see
Tavakoli et al. 2012b), is imaged at x = 3.7 km–5.3 km (V3;
Fig. 6c).
V4, which is characterized by low resistivity and high
chargeability, forms a clear boundary with its surrounding
structures and can represent either a graphitic shale or alter-
ation halo that encompasses sulphide deposits and is most
pronounced between 0.5-km and 1-km depths (Fig. 6c).
Occurrences of the Skellefte Group basalts among the
Jörn igneous complex were already observed, indicating high
resistivities within the Jörn Intrusive rocks (Tavakoli et al.
2012b). Among the four phases of the Jörn intrusive complex
(Wilson et al. 1987), the older GI and GII phases, which are
cut by profile E-1, are predominantly composed of granodior-
ites, which is consistent with the resistivity and chargeability
values observed on profile E-1 and previous interpretations
by Tavakoli et al. (2012b).
3D DATA
Data acquisition
The 3D field survey was carried out using a grid of 56 cur-
rent electrode positions (7×8 electrodes; C1–C56; Fig. 3c) with
400 m×200 m spacing in the x- and y-directions, respectively.
Similar instruments as for profile E-1 were used in the 3D sur-
vey. Two groups of potential electrodes, each consisting of
nine electrodes, were located 400 m apart from the neigh-
bouring potential electrodes in x- and y-directions (Table 1;
Fig. 3c). There are a number of repeated measurements in
each setting of the electrodes. The voltage difference between
different dipoles is measured against each current electrode.
For every current electrode (Cx), each group of potential elec-
trodes was set out in three different layouts, resulting in 54
measurements for each current electrode position. The fixed
C
2016 European Association of Geoscientists Engineers, Geophysical Prospecting, 1–18
11. Sulphide exploration in Skellefte District, Sweden 11
current electrode (C2) was set fixed 4.6 km apart from the
closest potential electrode. The 3D survey covers a total area
of approximately 3.36 km2
(2.4 km×1.4 km), from which the
interpretation area limits to 2.16 km2
(1.8 km×1.2 km), since
the outermost parts are poorly constrained by data compared
with the central parts.
Data processing
The 3D modelling was carried out using the University of
British Columbia-Geophysical Inversion Facility (UBC-GIF)
inversion code developed by Oldenburg and Li (1994). De-
tails about the 3D inversion of induced polarization data are
further explained by Li and Oldenburg (2000). The cell sizes
were chosen to 30 m×30 m in horizontal directions and 15 m
in vertical direction at the surface. The vertical cell size grad-
ually increased downwards. Padding cells were added outside
the investigated volume. Data errors were specified for the re-
sistivity data (current-on potential difference) as 0.15 mV and
for the chargeability data (current-off potential difference) as
0.02 mV. The data errors had to be specified as rather high to
ensure convergence during inversion. The alphas (as, ax, az)
in the UBC-GIF code indicate the direction along which the
maximum smoothness will be applied. If one of the alphas
is chosen to be very small, then its corresponding function
will contribute little to the minimization of the model ob-
jective function (Li and Oldenburg 1994). In other words,
reducing the size of as will result in smoothness in the x- and
z-directions. Considering the ratio between the alpha values as
as/ax and as/az, the larger ratios imply that smoothness in the
respective directions will increase. In other words, if the two
alpha ratios become much larger than 1, the structure in the
model is punished, and if these ratios are close to zero, then
the smallest term dominates. To estimate reasonable values
for the alphas, the square root of the following ratios between
alphas can be considered as length scales (equations (3) and
(4); Lx and Lz):
Lx =
ax
as
, (3)
Lx =
az
as
. (4)
One should choose Lx to be larger than the shortest ar-
ray separation. The total width of the mesh should be there-
fore larger than Lz and Lx. Also, Lz and Lx should them-
selves be larger than the mesh cell width. We therefore applied
smoothing by setting the length scales to 120 m horizontally
and 150 m vertically.
The resulting conductivity model was then used to con-
struct a reference model for the chargeability inversion. The
constraint set from the reference model was quite loose and
was mainly applied to guide the inversion algorithm toward
a solution where high-chargeability volumes should be pre-
ferred in volumes of low resistivity. The achieved RMS er-
rors for 3D resistivity and IP data were 1.6% and 1.8%,
respectively.
Prominent anomalies
A number of inhomogeneities were observed in the upper
parts of the resistivity model but are probably inversion arte-
facts; hence, the top 50 m of the model is excluded from
interpretation. Moreover, closer to the corners of the model,
the inversion might have produced artefacts, which will not
be interpreted due to the poor data coverage and therefore
have not been considered in the interpretations.
The Maurliden domain is host to various ore mineral-
izations, from massive to vein style deposits, which occur
sporadically within the coarse grain rhyolitic rocks of the
Skellefte Group (Claesson and Isaksson 1981a, b). A cen-
tral conductive zone has been identified in the central part of
the 3D model (CCZ; Fig. 7). This zone extends from close
to the surface down to 300 m in depth (Fig. 7a–7f). Two
of the Maurliden deposits (Maurliden East and Central) are
located within or close to this conductive zone (M-ii and M-
iii; Fig. 7). Thus, M-ii and M-iii are likely to represent the
alteration halos embedding these deposits. The model region
nearby the Maurliden North deposit does not indicate any
substantial resistivity signature, whereas low resistivities are
expected due to the presence of the deposits as in M-ii and
M-iii. Thus the unexpected high resistivity of M-i (50 km)
can imply that, unlike Maurliden East and Maurliden Central,
the Maurliden North deposit is not surrounded by similar ex-
tent of alteration halo, or if it does, its dimension is smaller
than what the present 3D study can detect. In chargeability
models, M-i is collocated with an intermediate chargeability
response (20 mV/V), down to 200 m in depth, which is con-
sistent with the geometry of the Maurliden North (profiles II–
II’; Montelius et al. 2007). Maurliden East, which is modelled
based on the drill-core logging of the deposits and detailed
mapping in the Maurliden domain along profiles II–II’ (Mon-
telius et al. 2007), coincides with a relatively conductive zone
(2 km–4 km; Fig. 7) and extends down to 200 m in depth
C
2016 European Association of Geoscientists Engineers, Geophysical Prospecting, 1–18
12. 12 S. Tavakoli et al.
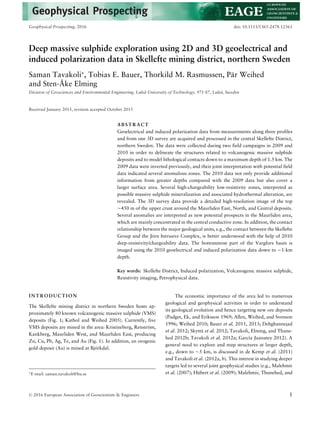
Figure 7 Resistivity depth slices from 3D model at (a) 50-m depth, (b) 100-m depth, (c) 150-m depth, (d) 200-m depth, (e) 250-m depth, (f)
300-m depth, (g) 400-m depth, and (h) 450-m depth. The horizontal dimensions of the Maurliden ore bodies are plotted in black on top of each
depth slice. Main anomalies have been labelled and are explained in the text.
(M-ii; Fig 7). However, the modelled depth extent of this de-
posit based on resistivity is slightly greater than the modelled
depth extent (75 m) along profiles II–II’ in the study by
Montelius et al. (2007). The extension of the conductive zone
toward the west of M-ii is a possible westward elongation of
this mineralization. However, the IP result reveals that M-ii is
mainly associated with low chargeability (10 mV/V), which
is well below the usual chargeability of the VMS deposits
in the Skellefte District (Tavakoli et al. 2012b). The Central
Maurliden deposit (M-iii), which is located within the west-
ernmost part of the central conductive zone (CCZ; Fig. 7),
indicates a resistivity of 1 km. M-iii reflects the largest
depth extent among the known Maurliden deposits inside the
3D frame (Fig. 7). In the chargeability model, M-iii indicates
a high-chargeability and high-conductivity signature, which
continues from the uppermost parts of the model sections
down to 450 m. Apart from the conductive zones related
to the Maurliden East and Central deposits, the conductivity–
chargeability anomalies labelled N-i, N-ii, and N-iii (Fig. 7)
all indicate high-conductivity responses. Their consistent and
relatively low resistivities ( 2 km) throughout the modelled
depth are similar to the resistivity response of the Maurliden
Central deposit (Fig. 7) down to 300 m in depth and even
further. Their resistivities are also comparable with the resis-
tivity of the sulphide mineralizations measured on drill-hole
samples (Tavakoli et al. 2012b).
Anomalies N-i, N-ii, and N-iii (Fig. 8) all indicate a rel-
atively high IP response ( 27 mV/V–70 mV/V; Fig. 8) and
continue down to 450 m in depth except for N-iii, whose high
chargeability does not extend further than 250 m in depth,
C
2016 European Association of Geoscientists Engineers, Geophysical Prospecting, 1–18
13. Sulphide exploration in Skellefte District, Sweden 13
Figure 8 IP depth slices from 3D model at (a) 50-m depth, (b) 100-m depth, (c) 150-m depth, (d) 200-m depth, (e) 250-m depth, (f) 300-m
depth, (g) 400-m depth, and (h) 450-m depth. The horizontal dimensions of the Maurliden ore bodies are plotted in black on top of each depth
slice. Main anomalies have been labelled and are explained in the text.
although it might continue further dipping toward N–NW
(Fig. 8f, 8g, and 8h). Therefore these three anomalies can be
an indication of hitherto unknown mineralization zones in the
Maurliden area.
DISCUSSION AND INTERPRETATION
Physical property of rocks
Rock resistivity is a product of differences in chemical prop-
erties of the pore water, structure of pore volume, type and
amount of minerals, and grain sizes (Nelson and Van Voorhis
1983; Kemna et al. 2000; Kneisel 2006). By investigating the
resistivity of the rocks from laboratory measurements, one
can convert and interpret the models in terms of rock type.
Tavakoli et al. (2012b) studied the physical properties
of 154 drill-core samples from the central Skellefte District
to constrain the interpretation of the geoelectrical and in-
duced polarization (IP) field data. Chargeability is of par-
ticular interest in this study due to the capability of the IP
technique to detect minor concentrations of highly conduc-
tive metallic minerals, which can be missed in the resistiv-
ity model (Malmqvist 1978; Loke 2012). In this study, we
used resistivity/chargeability to qualitatively compare the val-
ues between the modelled field data and laboratory data.
High-chargeability response may be detected in layered sili-
cates, clays, metallic minerals, organic materials and carbon-
rich deposits, and other iron-rich minerals such as ilmenite
and hematite (Zonge, Wynn, and Urquhart 2005). However,
according to Magnusson et al. (2010), there are additional
C
2016 European Association of Geoscientists Engineers, Geophysical Prospecting, 1–18
14. 14 S. Tavakoli et al.
factors that can control the chargeability within a certain rock,
such as the surface area of the metallic grains (an increased
surface area increases the IP response), shape of the pores, and
the degree to which the pores are interconnected. According
to Parasnis (1997), the latter factor is the main cause for a
wide variation of resistivity/chargeability in, e.g., granite and
basalts. Earlier studies proved successful in utilizing the resis-
tivity/chargeability laboratory data to differentiate the min-
eralization from host rocks (Basokur et al. 1997; Tavakoli
et al. 2012b). Petrophysical data in this study are used for
qualitative comparison with the resistivity/chargeability val-
ues derived from field data based on the study conducted by
Tavakoli et al. (2012b). The resistivity and chargeability val-
ues for different geological structures in this study are relative
and correct only for this specific study area; therefore, they
can be considered as either high or low elsewhere.
Vargfors Group
The resistivity and chargeability model from profile E-1 im-
plies that Vargfors Group conglomerate (V2) dips to the SW
and extends at depth down to 400 m (V2; Fig. 6c-III). The
low resistivity of V1 (1 km) compared to the rest of con-
glomerate outcropping along profile (E-1) and also compared
to the typical resistivity of the Skellefte District conglomerates
based on petrophysical studies (4.8 km; Tavakoli et al.
2012b) can be attributed to differences in mineral content
and/or high porosity.
The Vargfors basin is modelled by an inhomoge-
neous structure represented by both high- and low-
resistivity/chargeability values (V3; Fig. 6c). Tavakoli et al.
(2012b) suggest that the Vargfors basin close to its northern
contact with Skellefte Group felsic volcanic rocks is composed
of two distinct sedimentary rock types, i.e., a highly resistive
sandstone in the SW and a conductive part (unspecified sedi-
mentary rocks) to the NE, which is also supported by the new
result from profile E-1. Moreover, the prominent IP anomaly
(S3; Fig. 6c-II) along profile E-1 can depict a pyrrhotite or a
graphitic schist. According to both resistivity and IP results,
the Vargfors basin in this part of profile E-1 has a depth extent
of 1 km (Fig. 6c-III).
Skellefte Group
Felsic volcanic rocks of the Skellefte District underlie the
Vargfors basin to the SW and the Jörn Intrusion in the NE
of profile E-1. The contact between felsic volcanic rocks of
the Skellefte District and the embedding rocks is consistently
seen in both resistivity and chargeability data (Fig. 6c). Large
dipole separations or low frequency of the transmitted cur-
rent in some parts can produce large areas with low resistivity
(Caglar 2000), which can be observed in the pseudosection
over the felsic volcanic rocks (Fig. 5b-I and 5c-I). Mafic vol-
canic rocks of the Skellefte Group occur often as intercalation
of basalts along the contact between felsic volcanic rocks and
the Jörn granodiorites (Tavakoli et al. 2012a, b). Resistivity
and chargeability along profile E-1 indicate that upper parts
of the U2 can depict the basalts, which partly underlie the
outcropping felsic volcanic rocks and the Jörn granodiorite
and appear as high-resistivity and relatively high-chargeability
zones (Fig. 6c), whereas the lower part of U2 indicates a dif-
ferent signature that corresponds to basalt, andesite, or un-
altered Jörn granodiorite. The resistivity value of the upper
U2 (40 km) agrees well with their high-resistivity response
measured on drill-core samples (37.3 km; Tavakoli et al.
2012b).
Graphitic schist or alteration halo hosting sulphide
mineralization?
Anomaly V4 shares the boundary with the Vargfors basin to
the SW and depicts a tectonic contact (e.g., a SW trending
fault). Owing to its great depth extent ( 430 m), this struc-
ture was not previously detected in interpretations of profile
II in the study by Tavakoli et al. (2012b). Bauer et al. (2013)
suggest that the volcanogenic massive sulphide (VMS) de-
posit in the central Skellefte District might have formed from
the fluid conduits along syn-extensional faults, which can be
explained by anomaly V4 and its vicinity to the Norrliden-
N sulphide mineralization (see Tavakoli et al. 2012b). The
occurrences of highly conductive graphitic slates along the
Skellefte–Vargfors contact have been demonstrated by previ-
ous studies (e.g., Garcı́a Juanatey et al. 2013). Based on its
electrical signature, V4 depicts a graphitic shale/schist, which
was formed along a faulted contact, and envelops the likely
sulphide mineralizations labelled S5-I and S5-II at 0.8 km in
depth (Fig. 6c-III).
Jörn intrusion
Previous geological and geophysical investigations in the cen-
tral Skellefte District (cf., Dehghannejad et al. 2012) have
suggested a complex tectonic pattern for the Skellefte Group–
Jörn Intrusion contact. The shear zone and faulted pattern
of the Skellefte–Jörn contact (Bauer et al. 2011) and grav-
ity and magnetic modelling from this area suggest that the
C
2016 European Association of Geoscientists Engineers, Geophysical Prospecting, 1–18
15. Sulphide exploration in Skellefte District, Sweden 15
Figure 9 Resistivity and chargeability model of the 3D area (a) 3D resistivity model down to 450 m and location of the CCZ (b) 3D chargeability
model down to 450 m and location of the CCZ.
Jörn granitoids superimpose a more resistive and denser
unit of tonalite/basalt (Garcı́a Juanatey 2012; Tavakoli et al.
2012a, b). As indicated by resistivity/chargeability result from
profile E-1, the Jörn Intrusion, together with its underly-
ing basalts/tonalite or unaltered granodiorite, extends further
than 1.5 km in depth and dips towards NE (Fig. 6c-III),
which agrees well with earlier potential field and seismic in-
terpretation (Tavakoli et al. 2012a, b). However, both resis-
tivity and IP data suggest a 0.4-km depth extent for the Jörn
granitoid, which is shallower than interpreted earlier (1.1
km; Tavakoli et al. 2012a). This can be explained by the fact
that profile E-1 does not cover the centre of the Jörn grani-
toid compared with profile C1 in the study by Tavakoli et al.
(2012a) and also a poor data coverage between 6 km and
10 km end of profile E-1 in its NE part (Fig. 5a). The Jörn
Intrusion is a dome-shaped structure (Wilson et al. 1987), and
the maximum extent is expected in its central part.
Possible VMS mineralizations
Anomaly S1 is characterized by high chargeability and low
resistivity and is located close to the upper part of the SW-
dipping conglomerate (V2). S1 may either indicate a separate
lithology or belong to the Vargfors Group conglomerate (V2;
Fig. 6c-III). A comparison between 2D data along profile E-1
and 3D data reveals that anomaly N-i is positioned close to
the S1 (Fig. 6c-II); thus, they may depict an identical struc-
ture. Anomalies labelled S2 and S3 both indicate intermediate
resistivity (6 km–10 km), and further investigations are re-
quired to find out whether they are related to mineralization
C
2016 European Association of Geoscientists Engineers, Geophysical Prospecting, 1–18
16. 16 S. Tavakoli et al.
or not. Among all high-chargeability zones along profile E-1,
S5-I and S5-II, which are enveloped by anomaly V4, are the
most likely structures related to the VMS mineralizations. The
absence of bodies corresponding to S4 and S6 (Fig. 6c-II) in
profile II (Fig. 6b-II) may be a result of a different resolution
of the data due to the differences in electrode configurations
used for the two surveys. Furthermore, the IP result from
profile E-1 indicates that the preliminary interpretation of a
zone with high chargeability along profile II (high chargeabil-
ity at x = 1-1.7 km and 400-m depth; Fig; 6b-II), which was
interpreted as a possible artefact (Tavakoli et al. 2012b), is
not correct. A considerable high chargeability of this feature
(50 mV/V; Fig. 6c-II) can indicate an alteration halo that
envelopes sulphide mineralization. In addition, Tavakoli et al.
(2012b) previously related the high-chargeability zone at x =
3 km–4 km in profile I (Fig. 6a-II) as a possible indication of
the VMS mineralization, which was observed in a borehole in
the same part of profile I (borehole NRL67103 in Fig. 2).
The Maurliden deposits
The known Maurliden mineralizations inside the 3D area are
predominantly characterized by intermediate to low resistivi-
ties (Fig. 7). The absence of a low-resistivity anomaly near the
Maurliden North deposit (M-i; Fig. 7) can be explained by
the limited lateral and vertical extensions of this deposit (
200-m depth extent), which could be missed by the electrode
configuration applied, or it can be result of a different min-
eral composition. According to Montelius (2005), the portion
of the main ore minerals (pyrite, sphalerite, chalcopyrite, and
arsenopyrite) within the Maurliden deposits varies; this may
explain the difference between the anomaly response of the
three known Maurliden mineralizations (M-i, M-ii, and M-iii;
Fig. 8). Anomaly N-i, which was also imaged on profile E-1,
is extended at depth down to 0.2 km and can depict a feature
related to sulphide mineralization. The high-resistivity feature
in the bottom right corner of the 3D area, which is associated
with moderate to low chargeability (Fig. 9-I and 9-II), is re-
lated to the Vargfors basin conglomerate and sandstone that
indicated similar response in profile E-1 (Figs. 2). The CCZ
near the Maurliden deposits and its prolongation towards
the NW is an interesting anomaly for further investigations
(Fig. 9-I and 9-II).
CONCLUSION
Deep 2D and 3D geoelectrical and induced polarization (IP)
measurements have been conducted and interpreted in the
central Skellefte District. While the combination of the geo-
electrical/IP data from profiles I, II, and E-1 provided signif-
icant information about the key lithological contacts and the
geometry of the major geological units at greater depths (i.e.,
1.5 km), the 3D data mainly contributed to better understand
the distribution of the sulphide mineralization around the
three known Maurliden mineralizations and also suggested
new potential areas for targeting ore deposits.
In general, deep geoelectrical/IP data proved efficient in
prospecting the geological features related to the sulphide min-
eralizations in the Skellefte mining district. The expected pres-
ence of graphite/schist within, e.g., metasedimentary rocks of
the Vargfors group, resulted in a large contrast in electric
conductivity. Pole–dipole array proved suitable for target-
ing deep volcanogenic massive sulphide (VMS) deposits in
the Skellefte District. Great investigation depth due to the
good signal strength and a rather good horizontal coverage in
comparison with dipole–dipole and also less sensitivity to tel-
luric noise compared with pole–pole makes pole–dipole an in-
teresting array for similar geological environment. However,
the asymmetry associated normally in the measured apparent
resistivity/IP data using pole–dipole may complicate the inter-
pretation. In the present study, this was resolved by measur-
ing the data in forward and reverse manner, although with
the expense of extra time and cost. Better data resolution may
be achieved if shallower penetration depth is desired, which
needs to be determined depending on the prospecting target
for each specific study.
This study resulted in the following main conclusions. (i)
Based on its electrical signature, V4 is interpreted as graphitic
shale/schist that was formed along a faulted contact and en-
velops a sulphide mineralization at 0.8 km in depth where
the highest chargeability (S5) is observed. (ii) Several anoma-
lies were identified on profile E-1, which, according to the
results from previous petrophysical studies, are likely to be
related to the alteration zones associated with the VMS de-
posits or graphitic schist (S1–S6), among which S5-I and S5-II
are more likely to depict geological structures related to the
sulphide mineralization. (iii) Vargfors basin and its key con-
tact with the felsic volcanic rocks of the Skellefte Group were
better understood based on the 2D-deep geoelectrical/IP data,
and its maximum depth is estimated to 1 km, which is in
line with earlier interpretations. (iv) The NE-dipping trend
of the Jörn granodiorite, which was suggested by previous
geophysical investigations, could be validated; however, resis-
tivity and chargeability data from profile E-1 reveal that the
Jörn granodiorite extends only down to 0.4-km depth. (v) The
geometry of the Maurliden deposits is better understood with
C
2016 European Association of Geoscientists Engineers, Geophysical Prospecting, 1–18
17. Sulphide exploration in Skellefte District, Sweden 17
the help of the 3D data. Maurliden Central and its alteration
halo continue at least down to 0.45 km in depth, whereas
Maurliden East and North do not extend more than 0.2 km
in depth. Also, several new anomalies that were imaged by
the 3D resistivity and chargeability data can be interesting
targets for more in-depth investigations in the future. (vi) Re-
sistivity and IP data imaged the mafic volcanic rocks of the
Skellefte Group, which occur as intercalation of basalts along
the contact between felsic volcanic rocks and the Jörn gra-
nodiorites; these rocks partly underlie the outcropping felsic
volcanic rocks and the Jörn granodiorite.
ACKNOWLEDGEMENT
This work is part of the “VINNOVA 4D-modelling” project
and is financed by VINNOVA and Boliden Mineral AB. The
authors appreciate the constructive comments by journal As-
sociate Editor, Prof. Ahmet Tugrul Basokur and anonymous
reviewers. All project members are thanked for their contribu-
tion during the course of this work. The authors would like to
thank Timo Pitkänen, Hans Thunehed, and the field crew of
GeoVista AB for data acquisition and valuable comments dur-
ing data processing. Tobias Hermansson and the Geophysics
Department at Boliden Mineral AB are thanked for their con-
structive comments and provision of supplementary geophys-
ical data. The authors would also like to thank Dr. Juliane
Hübert from the Department of Earth and Atmospheric Sci-
ences, University of Alberta, and Dr. Garcı́a Juanatey from
the Department of Geophysics, Uppsala University, for fruit-
ful comments on the manuscript. And finally, Saman Tavakoli
would like to thank Aija Voitkane for her unconditional sup-
port and patience when writing this paper.
REFERENCES
Allen R.L., Weihed P. and Svenson S.-Å. 1996. Setting of Zn–Cu–
Au–Ag massive 1256 sulfide deposits in the evolution and facies
architecture of a 1.9 Ga marine volcanic 1257 arc, Skellefte District,
Sweden. Economic Geology 91, 1022–1053.
Basokur A.T., Rasmussen T.M., Kaya C., Altun Y. and Aktas K. 1997.
Comparison of induced polarization and controlled-source audio-
magnetotellurics methods for massive chalcopyrite exploration in
a volcanic area. Geophysics 62(4), 1087–1096.
Bauer T. 2010. Structural and sedimentological reconstruction of the
inverted Vargfors Basin: A base for 4D-modeling. Licentiate thesis,
Luleå University of Technology, Sweden, 44 pp.
Bauer T.E., Skyttä P., Allen R.L. and Weihed P. 2011. Syn-extensional
faulting controlling structural inversion—Insights from the Palaeo-
proterozoic Vargfors syncline, Skellefte mining district, Sweden.
Precambrian Research 191, 166–183.
Bauer T.E., Skyttä P., Allen R.L. and Weihed P. 2013. Fault-
controlled sedimentation in a progressively opening extensional
basin: The Palaeoproterozoic Vargfors basin, Skellefte mining dis-
trict, Sweden. International Journal of Earth Sciences 102(2),
385–400.
Billström K. and Weihed P. 1996. Age and provenance of host rocks
and ores of the Palaeoproterozoic Skellefte District, northern Swe-
den. Economic Geology 91, 1054–1072.
Caglar I. 2000. A method to remove electromagnetic coupling from
induced polarization data for an “exponential” Earth model. Pure
and Applied Geophysics 157(10), 1729–1748.
Claesson L.-Å. and Isaksson H. 1981a. Västra Maurliden prospek-
teringsrapport: BRAP 8106. Sveriges Geologiska Undersökning,
unpublished report (in Swedish).
Claesson L.-Å. and Isaksson H. 1981b. Nordöstra Maurliden
prospekteringsrapport BRAP 81052. Sveriges Geologiska Un-
dersökning, unpublished report (in Swedish).
Commer M., Newman G.A., Williams K.H. and Hubbard S.S. 2011.
3D induced-polarization data inversion for complex resistivity.
Geophysics 76(3), F157–F171.
Dehghannejad M., Bauer T.E., Malehmir A., Juhlin C. and Weihed
P. 2012. Crustal geometry of the central Skellefte district, north-
ern Sweden – constraints from reflection seismic investigations.
Tectonophysics 20, 87–99.
deGroot-Hedlin C. and Constable S. 1990. Occam’s inversion to gen-
erate smooth, two-dimensional models form magnetotelluric data.
Geophysics 55, 1613–1624.
de Kemp E.A., Monecke T., Sheshpari M., Girard E., Lauzière K.,
Grunsky E.C. et al. 2011. 3D GIS as a support for mineral dis-
covery. Geochemistry: Exploration, Environment, Analysis 11(2),
117–128.
Garcı́a Juanatey M. 2012. Seismics, 2D and 3D Inversion of Magne-
totellurics: Jigsaw pieces in understanding the Skellefte Ore District.
ISBN: 978-91-554-8409-5.
Garcı́a Juanatey M., Hübert J., Tryggvason A. and Pedersen L.B.
2013. Imaging the Kristineberg mining area with two perpendicu-
lar magnetotelluric profiles in the Skellefte Ore District, northern
Sweden. Geophysical Prospecting 4(2), 387–404.
González-Roldán M.J. 2010. Mineralogy, Petrology and Geochem-
istry of syn-volcanic intrusions in the Skellefte mining district,
Northern Sweden. Unpublished Ph.D. thesis, University of Huelva,
Spain, 273 pp.
Hübert J., Malehmir A., Smirnow M., Tryggvason A. and Peder-
sen L.B. 2009. MT measurements in the western part of the Pa-
leoproterozoic Skellefte Ore District, Northern Sweden: A contri-
bution to an integrated geophysical study, Tectonophysics 475,
493–502.
IPR-12 manual. 1997. Available online at: [http://scintrexltd.
com/downloads/IPR-12%20Manual%20Rev%203.pdf].
Kathol B. and Weihed P. 2005. Description of regional geological and
geophysical maps of the Skellefte District and surrounding areas.
Sveriges Geologiska Undersökning Ba 57, 197 pp.
Kathol B., Weihed P., Antal Lundin I., Bark G., Bergman Weihed
J., Bergström U. et al. 2005. Regional geological and geophysical
maps of the Skellefte district and surrounding areas. Bedrock map.
Sveriges Geologiska Undersökning 57(1).
C
2016 European Association of Geoscientists Engineers, Geophysical Prospecting, 1–18
18. 18 S. Tavakoli et al.
Kemna A., Binley A., Ramirez A. and Daily W. 2000. Complex resis-
tivity tomography for environmental applications. Chemical Engi-
neering 77, 11–18.
Kneisel C. 2006. Assessment of subsurface lithology in mountain en-
vironments using 2D resistivity imaging. Geomorphology 80(1–2),
32–44.
Li Y. and Oldenburg D.W. 1994. Subspace linear inverse method.
Inverse Problems 10, 915–935.
Li Y. and Oldenburg D.W. 2000. 3-D inversion of induced polariza-
tion data. Geophysics 65(6), 1931–1945.
Loke M.H. 2012. Tutorial: 2-D and 3-D Electrical Imaging Surveys.
GeoTomo Software, Malaysia.
Madden T. 1985. Sulfide mineral electrode polarization properties:
possible clues to ore mineral identification. Electrochemical Society
Extended Abstracts 85-1, 478.
Magnusson M.K., Fernlund J.M.R. and Dahlin T. 2010. Geoelectri-
cal imaging in the interpretation of geological conditions affecting
quarry operations. Bulletin of Engineering Geology and the Envi-
ronment 69(3), 465–486.
Malehmir A., Thunehed H. and Tryggvason A. 2009. The Paleopro-
terozoic Kristineberg mining area, northern Sweden: Results from
integrated 3D geophysical and geologic modeling, and implications
for targeting ore deposits. Geophysics 74(1), B9–B22.
Malehmir A., Tryggvason A., Lickorish H. and Weihed P. 2007. Re-
gional structural profiles in the western part of the Palaeoprotero-
zoic Skellefte ore district, northern Sweden. Precambrian Research
159, 1–18.
Malmqvist L. 1978. Some applications of IP-techniques for different
geophysical prospecting purposes. Geophysical Prospecting 26(1),
97–121.
Montelius C. 2005. The genetic relationship between rhyolitic vol-
canism and Zn-Cu-Au deposits in the Maurliden Volcanic Centre,
Skellefte District, Sweden: volcanic facies, lithogeochemistry and
geochronology. PhD thesis, Luleå University of Technology, Swe-
den, 15 pp.
Montelius C., Allen R.L., Svenson S.-Å. and Weihed P. 2007. Fa-
cies architecture of the Palaeoproterozoic VMS-bearing Maurliden
volcanic centre, Skellefte district, Sweden. GFF 129, 177–196.
Nelson P.H. and Van Voorhis G.D. 1983. Estimation of sulfide con-
tent from induced polarization data. Geophysics 48(1), 62–75.
Oldenburg D.W. and Li Y. 1994. Inversion of induced polarization
data. Geophysics 59, 1327–1341.
Oldenburg D.W., Li Y., Farquharson C.G., Kowalczyk P., Aravanis
T., King A. et al. 1998. Applications of geophysical inversions in
mineral exploration problems. The Leading Edge 17, 461–465.
Padget P., Ek J. and Eriksson L. 1969. Vargisträsk, a case-history in
ore-prospecting. Geoexploration 7(3), 163–175.
Parasnis D.S. 1997. Principles of Applied Geophysics. London: Chap-
man and Hall.
Phillips N., Oldenburg D., Chen J., Li Y. and Routh P. 2001. Cost
effectiveness of geophysical inversions in mineral exploration: Ap-
plications at San Nicolas. The Leading Edge 20(12), 1351.
Rutley A., Oldenburg D.W. and Shekhtman R. 2001. 2D and 3D
IP/resistivity inversion for the interpretation of Isa-style targets.
15th Geophysical Conference and Exhibition, Australian Society
of Exploration Geophysicists. Conference handbook: Geophysical
odyssey: Preview (Brisbane, Qld.), 93, 85.
Salmirinne H. and Turunen P. 2007. Ground geophysical charac-
teristics of gold targets in the Central Lapland Greenstone Belt.
Geological Survey of Finland, Special Paper 44, 209–223.
Sandrin A. and Elming S-Å. 2007. Physical properties of rocks from
borehole TJ71305 and geophysical outline of the Tjårrojåkka
Cu-prospect, northern Sweden. Ore Geology Reviews 30(1),
56–73.
Sasaki Y. 1992. Resolution of resistivity tomography inferred
from numerical simulation. Geophysical Prospecting 40, 453–
464.
Skyttä P., Hermansson T., Andersson J., Whitehouse M. and Wei-
hed P. 2011. New zircon data supporting models of short-lived
igneous activity at 1.89 Ga in the western Skellefte District, central
Fennoscandian Shield. Solid Earth 2, 205–217.
Skyttä P., Bauer T., Tavakoli S., Hermansson T., Andersson J. and
Weihed P. 2012. Pre-1.87 Ga development of crustal domains over-
printed by 1.87 Ga transpression in the Palaeoproterozoic Skellefte
district, Sweden. Precambrian Research 206–207, 109–136.
Storz H., Storz W. and Jacobs F. 2000. Electrical resistivity tomogra-
phy to investigate geological structures of the earth’s upper crust.
Geophysical Prospecting 48(3), 455–471.
Sultan S.A., Mansour S.A., Santos F.M. and Helaly A.S. 2009. Geo-
physical exploration for gold and associated minerals, case study:
Wadi El Beida area, South Eastern Desert, Egypt. Journal of Geo-
physics and Engineering 6(4), 345–356.
Tavakoli S., Bauer T.E., Elming S-Å., Thunehed H. and Weihed P.
2012a. Regional-scale geometry of the central Skellefte district,
northern Sweden—Results from 2.5D potential field modelling
along three previously acquired seismic profiles. Applied Geo-
physics 85, 43–58.
Tavakoli S., Elming S-Å. and Thunehed H. 2012b. Geophysical mod-
elling of the central Skellefte district, Northern Sweden; an inte-
grated model based on the electrical, potential field and petrophys-
ical data. Applied Geophysics 82, 84–100.
UBC-GIF tutorials. 2007. Inversion theory: Practicalities: 2D DC re-
sistivity as the example. Available online at: [http://www.eos.ubc.
ca/ubcgif/iag/tutorials/invn-theoryintro/practiceDC.htm].
Weihed P. 2010. Palaeoproterozoic mineralized volcanic arc systems
and tectonic evolution of the Fennoscandian shield: Skellefte district
Sweden. GFF 132(1), 83–91.
Wilson M.R., Claesson L.-Å., Sehlstedt S., Smellie J.A.T., Aftalion M.,
Hamilton P.J. et al. 1987. Jörn: an early Proterozoic intrusive com-
plex in a volcanic-arc environment, north Sweden. Precambrian
Research 36, 201–225.
Wong J. and Strangway D.W. 1981. Induced polarization in dissemi-
nated sulfide ores containing elongated mineralization. Geophysics
46(9), 1258–1268.
Zonge K., Wynn J. and Urquhart S. 2005. Resistivity, induced po-
larization, and complex resistivity. In: Near Surface Geophysics
(ed D.K. Butler), pp. 265–300. Tulsa, OK: Society of Exploration
Geophysicists.
C
2016 European Association of Geoscientists Engineers, Geophysical Prospecting, 1–18