Download to read offline

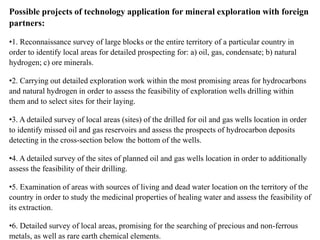


![A distinctive feature of mobile direct-prospecting methods
A fundamentally important feature of direct-prospecting frequency-
resonance methods is that, unlike classical geophysical methods, they
provide a real opportunity to fill the studied cross-section with the
appropriate complexes of sedimentary, metamorphic and igneous
rocks, as well as determine the intervals of the cross-section,
prospective for the detection of combustible and ore minerals,
immediately, in the process of carrying out measurements (recording
signals) with developed instrumentation devices (i.e., without
additional steps of modeling and geological interpretation of
geophysical measurements). In this presentation, as well as in other
published papers [1-12, in next slide], the measurement results are
presented and analyzed exclusively!](https://image.slidesharecdn.com/direct-prospectingmethodspresentation-220827222103-da7083e4/85/Direct-prospecting-methods_Presentation-ppt-9-320.jpg)

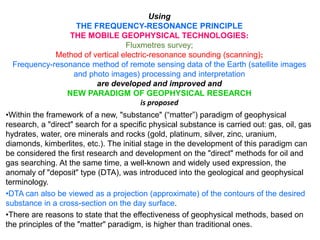
![In many publications, including [1], it is noted that the efficiency of prospecting and exploration
wells drilling for oil and gas does not exceed 25–30%. It is also stated here that the main reasons for
this situation are “the dogma of the organic genesis of hydrocarbons and the orientation of deep
drilling towards positive structural traps of the sedimentary cover, the fund of which is currently
close to exhaustion” [1]. At the end of this article, the authors also draw “attention to the need for a
mass transition to “direct” prospecting, which is important in the conditions of low success in
hydrocarbon exploration” [1].
The authors of the monograph [2] in the introduction write (state) that in «the South Caspian Basin, the
largest Western multinational companies and their consortium for period from 1995 to 2008, having
drilled 28 exploratory wells with depths up to 7301 m on 21 highly promising structures, previously
surveyed by high-resolution 3D seismic, did not discover a single commercially viable field,
spending about $1 billion on their search» [2, p. 10].
Experimental investigation show, that additional surveys promptly carried out using direct-prospecting
methods at local drilling sites of prospecting and exploratory wells will contribute to an increase in the
drilling success rate (an increase in the number of wells with commercial hydrocarbon inflows).
Reference
1. Rachinsky M.Z., Karpov V.A. On the issue of increasing the efficiency of exploration work. // Geology and subsoil use. 2022. No. 1. P. 158-161 (in
Russian).
2. Rachinsky M.Z., Kerimov V.I. Geofluid dynamics of oil and gas potential of mobile belts. Scientific editor: M.V. Gorfunkel. John Wiley & Sons,
Inc., Hoboken, New Jersey, and Scrivener Publishing LLC, Salem, Massachusetts. 2015. 494 p. (in Russian).
About efficiency of prospecting wells drilling and transition to “direct” prospecting](https://image.slidesharecdn.com/direct-prospectingmethodspresentation-220827222103-da7083e4/85/Direct-prospecting-methods_Presentation-ppt-11-320.jpg)


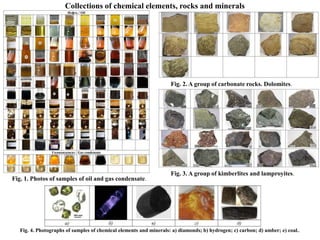
![1. Senay Horozal, Sujin Chae, Dae Hoon Kim, Jeong Min Seo, Sang Min Lee, Hyuk Soo Han,
Deniz Cukur, Gee-Soo Kong. Seismic evidence of shallow gas in sediments on the southeastern
continental shelf of Korea, East Sea (Japan Sea). Marine and Petroleum Geology. 133 (2021).
105291. 14 p. https://doi.org/10.1016/j.marpetgeo.2021.105291
Korean continental shelf. Results of instrumental measurements (processing). April 3, 2022
Fig. 1. Maps-schemes of the block of studies location [1].
Fig. 2. Satellite image of the area of research location. The area of
frequency-resonance processing is indicated by yellow markers.
The article [1] presents the results of
geological and geophysical studies on a large
section of the continental shelf of South
Korea. Maps-schemes of the location of the
work site are shown in Fig.1 [1].
Frequency-resonance processing of the
image fragment indicated in Fig. 2 by
markers.
1. Sedimentary rocks of 1-6th groups with a
root at a depth of 470 km
2. Signals at frequencies of oil, gas
condensate, gas, amber, carbon dioxide,
methane-oxidizing bacteria, nitrogen,
yellow phosphorus, gas hydrates,
anthracite, and ice.
3. 57 km: oil, gas condensate, gas, amber,
nitrogen and yellow phosphorus
4. 59 km – carbon dioxide, oxygen, dead
water
5. -0 m: gas, carbon dioxide, nitrogen,
oxygen, and yellow phosphorus, which
indicates their migration into the atmosphere.
6. Scanning the cross-section up to 10 km: (10 cm step) – 1) 78-154 m, 2) 385-447 m, (50 cm step) – 3) 941-1237 m, 4)
1563-2198 m, 5) 2293-2869 m, 6) 3097-3422 m, 7) 3537-3989 m, 8) 4107-4833 m, (step 5 m) – 9) 6732-7996 m, 10) 8703-
9782 m.](https://image.slidesharecdn.com/direct-prospectingmethodspresentation-220827222103-da7083e4/85/Direct-prospecting-methods_Presentation-ppt-17-320.jpg)
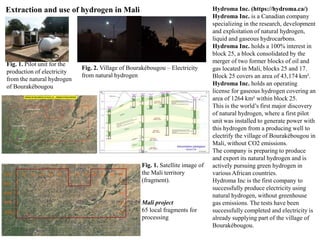
![Area of project well drilling on Japan offshore (January 22, 2022)
1. Inpex to conduct exploratory gas drilling off west Japan. https://www.reuters.com/business/energy/inpex-conduct-exploratory-gas-drilling-off-
west-japan-2022-01-18/
2. Inpex to conduct drilling survey, aiming to launch Japan's first gas project in decades.
https://www.japantimes.co.jp/news/2022/01/18/business/corporate-business/inpex-natural-gas-survey/
3. INPEX to Commence Exploratory Offshore Drilling Offshore Shimane, Yamaguchi Prefectures in Japan.
https://www.inpex.co.jp/english/index.html
Fig. 1. Map of well location [3]. Fig. 2. Satellite image of project well location area. The area of
frequency-resonance processing is indicated by a rectangular contour.
During the frequency-resonance processing of a fragment of a satellite image in a rectangular contour in Fig. 2, responses
were recorded at the frequencies of the 10th group of sedimentary (siliceous) rocks and dead water. Signals at the
frequencies of oil, condensate, gas, phosphorus, hydrogen, living water and sodium chloride salt were not received!!!
The results of the operational processing of a fragment of a satellite image in the area of the project well location allow us to
conclude that the probability of fluid inflows obtaining in drilled wells within the survey area is close to zero!!!
In volcanic complexes, filled with siliceous rocks, responses at frequencies of oil, condensate and gas have never been
recorded!
Experimental studies in various regions have shown that siliceous rocks can be a very good seal for the formation of natural
hydrogen accumulations in the reservoirs of cross-section.](https://image.slidesharecdn.com/direct-prospectingmethodspresentation-220827222103-da7083e4/85/Direct-prospecting-methods_Presentation-ppt-18-320.jpg)


![Results of experimental work on the sites of prospecting wells drilling in different
regions published in papers [1].
1. Exploration well "Maria-1" in the West Chernomorsky area in Black Sea.
2. Additional survey of the local drilling site of Melnik-1 well on Khan Asparuh block in the Black
Sea.
3. Local site of an exploration well drilling (coordinates: 57°10.644'N, 001°07.066'E) in the North Sea.
4. Location of the Brulpadda-1AX well on South Africa offshore.
5. Well drilling site on the Silistar block (1-14 Khan Kubrat) on the Bulgarian shelf in Black Sea.
6. Location of the drilled well (coordinates: 6º19'4.8"S, 10º53'33"E) on the Angola offshore.
7. Location of the Kekra-1 well (coordinates: 22°30'17"N, 66°6'49"E) on Pakistan offshore: no
hydrocarbon inflows were obtained in the well. In the information reports on the Kekra-1 well, it is
noted that the cost of well drilling amounted to 100 million dollars of USA and another 100 million
were spent on cementing operations and drilling an additional shaft to reach the design depth!
8. Location of the most expensive "dry" exploratory well in the history of the oil industry Mukluk on
the Alaska offshore.
9. Marina-1 exploration well drilling site (3°36'56".988 S, 81°0'47".988 W) within Block Z-38
offshore Peru. The well was dry.
10. Area of the deepest water Raya-1 well within Block 14 offshore Uruguay. Commercial inflows of
hydrocarbons were not obtained in the well.
1. Yakymchuk, N. A., Korchagin, I. N. Technology of frequency-resonance processing of remote sensing data: results of practical
approbation during mineral searching in various regions of the globe. Part I. Geoinformatika, 2019, no. 3, pp. 29-51; Part II.
Geoinformatika. 2019. no. 4, pp. 30-58; Part III. Geoinformatika. 2020. no. 1, pp. 19-41; Part IV. Geoinformatika. 2020. no. 3, pp.
29-62; Part V. Geoinformatika. 2021. no. 3-4, pp. 51-88 (in Russian).](https://image.slidesharecdn.com/direct-prospectingmethodspresentation-220827222103-da7083e4/85/Direct-prospecting-methods_Presentation-ppt-22-320.jpg)


The document discusses advanced direct-prospecting technology leveraging frequency-resonance processing of remote sensing data for the exploration of natural resources like hydrogen, hydrocarbons, and minerals. It outlines multiple prospective applications including reconnaissance surveys and detailed exploration of promising areas, alongside the development of new geophysical research paradigms. The effectiveness of these methods is claimed to surpass traditional techniques, providing real-time data on sedimentary and igneous rock complexes during measurements.


