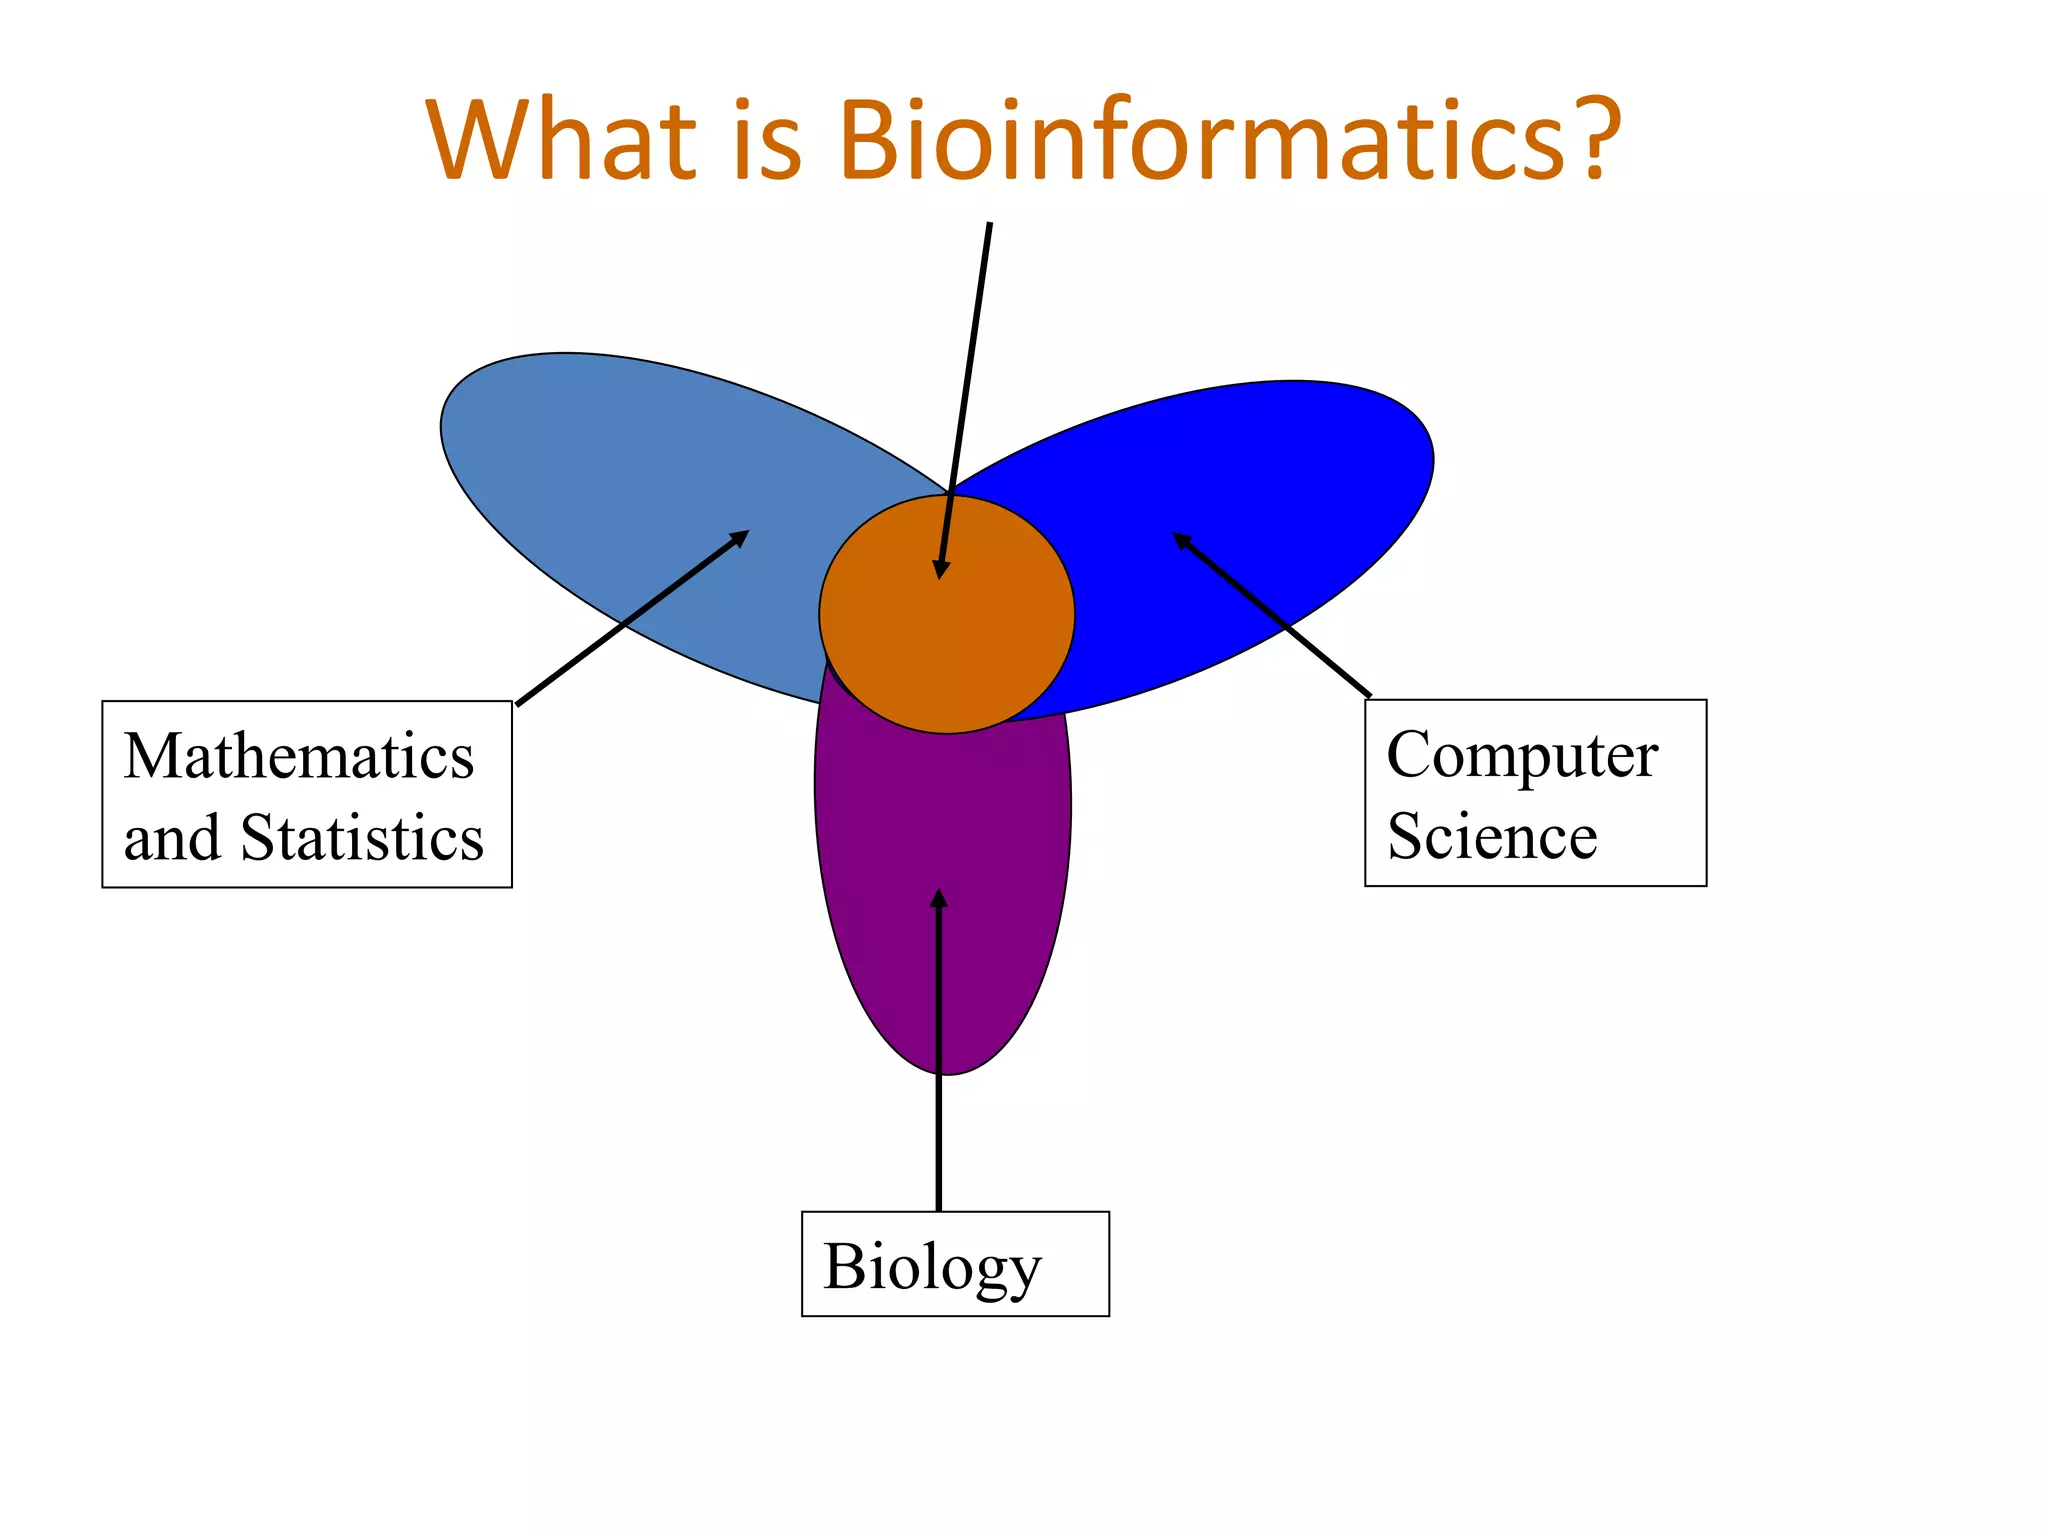
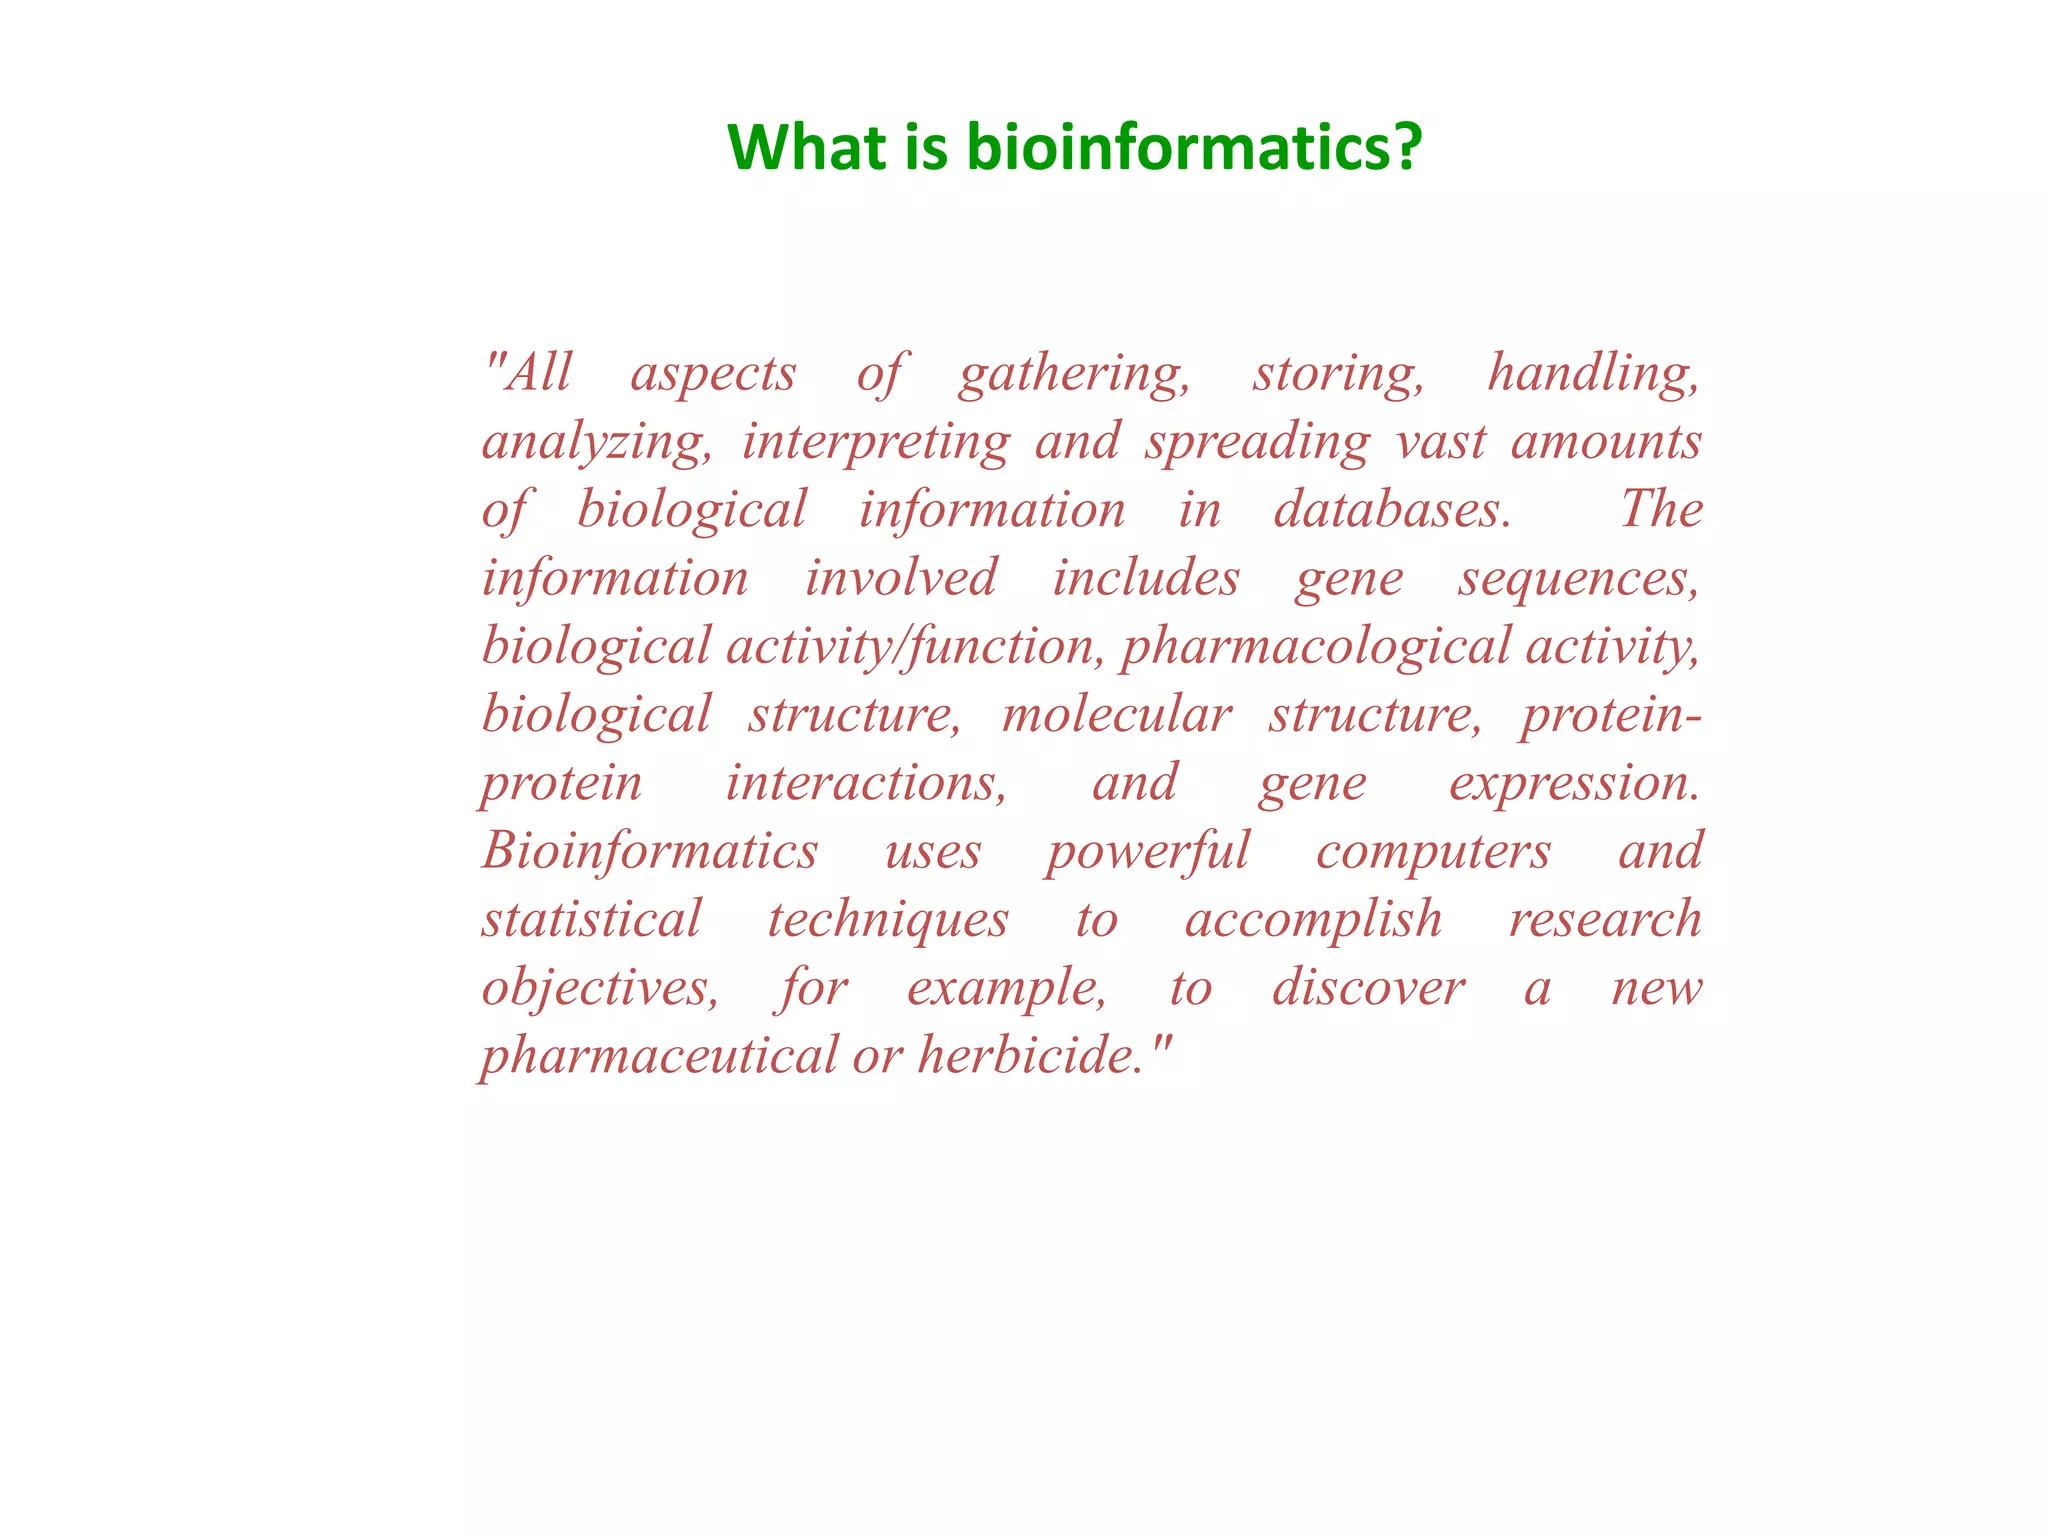
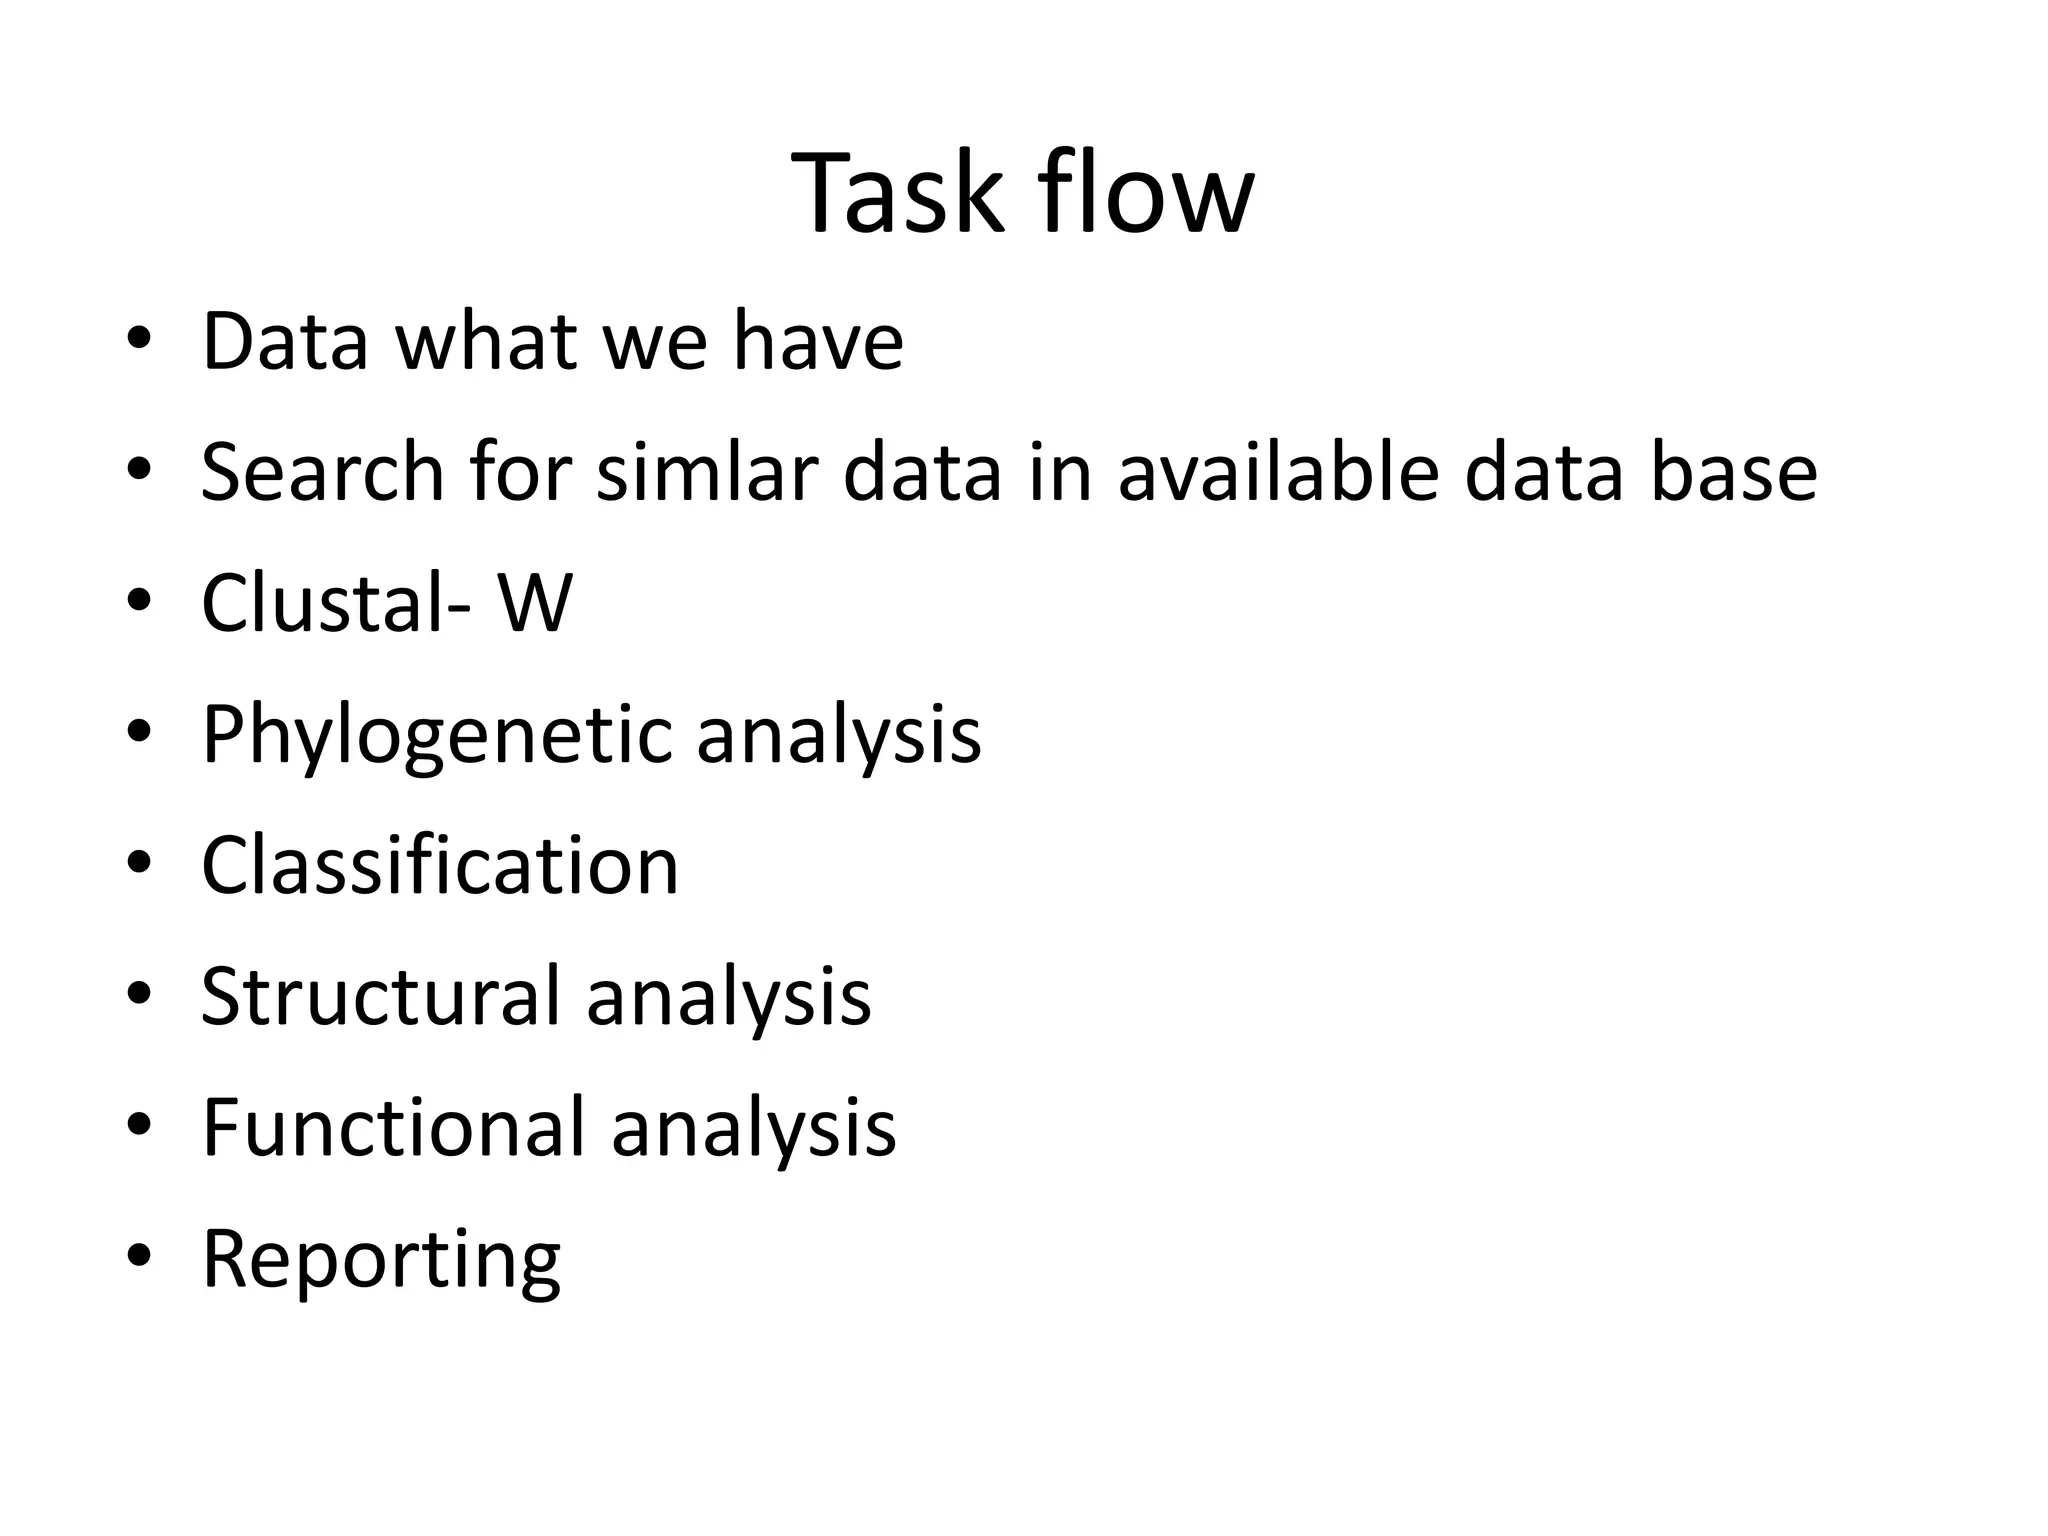
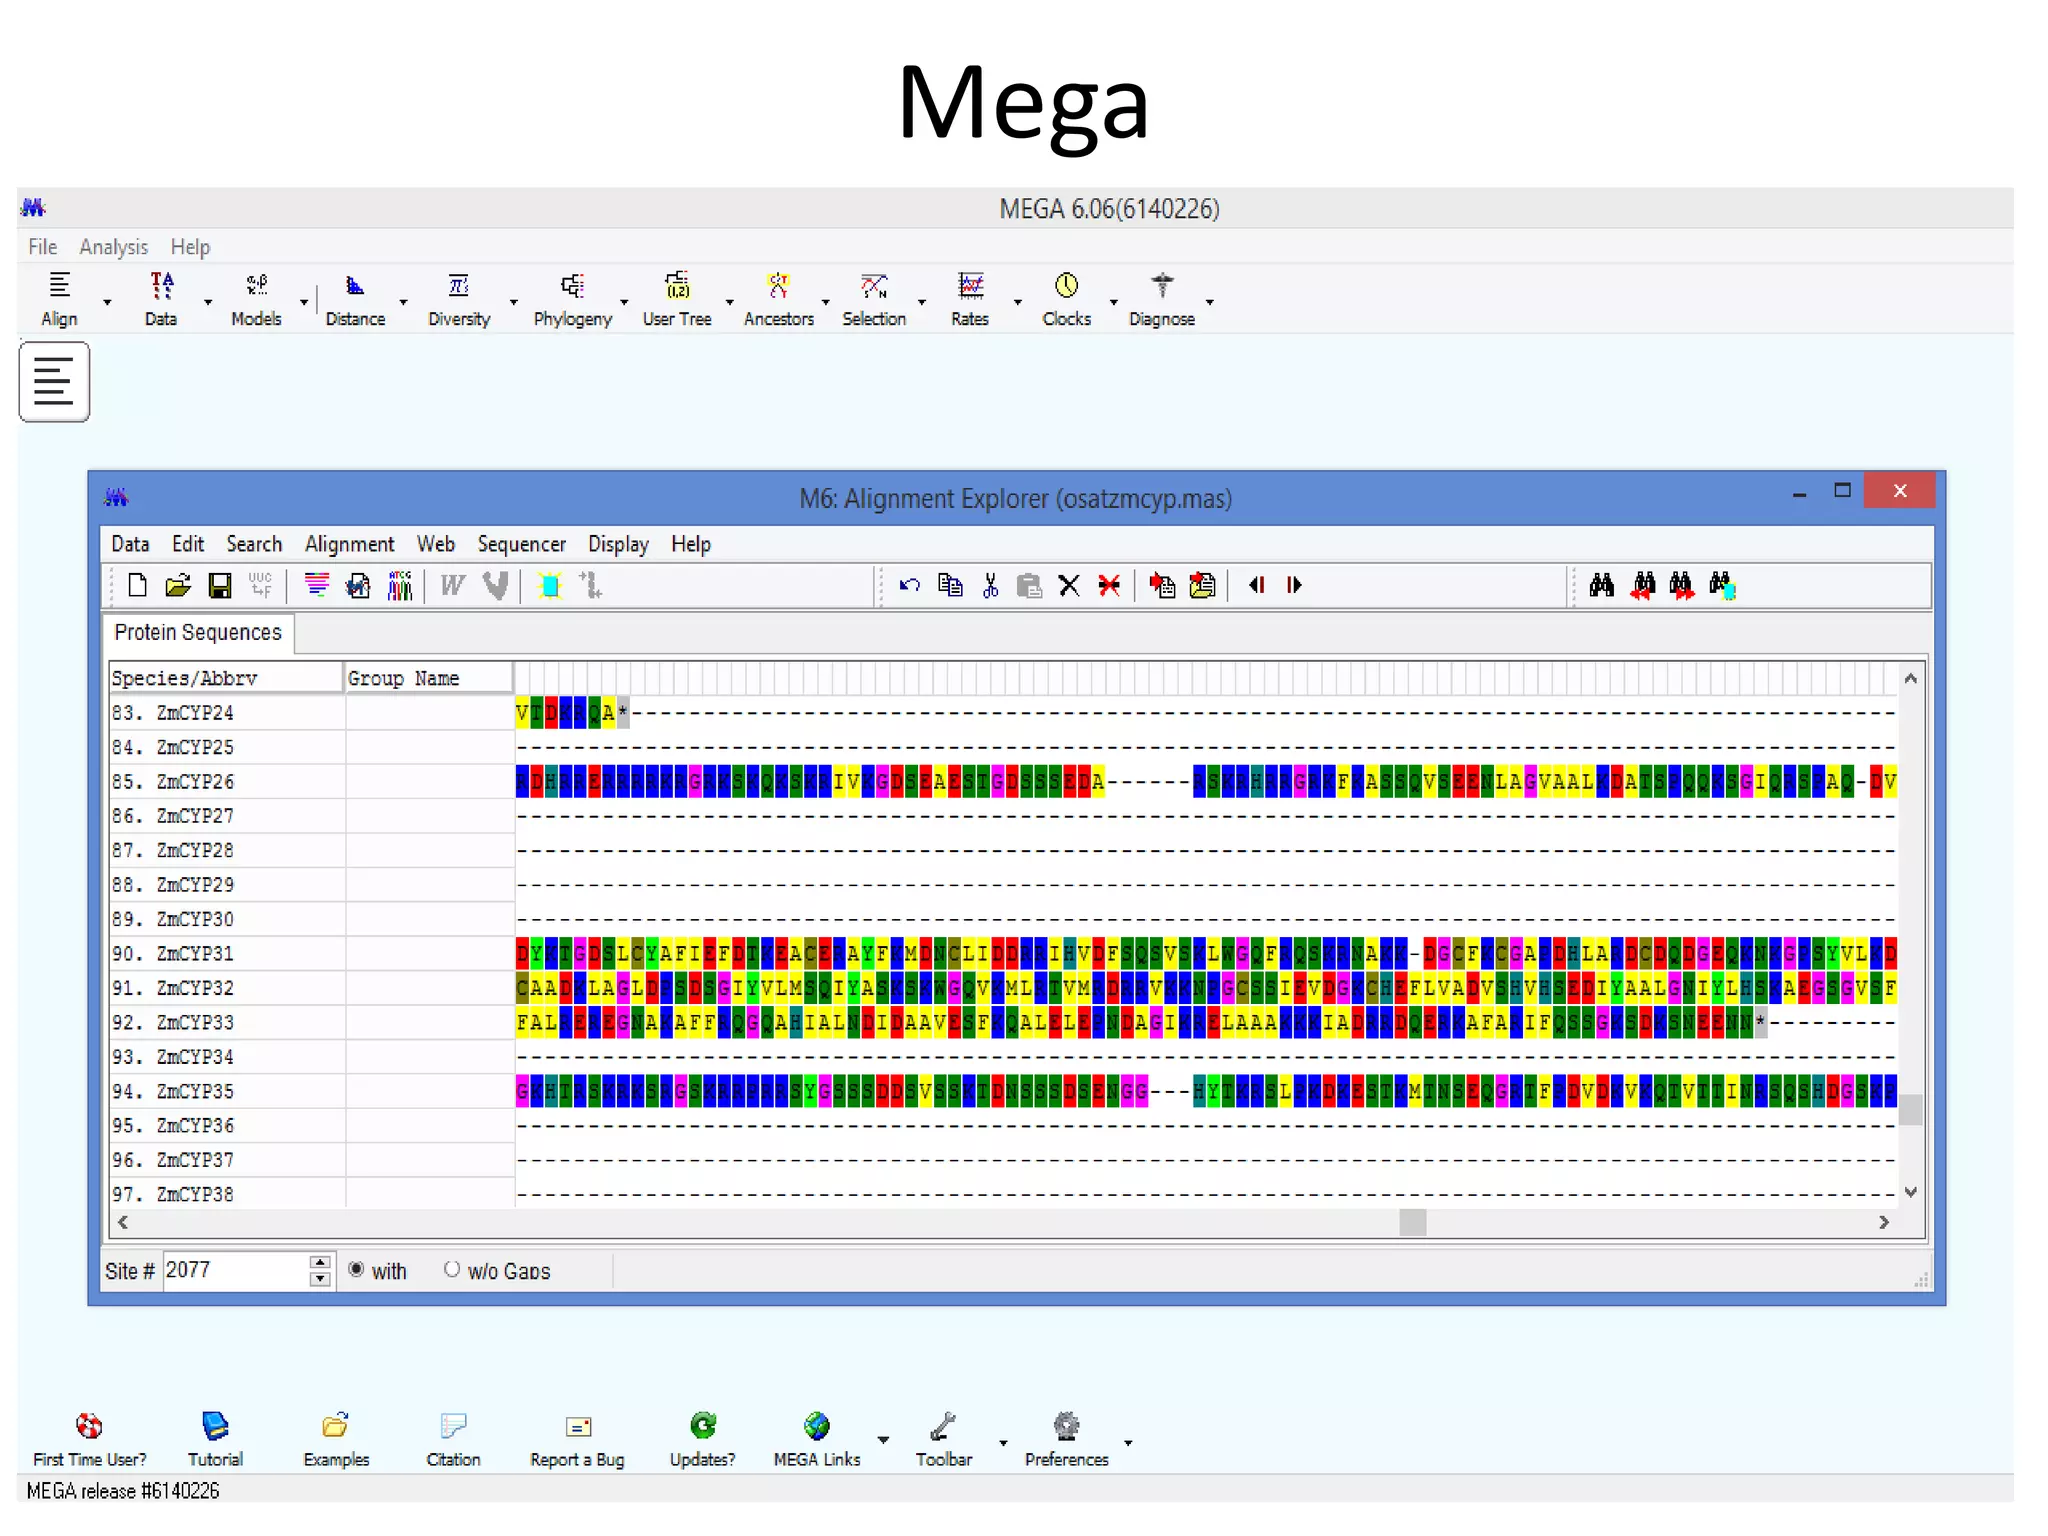
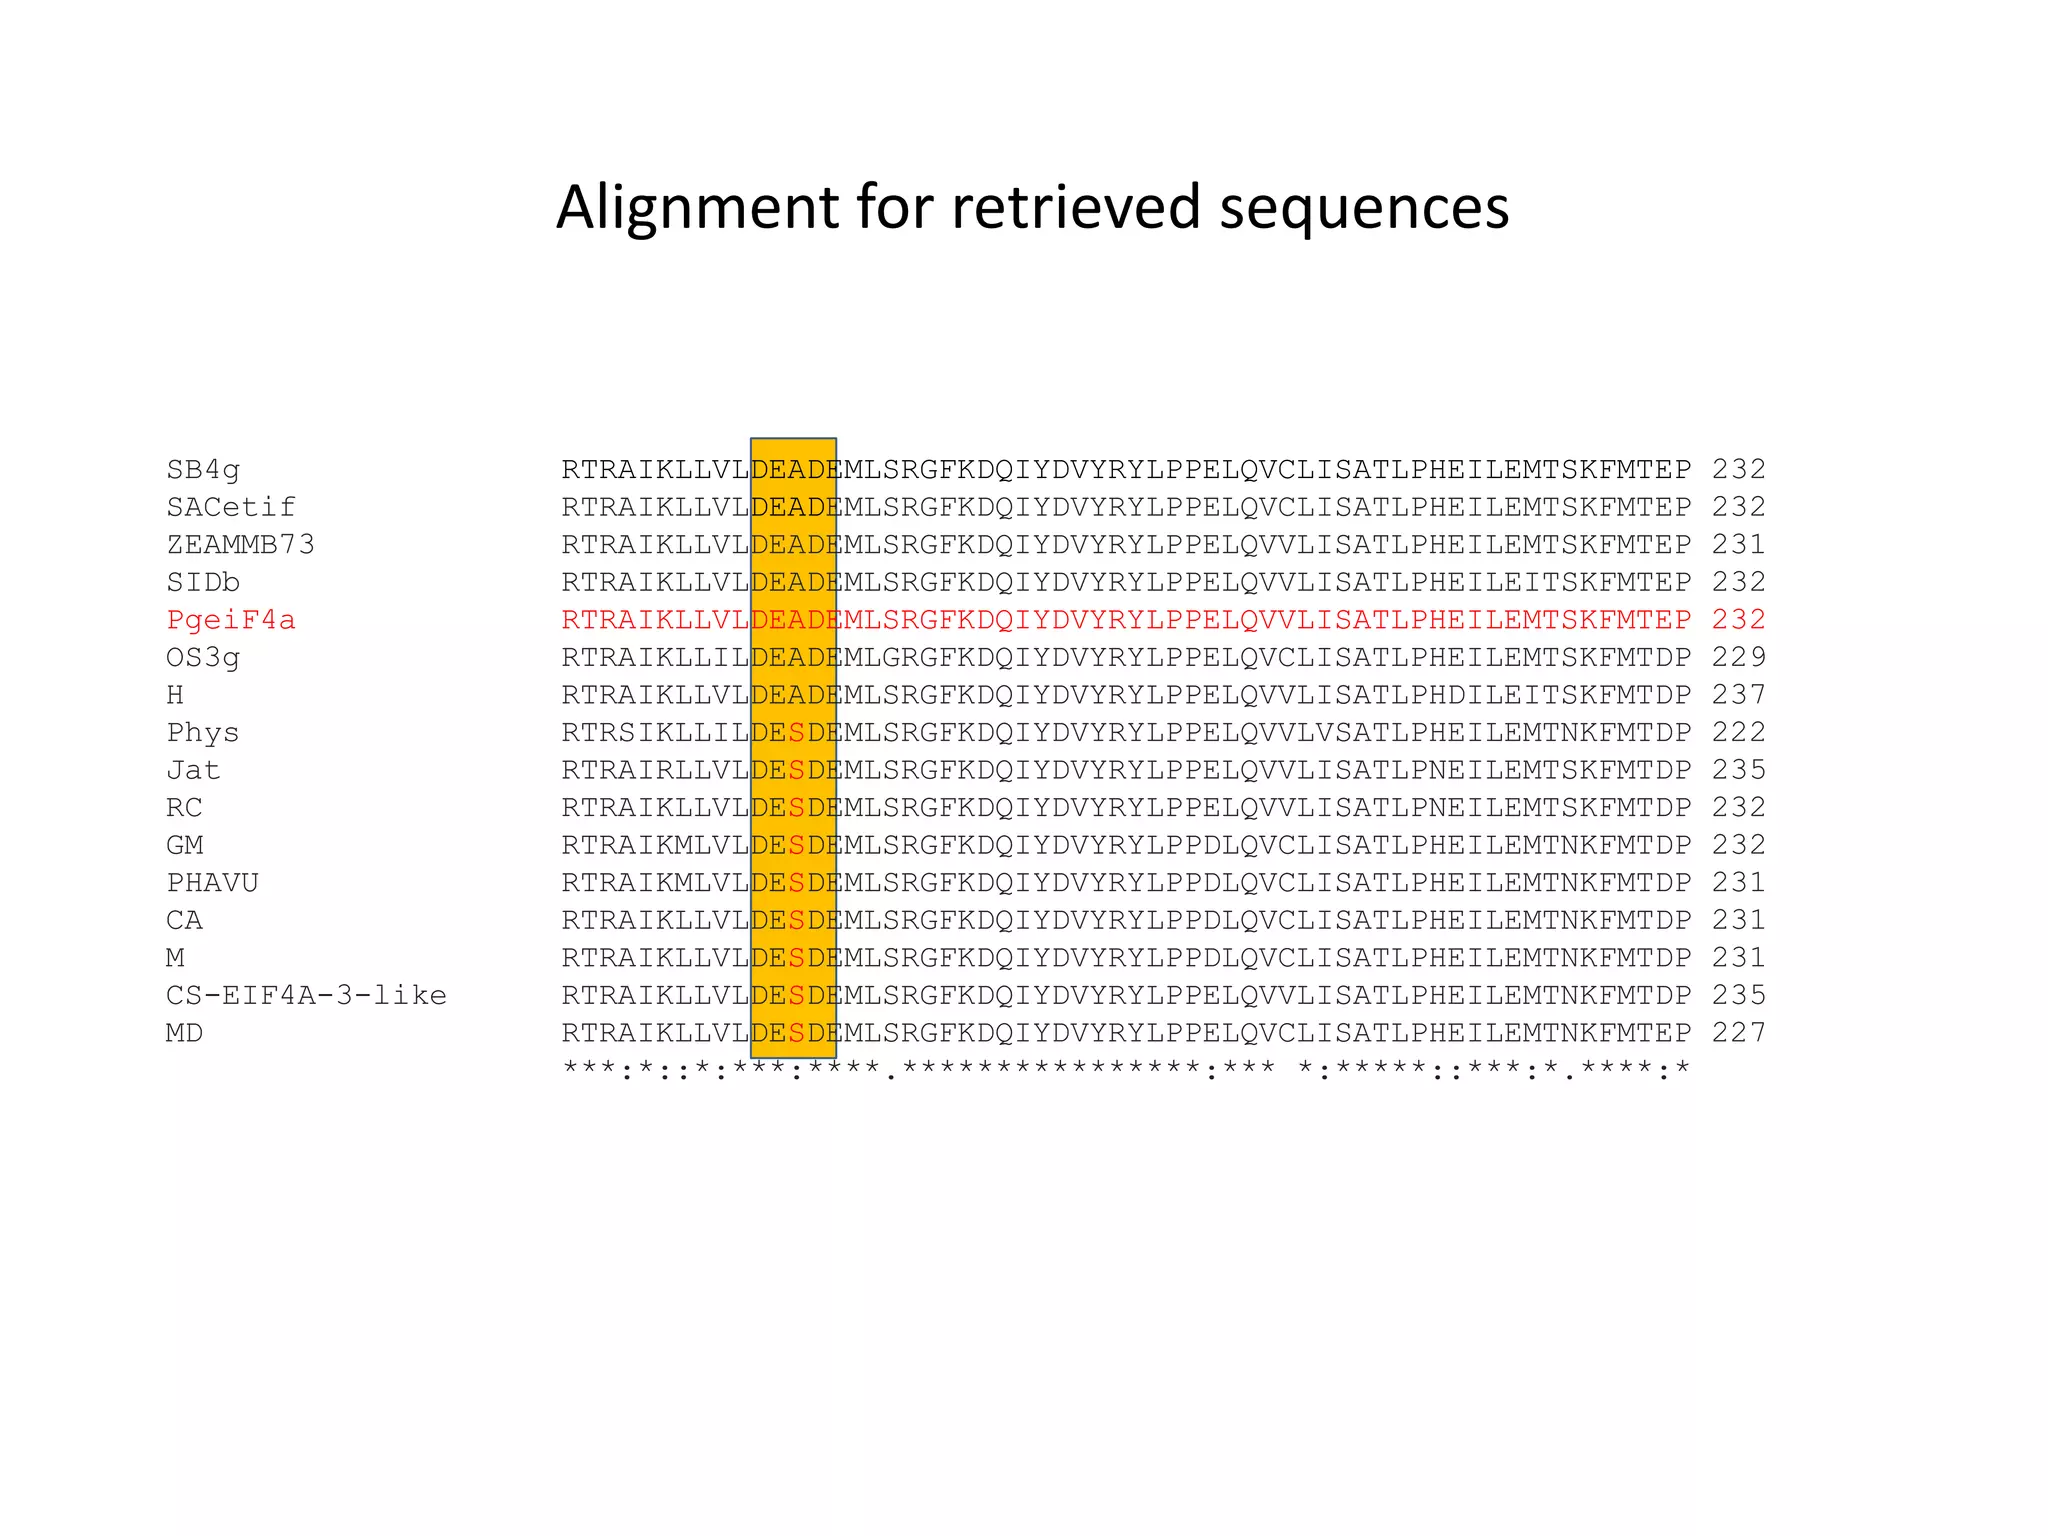
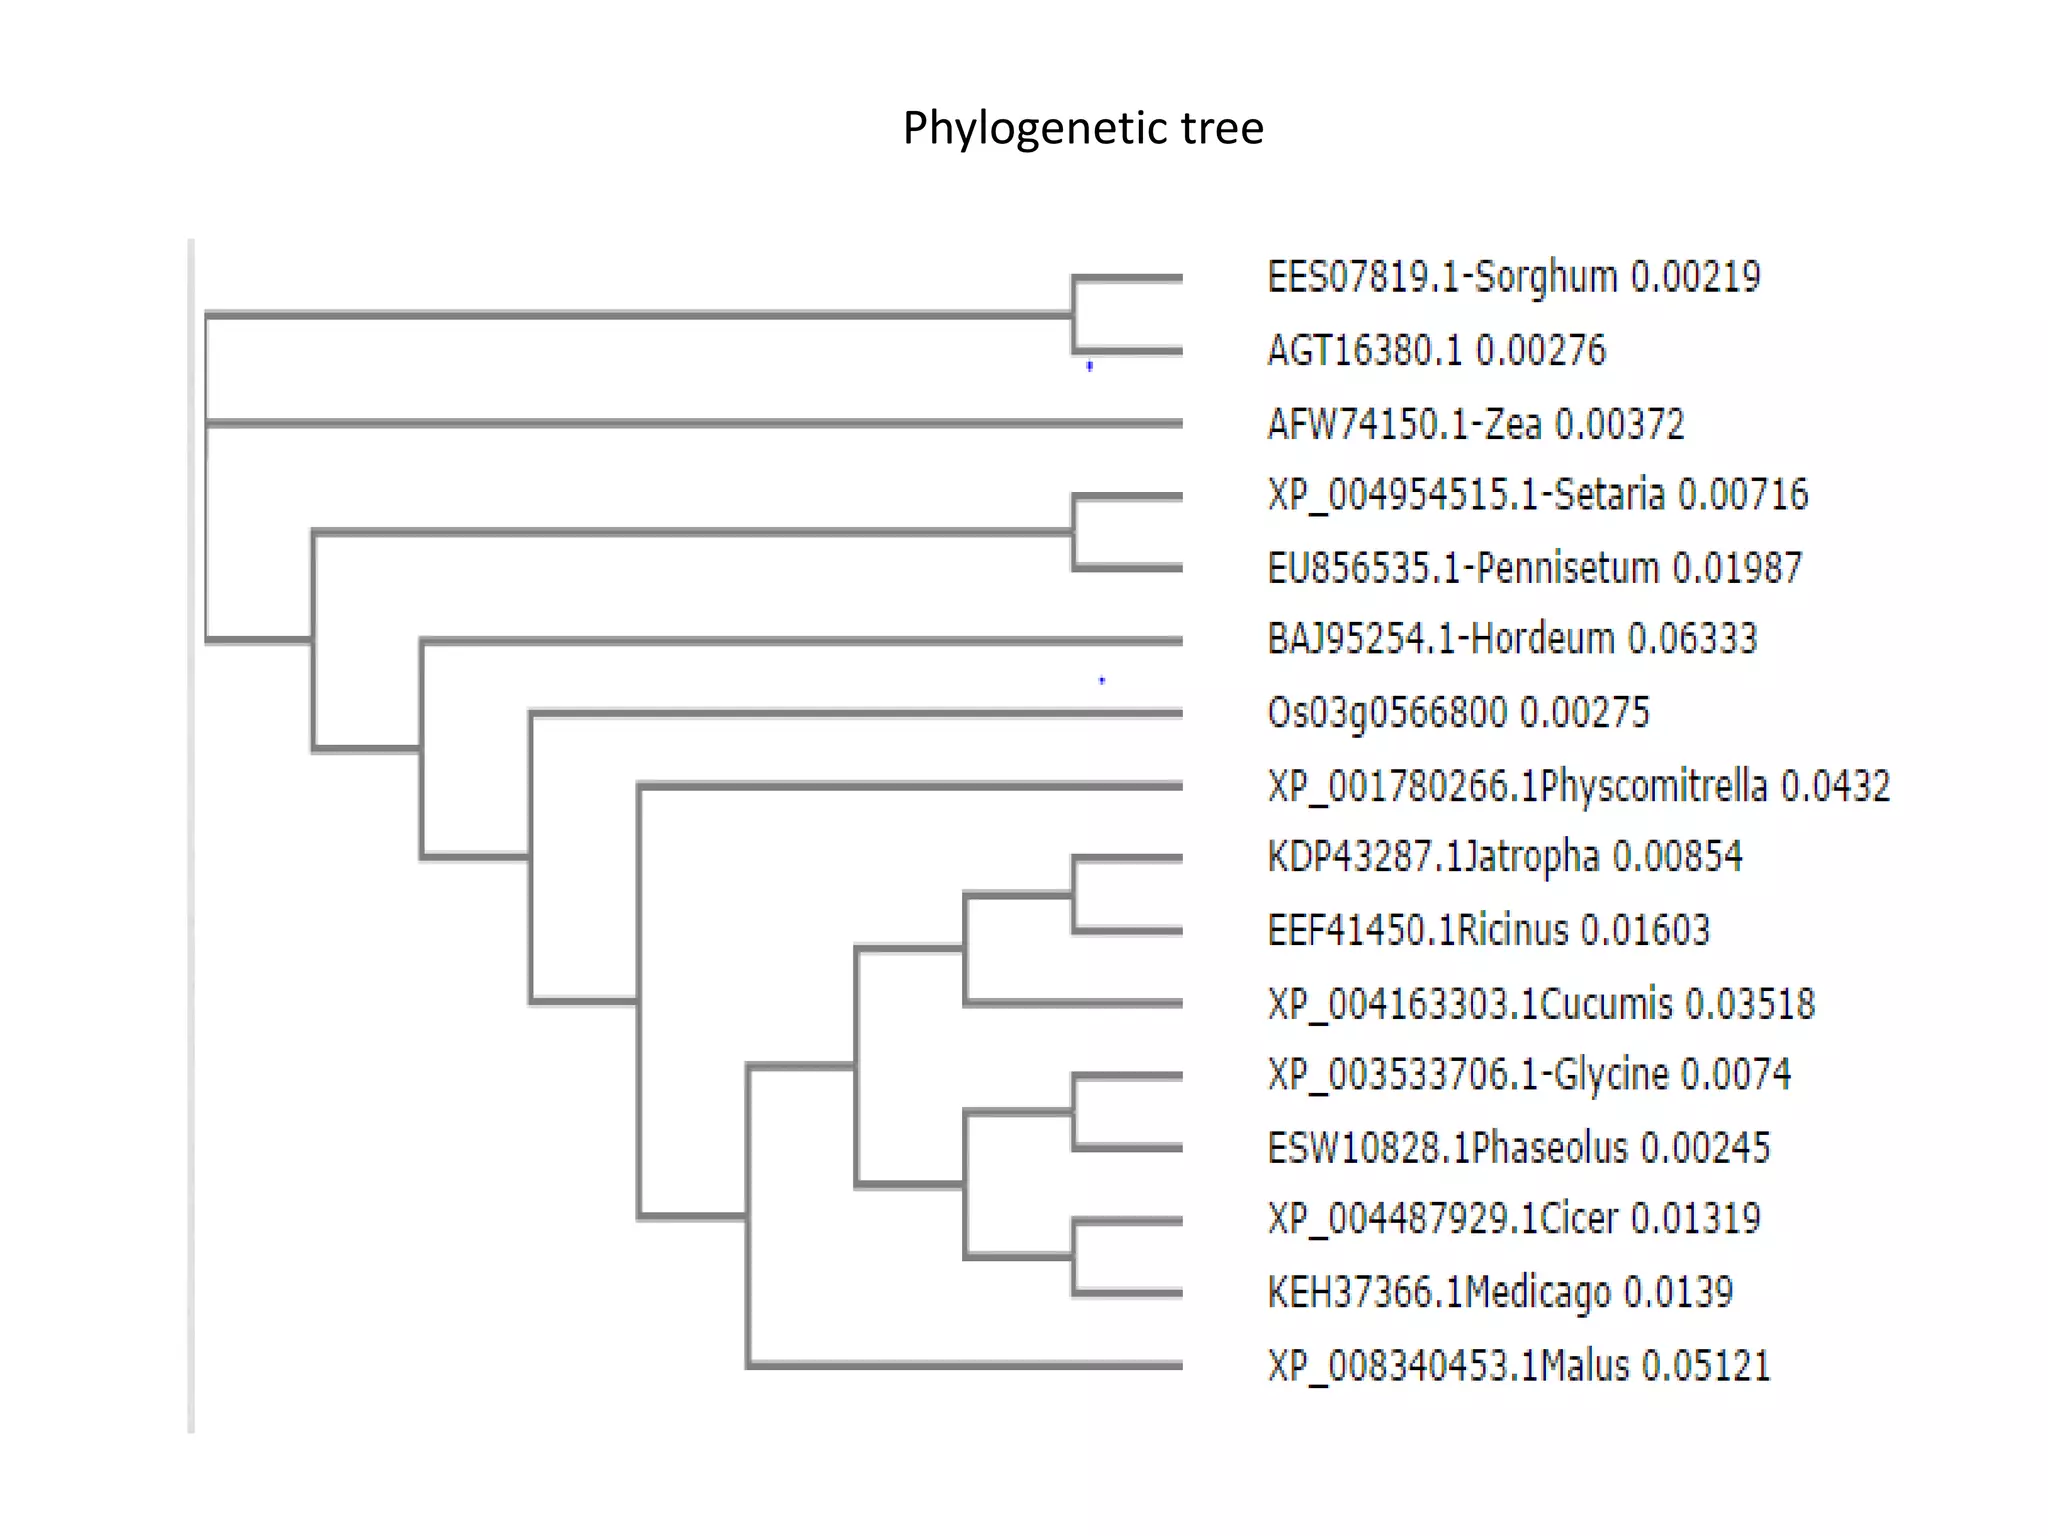
how to analyze the data which is available with the wet lab results and we can analyze more by using bioinformatics tools. here we can learn how to analyze the unknown data.
SAGE (Serial analysis of Gene Expression)talhakhat
SAGE (Serial Analysis of Gene Expression) is a technique that allows for the rapid and comprehensive analysis of gene expression patterns in a given cell population. It works by isolating mRNA, synthesizing cDNA, ligating short sequence tags to the cDNA, and then counting the number of times each tag is observed to quantify gene expression levels. The tags are concatenated and sequenced to generate vast amounts of data that must be analyzed computationally to identify which genes particular tags correspond to and to compare expression profiles between cell types. SAGE provides an overview of a cell's complete transcriptional activity and has been applied to study differences in cancer vs normal cells and to identify targets of oncogenes and tumor suppressor genes.
Microarray as one of recent biomedical technologies produce high dimensional data. This makes statistical analysis become challenging. I presented an overview of microarray analysis specifically in the use of gene expression profiling in a discussion.
The document discusses various methods for structurally aligning proteins, including combinatorial extension, VAST, DALI, SSAP, and TM-align. It also describes Ramachandran plots, which show allowed and favored phi/psi dihedral angle combinations for protein backbone chains based on steric constraints. Structural alignment methods are useful for detecting evolutionary relationships between proteins with low sequence similarity. Ramachandran plots help validate protein structures by identifying conformations not allowed by steric hindrance.
The document discusses various methods for predicting protein function, including homology-based transfer of annotation and prediction of functional motifs and domains. Homology-based transfer can infer molecular function from sequence similarity, but biological process is only transferable between orthologs. Orthologs can be detected through phylogenetic trees or automated methods like InParanoid. Each protein domain contributes to molecular function, while short motifs like phosphorylation sites are also important. Functional annotation involves describing proteins at the molecular, biological process, and cellular component levels.
This document provides an overview of functional genomics and methods for transcriptome analysis. It discusses two main approaches - sequence-based approaches like expressed sequence tags (ESTs) and serial analysis of gene expression (SAGE), and microarray-based approaches. For sequence-based approaches, it describes how ESTs can provide gene discovery and expression information but have limitations. It outlines the SAGE methodology and gene index construction to organize EST data. For microarrays, it summarizes the basic workflow including sample preparation, hybridization, image analysis and data normalization to identify differentially expressed genes through statistical tests.
Proteomics uses techniques from molecular biology, biochemistry, and genetics to analyze proteins produced by genes. Mass spectrometry is commonly used in proteomics to identify proteins. Techniques like isotope-coded affinity tags (ICAT) allow comparative analysis of protein expression between samples by labeling proteins with stable isotopes before mass spectrometry analysis. ICAT involves labeling cysteine-containing peptides from two samples with either light or heavy isotopic reagents, mixing the samples, then using mass spectrometry to quantify differences in protein expression between the original samples based on mass shifts between labeled peptides.
This document discusses the history and various methods of DNA sequencing. It begins with a brief overview of DNA sequencing and its uses. It then outlines some of the major developments in DNA sequencing techniques, including the earliest RNA sequencing in 1972, Sanger sequencing in 1977, and the first complete genome of Haemophilus influenzae in 1995. The document proceeds to provide more detailed explanations of several DNA sequencing methods, such as Sanger sequencing, pyrosequencing, shotgun sequencing, Illumina sequencing, and SOLiD sequencing.
This session will follow up from transcript quantification of RNAseq data and discusses statistical means of identifying differentially regulated transcripts, and isoforms and contrasts these against microarray analysis approaches.
Genomics is the study of genomes and includes determining entire DNA sequences, genetic mapping, and studying intragenomic phenomena. It allows determining an ideal genotype. Genomics and bioinformatics provide benefits like improved crop productivity, stress tolerance, and nutritional quality. Proteomics studies proteins in cells. Bioinformatics handles large genomic and proteomic data using algorithms. Structural genomics constructs sequence data and maps genes. Functional genomics studies gene function. Comparative genomics compares sequences to find relationships.
The document summarizes various unsupervised learning algorithms used for analyzing gene expression data from microarray experiments, including k-means clustering, self-organizing maps, and hierarchical clustering. It describes how these algorithms group genes based on similarity in their expression profiles across different conditions or cell types without external labels, helping to simplify data sets and identify genes that may be co-regulated or serve similar functions.
Functional genomics uses genome-wide experimental approaches to assess gene function on a large scale. It analyzes gene expression through techniques like transcriptomics and proteomics. Transcriptomics analyzes gene expression profiles through RNA sequencing or microarray analysis. Microarray analysis involves hybridizing fluorescently-labeled cDNA or cRNA to microarrays containing DNA probes to measure gene expression levels across thousands of genes simultaneously. Functional genomics provides a global understanding of gene function and molecular interactions through integrated omics approaches.
Comparative genomics involves comparing genomes to discover similarities and differences. It can provide insights into evolutionary relationships, help predict gene function, and aid in drug discovery. The first step is often aligning genome sequences using tools like BLAST or MUMmer. Genomes can then be compared at various levels, such as overall nucleotide statistics, genome structure, and coding/non-coding regions. Comparing gene and protein content across genomes helps predict functions. Conserved genomic features across species also aid prediction. Insights into genome evolution come from studying molecular events like inversions and duplications. Comparative genomics has impacted phylogenetics and drug target identification.
The document discusses various methods for studying gene expression and function, including analyzing RNA transcripts. It describes techniques like northern hybridization, DNA-mRNA hybridization, S1 nuclease mapping, primer extension, and PCR that can be used to study transcripts and locate start/stop points. The document also covers methods for studying gene regulation, such as identifying protein binding sites through gel retardation assays and footprinting, and using deletion analysis to identify control sequences.
This document discusses RNA structure analysis and computational prediction of RNA secondary structure. It covers the following key points:
RNA is single-stranded but can fold into unique 3D structures guided by base pairing. There are different classes of non-coding RNAs that participate in various cellular processes. Computational prediction of RNA secondary structure is important and can be done through either ab initio or comparative approaches. Ab initio methods predict minimum free energy structures using algorithms like Nussinov and Zuker, while comparative methods analyze covariation between sequences to infer conserved structures. Common tools for RNA structure analysis include MFOLD, RNAfold and tRNAscan-SE.
This document discusses gene identification and genome annotation. It describes how gene finding in eukaryotes is difficult due to smaller percentages of genes in genomes like humans, and larger intron sizes. It covers open reading frames, complications with introns, and the use of six-frame translation to find protein coding sequences. Software tools for structural and functional annotation are outlined, including identifying genes through homology searching and ab initio prediction using hidden Markov models. The accuracy challenges of ab initio prediction are also summarized.
Microarrays allow researchers to analyze gene expression across thousands of genes simultaneously. DNA probes are arrayed on a small glass or nylon slide, and labeled mRNA from samples is hybridized to the probes. Fluorescent scanning detects which genes are expressed. Data analysis includes normalization, distance metrics, clustering, and visualization to group genes with similar expression profiles and identify patterns of co-regulated genes. Microarrays enable functional genomics studies of development, disease, response to drugs or environmental factors, and more.
Comparative genomic hybridization (CGH) is a molecular cytogenetic technique that allows detection of copy number variations between a test and reference DNA sample without cell culturing. CGH involves labeling and hybridizing test and reference DNA to normal metaphase chromosomes before visualizing differences in fluorescence to identify regions of gains or losses. While CGH was originally used for cancer research, it can also detect chromosomal abnormalities associated with genetic disorders and has improved resolution over traditional cytogenetic methods. The main limitations of CGH are its inability to detect structural aberrations without copy number changes and resolutions above 5-10 megabases.
Single-Cell Analysis - Powered by REPLI-g: Single Cell Analysis Series Part 1QIAGEN
What can you do from a single cell? Actually, quite a lot! Beginning with the genome, you can discover new biomarkers by identifying new genetic variances and their association with specific diseases, including cancers. Moving on to RNA, the recent advances in RNA sequencing technology have made single-cell transcriptomics a possibility. Along with these possibilities, come challenges that start from the moment you get the sample to the final step of gaining insights into the cell. This slidedeck will provide an overview on the multiple steps involved as you move from sample acquisition to analysis and data interpretation in different sample types.
Sequenced tagged sites (STS) are short, unique DNA sequences between 100-500 base pairs in length that occur only once in a genome. To be considered an STS, the sequence must be known and have a mapped location in the chromosomes. There are three main types of STS - expressed sequence tags from cDNA analysis, simple sequence length polymorphisms (SSLPS) which are variable length repeats, and random genomic sequences downloaded from databases. STS mapping is done using fragments of DNA, clone libraries containing fragmented chromosomes, or radiation hybrids where chromosomes are broken and recombined through irradiation and hybridization.
This document provides an overview of common proteomics techniques. It describes proteomics as the study of proteins including their roles, structures, localization, interactions and other factors. The key techniques discussed include molecular techniques like DNA microarrays and yeast two-hybrid analysis, separation techniques like gel electrophoresis and chromatography, protein identification methods like mass spectroscopy and Edman sequencing, and protein structure determination methods like NMR, X-ray crystallography and computational prediction. The document provides examples and details of several of these techniques.
The document provides an overview of the history and techniques of transcriptome analysis. It discusses how RNA was separated from DNA with the formulation of the central dogma in 1958. Key developments include the discoveries of messenger RNA, transfer RNA, and ribosomal RNA in the 1960s. The document outlines techniques such as serial analysis of gene expression (SAGE) and RNA sequencing (RNA-seq) that allow comprehensive analysis of gene expression patterns. It provides details on the basic steps and advantages of SAGE and describes how next generation sequencing revolutionized transcriptome analysis through massive parallel sequencing.
Gene expression and transcript profiling involves determining the pattern of genes expressed at the transcriptional level under specific circumstances by measuring the expression of thousands of genes simultaneously. This allows one to understand cellular function. Common techniques for profiling include DNA microarrays, RNA sequencing, and EST tags. DNA microarrays involve hybridizing cDNA or cRNA samples to probes on a chip to determine relative abundance of sequences. RNA sequencing uses next-generation sequencing to reveal presence and quantity of RNA in a sample.
Genetic mapping involves determining the location of genes or markers on chromosomes and the distance between them. It can be used to identify genes responsible for diseases and traits. Physical maps provide the exact positions of genes, while genetic linkage maps show relative locations. Applications include identifying disease-causing genes, aiding forensics investigations, authenticating goods, and improving organ transplants and disease diagnosis. One example is using genetic testing and mapping to customize treatment for phenylketonuria. As genetic sequencing capabilities advance, researchers hope to gain insights into preventing disease triggers, designing customized drugs, and developing gene therapies.
Introduction
Transcriptome analysis
Goal of functional genomics
Why we need functional genomics
Technique
1. At DNA level
2.At RNA level
3. At protein level
4. loss of function
5. functional genomic and bioinformatics
Application
Latest research and reviews
Websites of functional genomics
Conclusions
Reference
This document discusses identifying mutations in the filaggrin gene through sequence analysis. The filaggrin gene codes for filaggrin proteins that are essential for skin barrier function. Mutations in this gene are linked to conditions like eczema and asthma. The study aims to detect faulty filaggrin genes, identify other human and non-human proteins with similar function to filaggrin, and find identical protein sequences to help develop therapeutic options. Sequence alignment methods like pairwise alignment and BLAST will be used to analyze filaggrin genes and identify similar protein sequences.
1. The study analyzed the IgT isotype in Antarctic and non-Antarctic fish species T. bernacchii and B. diacanthus, finding a partial or complete loss of the second constant domain in the Antarctic species.
2. Analysis of T. bernacchii cDNA revealed three IgT variants differing in the length of the region between the first and second constant domains.
3. Genomic analysis showed a remnant of the ancestral second exon present within an intron between the first and second constant exons in T. bernacchii, falling in a duplicated region of different sizes.
‘Omic’ technologies are primarily aimed at the universal detection of genes (genomics), mRNA (transcriptomics),
proteins (proteomics) and metabolites (metabolomics) in a specific biological sample.
This document provides an overview of the cloning process and considerations for designing cloning experiments. It discusses four main steps: insert synthesis, restriction enzyme digestion, ligation, and transformation. Key aspects covered include gene and insert design using software like pDRAW32, choosing appropriate restriction sites and enzymes, primer design for insert synthesis, and vector and bacterial strain selection. The goal is to provide all the important information needed in one place to successfully clone a gene of interest.
The document provides an overview of the cloning process and guidelines for designing cloning experiments. It discusses four main steps in cloning: insert synthesis, restriction enzyme digestion, ligation, and transformation. Key considerations for experimental design include choosing appropriate restriction sites and enzymes, designing the gene insert, and selecting a strategy to synthesize the insert using PCR or overlapping primers. Detailed instructions are provided for using software to design primers and check sequences to ensure in-frame cloning of the gene of interest.
This document provides an overview of the cloning process and considerations for designing cloning experiments. It discusses four main steps: insert synthesis, restriction enzyme digestion, ligation, and transformation. Key aspects covered include gene and insert design using software like pDRAW32, choosing appropriate restriction sites and enzymes, primer design for insert synthesis, and vector and bacterial strain selection. The goal is to provide all the important information needed in one place to successfully clone a gene of interest.
The document provides an overview of the cloning process and guidelines for designing cloning experiments. It discusses the four main steps of cloning: insert synthesis, restriction enzyme digestion, ligation, and transformation. It also covers designing the gene insert, choosing restriction enzymes, and designing primers to synthesize the insert for cloning.
This document provides an overview of the cloning process and considerations for designing cloning experiments. It discusses four main steps: insert synthesis, restriction enzyme digestion, ligation, and transformation. Key aspects covered include gene and insert design using software like pDRAW32, choosing appropriate restriction sites and enzymes, primer design for insert synthesis, and vector and bacterial strain selection. The goal is to provide all the important information needed in one place to successfully clone a gene of interest.
The document summarizes the Open HeliSphere project which aims to make the source code and bioinformatics pipeline for Helicos Genetic Sciences' single molecule sequencing platform openly available. The project will provide access to pre-release source code, documentation, and data through an open source website and infrastructure while dual licensing the code under GPL and commercial terms. The document outlines Helicos' hybrid open/commercial development model and provides details about their single molecule sequencing technique and bioinformatics pipeline for digital gene expression analysis.
The document describes the Sanger method for DNA sequencing, which was developed in 1977. The method uses DNA polymerase and dideoxynucleotides to terminate DNA strand elongation at random positions, generating DNA fragments of different lengths that can be used to determine the DNA sequence. The sequence is read by comparing the fragment lengths generated from reactions with different labeled dideoxynucleotides.
The document discusses using cloud-scale computing for genomic analysis. It provides timing and cost estimates for running a genomic analysis pipeline called Myrna on Amazon EC2 using different numbers of compute nodes. The analysis of 1.1 billion reads would take 4 hours and 20 minutes on 1 master and 10 worker nodes at a cost of $44, or 1 hour and 38 minutes on 1 master and 40 workers at a cost of $66. It also discusses strategies for running genomic tools on cloud infrastructure or single computers.
The document outlines the process of protein synthesis: 1) RNA polymerase copies genes from DNA into mRNA; 2) the mRNA transports the gene to a ribosome; 3) at the ribosome, codons in the mRNA are matched with anticodons to form amino acids which link together via peptide bonds to create a protein chain; 4) the protein folds into its 3D structure to perform its function.
This document summarizes different types of gene mutations including point mutations, substitutions, inversions, additions, and deletions. It provides examples of each type of mutation and how they can affect the coding of amino acids. Specifically, it discusses mutations in the beta-hemoglobin gene that cause inherited blood disorders like sickle cell anemia, in which a single amino acid substitution results in abnormal hemoglobin structure and function.
This document discusses genetic markers used in plant breeding. It defines genetic markers as any phenotypic difference controlled by genes that can be used to study inheritance or select for traits. The document describes two main types of genetic markers - morphological markers which are visible traits, and molecular markers which are detected at the DNA level. It provides details on various molecular marker techniques including RFLP, RAPD, AFLP, SSRs, and SNPs. It explains how each technique works and its advantages and disadvantages. The key information is that genetic markers are tools that allow studying inheritance of genes and selecting plants for breeding based on associated genetic differences.
This document contains 3 gene nucleotide sequences from different organisms:
1) A partial 16S rRNA gene sequence from 'Candidatus Phytoplasma pyri'.
2) The complete capsid protein gene sequence from a porcine circovirus isolate.
3) A partial nucleotide sequence of an ABC-type ATP dependent transporter gene from Rhodobacter sphaeroides.
Forward and reverse primer sequences are also provided for primer design for sequences 1 and 2.
The document describes the process of transcription and translation in a cell. It shows how DNA is transcribed into mRNA by RNA polymerase in the nucleus. The mRNA is then exported through the nuclear pore into the cytoplasm. In the cytoplasm, ribosomes translate the mRNA into a protein by linking amino acids specified by the mRNA codons.
The document describes the Gemoda algorithm for discovering motifs (patterns) in biomolecular data sequences. Gemoda is designed to be exhaustive in finding all maximal motifs and have descriptive power by using a generic, context-dependent definition of similarity. It proceeds in three steps: comparison of all pairwise windows to create a similarity graph, clustering similar windows into elementary motifs, and convolving the motifs to find longer, maximal motifs. Gemoda can be applied to problems like discovering protein domains, solving motif discovery challenges, and finding conserved structures in protein structures.
This document provides an overview of selection analysis using the HyPhy software. It discusses different types of selection including positive, purifying, and neutral selection. The document explains how HyPhy can be used to calculate dN/dS ratios and quantify selection at individual sites or along lineages. It provides information on HyPhy input formats and how to prepare sequence data and phylogenetic trees. The document also outlines standard selection analyses in HyPhy including the REL, FEL and MEME models and how to interpret the output.
Fast qPCR assay optimization and validation techniques for HTS discusses steps for designing a successful qPCR assay, including:
1) Designing primers after running a BLAST search to check for homologous sequences and secondary structures in the target cDNA that could interfere with amplification.
2) Testing primer pairs through a temperature gradient and dilution series to validate the assay's dynamic range before running it hundreds or thousands of times.
3) Choosing an amplicon size between 75-200bp ideally, though larger sizes are possible with new fast reagents. Following these steps at the beginning leads to more effective analysis later.
1. Gene mutations can affect a single gene by causing changes in a single codon through substitutions, inversions, additions or deletions.
2. Substitution mutations may not have serious effects unless they change an amino acid essential to the protein structure/function. For example, a single nucleotide change in the beta-globin gene causes sickle cell anemia.
3. The genetic code is degenerate, meaning a mutation in the third base may not affect the phenotype if it does not change the amino acid. Frameshift mutations from additions or deletions can have more significant effects.
Site directed mutagenesis of β2-microglobulin PowerPoint PresentationTyler Liang
This document describes site-directed mutagenesis experiments performed on beta-2 microglobulin (β2m) to study its role in amyloidosis. Primers were designed to introduce mutations D39V and I5T into β2m. Polymerase chain reaction and transformation were used to generate mutant plasmids, which were sequenced to confirm the mutations. Future studies are planned to introduce mutations W61F and W96F to further study β2m stability and aggregation.
Similar to In silico analysis for unknown data (20)
বাংলাদেশের অর্থনৈতিক সমীক্ষা ২০২৪ [Bangladesh Economic Review 2024 Bangla.pdf] কম্পিউটার , ট্যাব ও স্মার্ট ফোন ভার্সন সহ সম্পূর্ণ বাংলা ই-বুক বা pdf বই " সুচিপত্র ...বুকমার্ক মেনু 🔖 ও হাইপার লিংক মেনু 📝👆 যুক্ত ..
আমাদের সবার জন্য খুব খুব গুরুত্বপূর্ণ একটি বই ..বিসিএস, ব্যাংক, ইউনিভার্সিটি ভর্তি ও যে কোন প্রতিযোগিতা মূলক পরীক্ষার জন্য এর খুব ইম্পরট্যান্ট একটি বিষয় ...তাছাড়া বাংলাদেশের সাম্প্রতিক যে কোন ডাটা বা তথ্য এই বইতে পাবেন ...
তাই একজন নাগরিক হিসাবে এই তথ্য গুলো আপনার জানা প্রয়োজন ...।
বিসিএস ও ব্যাংক এর লিখিত পরীক্ষা ...+এছাড়া মাধ্যমিক ও উচ্চমাধ্যমিকের স্টুডেন্টদের জন্য অনেক কাজে আসবে ...
How to Make a Field Mandatory in Odoo 17Celine George
In Odoo, making a field required can be done through both Python code and XML views. When you set the required attribute to True in Python code, it makes the field required across all views where it's used. Conversely, when you set the required attribute in XML views, it makes the field required only in the context of that particular view.
This slide is special for master students (MIBS & MIFB) in UUM. Also useful for readers who are interested in the topic of contemporary Islamic banking.
The simplified electron and muon model, Oscillating Spacetime: The Foundation...RitikBhardwaj56
Discover the Simplified Electron and Muon Model: A New Wave-Based Approach to Understanding Particles delves into a groundbreaking theory that presents electrons and muons as rotating soliton waves within oscillating spacetime. Geared towards students, researchers, and science buffs, this book breaks down complex ideas into simple explanations. It covers topics such as electron waves, temporal dynamics, and the implications of this model on particle physics. With clear illustrations and easy-to-follow explanations, readers will gain a new outlook on the universe's fundamental nature.
it describes the bony anatomy including the femoral head , acetabulum, labrum . also discusses the capsule , ligaments . muscle that act on the hip joint and the range of motion are outlined. factors affecting hip joint stability and weight transmission through the joint are summarized.
How to Manage Your Lost Opportunities in Odoo 17 CRMCeline George
Odoo 17 CRM allows us to track why we lose sales opportunities with "Lost Reasons." This helps analyze our sales process and identify areas for improvement. Here's how to configure lost reasons in Odoo 17 CRM
हिंदी वर्णमाला पीपीटी, hindi alphabet PPT presentation, hindi varnamala PPT, Hindi Varnamala pdf, हिंदी स्वर, हिंदी व्यंजन, sikhiye hindi varnmala, dr. mulla adam ali, hindi language and literature, hindi alphabet with drawing, hindi alphabet pdf, hindi varnamala for childrens, hindi language, hindi varnamala practice for kids, https://www.drmullaadamali.com
Strategies for Effective Upskilling is a presentation by Chinwendu Peace in a Your Skill Boost Masterclass organisation by the Excellence Foundation for South Sudan on 08th and 09th June 2024 from 1 PM to 3 PM on each day.
4. "All aspects of gathering, storing, handling,
analyzing, interpreting and spreading vast amounts
of biological information in databases. The
information involved includes gene sequences,
biological activity/function, pharmacological activity,
biological structure, molecular structure, protein-
protein interactions, and gene expression.
Bioinformatics uses powerful computers and
statistical techniques to accomplish research
objectives, for example, to discover a new
pharmaceutical or herbicide."
What is bioinformatics?
5. Task flow
• Data what we have
• Search for simlar data in available data base
• Clustal- W
• Phylogenetic analysis
• Classification
• Structural analysis
• Functional analysis
• Reporting
6. Data Outcome
• That may be a nucleotide sequence such as m-
RNA or gene or genome or protein sequence.
• Mostly 16s m-RNA is used to classify a gene or
species.
• With Forward and reverse sequences it will
more accurate.
• We can check with protein also.
9. DNA
Symbol Meaning Explanation
G G Guanine
A A Adenine
T T Thymine
C C Cytosine
R A or G puRine
Y C or T pYrimidine
N A, C, G or T Any base
Double helix
5’
3’
3’
5’
A C G T C A T G
T G C A G T A C
RNA
5’ 3’A C G U C A U G
template
U U Uracil
10. Isolation of the gene of interest from
unknown sample
cDNA library construction kit from Stratagene
1st strand cDNA preparation
and mRNA removal
AAAA
AAAA
AAAA
TTTT
AAAA
TTTT
Removal of commonly hybridized population by
magnetic separation
Differentially up-regulated
mRNA population
Commonly expressed mRNA population
Control mRNA
AAAA
TTTT
TTTT
AAAA
TTTT
AAAA
AAAA
TTTT
AAAA
AAAA
AAAA
AAAA
TTTT
TTTT
TTTT
TTTT
stress mRNA
Hybridization of stress mRNA with excess of
complementary 1st strand control cDNA
TTTT TTTT
11. Gene and protein of EIF4A
ATGGCGGCGSCCACCACSTCCCGCCGCGGCGCCGGCGCCTCCCGCAGCATGGACGACGAGAACCTCACCTTCGAGACCTCCCCGGGTG
TCGAGGTCGTCAGCAGCTTCGACCAGATGGGGATCAAGGACGACCTCCTCCGCGGCATCTACGGCTACGGGTTCGAGAAGCCCTCCGC
CATCCAGCAGCGCGCCGTCCTCCCCATCATCAACGGACGCGACGTCATCGCGCAGGCCCAGTCCGGCACCGGGAAGTCATCCATGATC
TCACTCACCGTATGCCAGATCGTCGACACCGCAGTCCGCGAGGTCCAGGCTCTGATCCTCTCACCCACCAGGGAGCTCGCTTCGCAGA
CAGAGAAGGTTATGCTGGCTGTCGGCGACTACCTCAATATCCAAGTGCACGCTTGCATTGGTGGGAAAAGTATCAGCGAGGATATCAG
GAGGCTTGAGAACGGAGTCCATGTTGTCTCTGGGACTCCGGGCAGAGTCTGCGATATGATCAAGAGGAGGACCCTGCGGACAAGAGCC
ATCAAGCTTCTAGTTCTGGATGAGGCTGATGAGATGTTGAGCAGAGGCTTTAAGGATCAGATTTACGATGTCTACAGATACCTCCCAC
CCGAACTTCAGGTCGTTTTGATCTCCGCCACTCTTCCTCACGAGATCCTAGAGATGACTAGCAAGTTCATGACCGAACCAGTTAGGAT
CCTTGTGAAGCGTGATGAGTTGACCCTGGAGGGTATCAAACAATTCTTCGTTGCTGTTGAGAAAGAGGAATGGAAGTTTGATACGCTG
TGTGATCTTTATGATACGTTGACCATCACCCAAGCTGTTATTTTCTGCAATACTAAGAGAAAGGTGGATTGGCTTACTGAAAGAATGC
GCAGCAATAACTTCACAGTATCAGCTATGCATGGTGACATGCCCCAACAGGAAAGGGATGCCATCATGACAGAGTTCAGGTCTGGTGC
AACTCGTGTGCTAATCACTACGGATGTTTGGGCTCGAGGGCTGGATGTTCAGCAGGTTTCACTTGTCATAAATTATGATCTCCCAAAT
AATCGTGAGCTTTACATCCATCGCATCGGTCGCTCTGGTCGTTTTGGGCGCAAGGGTGTGGCGATCAATTTTGTGCGCAAGGATGACA
TCCGTATCCTGAGGGATATAGAACAGTACTACAGCACACAAATTGATGAGATGCCAATGAATGTTGCTGATCTAATTTGA
"MAAXTTSRRGAGASRSMDDENLTFETSPGVEVVSSFDQMGIKDDLLRGIYGYGFEKPSAIQQRAVLPIINGRDVIAQAQSGTGKSSM
ISLTVCQIVDTAVREVQALILSPTRELASQTEKVMLAVGDYLNIQVHACIGGKSISEDIRRLENGVHVVSGTPGRVCDMIKRRTLRTR
AIKLLVLDEADEMLSRGFKDQIYDVYRYLPPELQVVLISATLPHEILEMTSKFMTEPVRILVKRDELTLEGIKQFFVAVEKEEWKFDT
LCDLYDTLTITQAVIFCNTKRKVDWLTERMRSNNFTVSAMHGDMPQQERDAIMTEFRSGATRVLITTDVWARGLDVQQVSLVINYDLP
NNRELYIHRIGRSGRFGRKGVAINFVRKDDIRILRDIEQYYSTQIDEMPMNVADLI"
13. 13
ABOUT THE GENE AND PROTEINE
GENE LENGTH : 1224bp
INTRONS NUMBER : 7
EXON NUMBER : 8
GENE MOLECULAR WEIGHT : 378411.66 - 378491.72 Daltons
PROTEIN LENGTH : 407 AA
MOLECULAR WEIGHT : 45.2KDA
ISO ELECTIC POINT : 6.10
14. Search for simlar data in available data base
• The date will subjected for similar data search
in NCBI or Phytozome or some more available
databases with BLAST tool.
• Download the data from the data base.
Note:
• always keep data in notepad for working
convenience.
• Now we are presenting unpublished data.
17. Clustal- W
• Now the finalized data will subject to Clustal
alignment for sequence similarity.
• Clustal- W is the tool for searching and
mapping more similarities in sequences.
• This may allow for nucleotide sequences and
proteins.
• Mostly protein sequences are subjected for
the alignment for accuracy.
20. Phylogenetic analysis
• After alignment the data will subject for the
phylogenetic analysis.
• Here the relation between the data source will
be evaluated.
• Most similar sequence will place near the
sequence less similar sequence will place in
distance.
• By counting the distance we can measure the
relation between data source.
22. 22
Fig 1: 20-404: P-LOOP COTAINIG NUCLIOSIDE TRIOSE PHOSPATE
HYDROLASE(ipr027417).
34-62: RNA- HELICASE, DEAD BOX TYPE Q-MOTIF (IPR014014).
246-407: HELICASE C-TERMINAL (IPR001650)
183-186: REPRESENCE OF DEAD AMINO ACIDS
ATG GCG GCG SCC ACC ACS TCC CGC CGC GGC GCC GGC GCC TCC CGC AGC ATG GAC GAC GAG AAC CTC ACC TTC
M A A X T T S R R G A G A S R S M D D E N L T F 24
GAG ACC TCC CCG GGT GTC GAG GTC GTC AGC AGC TTC GAC CAG ATG GGG ATC AAG GAC GAC CTC CTC CGC GGC
E T S P G V E V V S S F D Q M G I K D D L L R G 48
ATC TAC GGC TAC GGG TTC GAG AAG CCC TCC GCC ATC CAG CAG CGC GCC GTC CTC CCC ATC ATC AAC GGA CGC
I Y G Y G F E K P S A I Q Q R A V L P I I N G R
GAC GTC ATC GCG CAG GCC CAG TCC GGC ACC GGG AAG TCA TCC ATG ATC TCA CTC ACC GTA TGC CAG ATC GTC
D V I A Q A Q S G T G K S S M I S L T V C Q I V
GAC ACC GCA GTC CGC GAG GTC CAG GCT CTG ATC CTC TCA CCC ACC AGG GAG CTC GCT TCG CAG ACA GAG AAG
D T A V R E V Q A L I L S P T R E L A S Q T E K
GTT ATG CTG GCT GTC GGC GAC TAC CTC AAT ATC CAA GTG CAC GCT TGC ATT GGT GGG AAA AGT ATC AGC GAG
V M L A V G D Y L N I Q V H A C I G G K S I S E
GAT ATC AGG AGG CTT GAG AAC GGA GTC CAT GTT GTC TCT GGG ACT CCG GGC AGA GTC TGC GAT ATG ATC AAG
D I R R L E N G V H V V S G T P G R V C D M I K
AGG AGG ACC CTG CGG ACA AGA GCC ATC AAG CTT CTA GTT CTG GAT GAG GCT GAT GAG ATG TTG AGC AGA GGC
R R T L R T R A I K L L V L D E A D E M L S R G
TTT AAG GAT CAG ATT TAC GAT GTC TAC AGA TAC CTC CCA CCC GAA CTT CAG GTC GTT TTG ATC TCC GCC ACT
F K D Q I Y D V Y R Y L P P E L Q V V L I S A T
CTT CCT CAC GAG ATC CTA GAG ATG ACT AGC AAG TTC ATG ACC GAA CCA GTT AGG ATC CTT GTG AAG CGT GAT
L P H E I L E M T S K F M T E P V R I L V K R D
GAG TTG ACC CTG GAG GGT ATC AAA CAA TTC TTC GTT GCT GTT GAG AAA GAG GAA TGG AAG TTT GAT ACG CTG
E L T L E G I K Q F F V A V E K E E W K F D T L
TGT GAT CTT TAT GAT ACG TTG ACC ATC ACC CAA GCT GTT ATT TTC TGC AAT ACT AAG AGA AAG GTG GAT TGG
C D L Y D T L T I T Q A V I F C N T K R K V D W
CTT ACT GAA AGA ATG CGC AGC AAT AAC TTC ACA GTA TCA GCT ATG CAT GGT GAC ATG CCC CAA CAG GAA AGG
L T E R M R S N N F T V S A M H G D M P Q Q E R
GAT GCC ATC ATG ACA GAG TTC AGG TCT GGT GCA ACT CGT GTG CTA ATC ACT ACG GAT GTT TGG GCT CGA GGG
D A I M T E F R S G A T R V L I T T D V W A R G
CTG GAT GTT CAG CAG GTT TCA CTT GTC ATA AAT TAT GAT CTC CCA AAT AAT CGT GAG CTT TAC ATC CAT CGC
L D V Q Q V S L V I N Y D L P N N R E L Y I H R
ATC GGT CGC TCT GGT CGT TTT GGG CGC AAG GGT GTG GCG ATC AAT TTT GTG CGC AAG GAT GAC ATC CGT ATC
I G R S G R F G R K G V A I N F V R K D D I R I
CTG AGG GAT ATA GAA CAG TAC TAC AGC ACA CAA ATT GAT GAG ATG CCA ATG AAT GTT GCT GAT CTA ATT TGA
L R D I E Q Y Y S T Q I D E M P M N V A D L I *
23. Structural analysis
• Structural analysis will conduct for protein
through homology modeling & docking.
• The protein sequence secondary structure and
tertiary structure analysis must be done.
• This structure analysis must be evaluated
under Nuclear magnetic resonance score and
X-Ray crystallographic score.
• Ramachandra plot is more important for
structural validation.
24. 24
Insilco analysis of eIF4A
Homology modeling:
by using Modeller 9.12 version we have designed structure of eIF4A
Pennisetum glaucum
α-helics
β- pleated
sheets
DEAD box
motif
Fig: Homology modeling of amino acid sequence of eiF4A from P. glaucum
revealing the signature motifs of DEAD box and Mg2+ binding sites. eiF4A
showed the ----helices and --------sheets.
28. Functional analysis
• Functional analysis will be done with domain
and conserved motifs and active site analysis.
• These are evaluated with docking and amino
acid composition.
• Depend on αhelices β-pleated sheets the
protein structure can be obtained.
29. 29
Docking analysis and motif localization in Pennisetum glaccum EIF4A
Docking analysis was
performed by using Sybil
6.7 version for motif
analysis and structural
stability.
30. Rice and pearl millet Active sites, Motifs and Domains of eif4a
respectively done by docking studies
31. Classification
• Functional analysis and structural analysis can
classify our protein.
• At first we got the relation of the protein
through phylogenetic analysis.
• Now with structural and functional characters
can be include and clear classification will be
performed.
32. Reporting
• Now the data which was evaluated in a way
with accuracy you can publish or report.
• So many submissions and sequence uploads
are taking place at various levels.
• Genes are reporting, proteins are reporting,
genomes are also reporting to those
databases.
• Those will be available for further research
aspects.
33. Conclusion
• With In-silico studies you will get 60 to 70%
accuracy of the information regarding your
work.
• With this you can confirm whether you are
working on proper thing or not before starting
your In-vitro studies.
• So you can proceed towards your work with
70% of In-silico information and complete the
project with 100% success in .
34. Acknowledgement
• Agri biotech foundation
• Department of Biotechnology
• Prof . G. Pakkireddy,
• Dr. J. S. Bentur
• Dr. G. Mallikarjun
• My Friends and colleagues
• Dearest participants (transformed with high
energy and patience)
Editor's Notes
Fig: Stuctural organization of eif4A gene from Pennisetum glaucum: A schematic representation of PgeiF4A protein structure containing three motifs: 34-62: RNA-helicase, DEAD box type Q-motif (indicated as strait line); 246-407; Helicase C-terminal (dotted lines); Deduced amino acid sequence is placed
beneath the nucleotide sequence (single letter code). Various functional domains in the sequence have been significantly marked, such as N-terminal ATPase domain (regular font), linker region (bold font), substrate-binding domain (shaded gray) and c-terminal domain
(italics). Deduced amino acid sequence containing four binding sites:1. ATP binding site (), 2. Mg2+ binding site, 3. Nucleotide binding site, 4. ATP binding site (). Deduced amino acid sequence is placed beneath the nucleotide sequence (single letter code). Various functional domains in the sequence have been significantly marked, such as N-terminal ATPase domain (regular font), linker region (bold font), substrate-binding domain (shaded gray) and c-terminal domain (italics).
Ramachandran plot for protein structure analysis
docking analysis was performed by using Sybil 6.7 version for motif analysis and structural stability.