Downloaded 211 times
![Pulmonary Nodule Detection CAD system
CAD systems Lung segmentation Nodule Candidate Detection False Positive Reduction
Suzuki et al.(2003)[3] Thresholding Multiple thresholding MTANN
Rubin et al.(2005)[4] Thresholding Surface normal overlap
Lantern transform and rule-
based classifier
Dehmeshki et al.(2007)[5] Adaptive thresholding Shape-based GATM Rule-based filtering
Suarez-Cuenca et al.(2009)[6]
Thresholding and 3-D
connected component
labeling
3-D iris filtering
Multiple rule-based LDA
classifier
Golosio et al.(2009)[7] Isosurface-triangulation Multiple thresholding Neural network
Ye et al.(2009)[8]
3-D adaptive fuzzy
segmentation
Shape based detection
Rule-based filtering and
weighted SVM classifier
Sousa et al.(2010)[9] Region growing Structure extraction SVM classifier
Messay et al.(2010)[10]
Thresholding and 3-D
connected component
labeling
Multiple thresholding and
morphological opening
Fisher linear discriminant and
quadratic classifier
Riccardi et al.(2011)[11] Iterative thresholding
3-D fast radial filtering and
scale space analysis
Zernike MIP classification
based on SVM
Cascio et al.(2012)[12] Region growing Mass-spring model
Double-threshold cut and
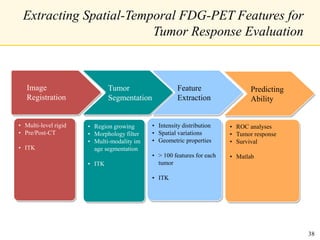
neural network 13](https://image.slidesharecdn.com/wookjinchoi-imageprocessinginlungcancerscreeningandtreatment-copy-160310055343/85/Image-processing-in-lung-cancer-screening-and-treatment-13-320.jpg)
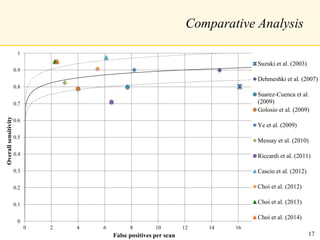
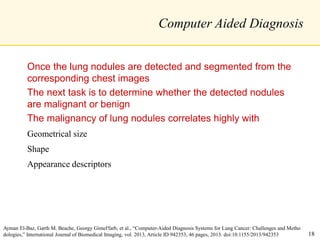
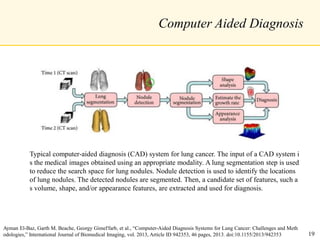
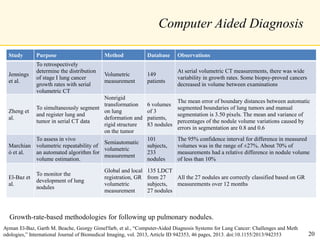
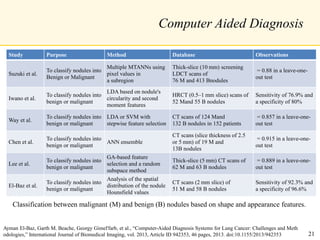
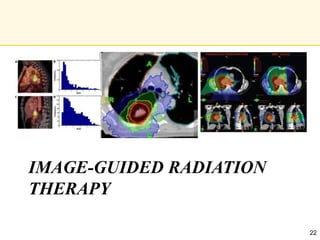
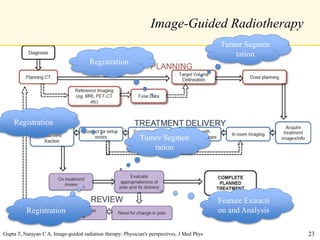
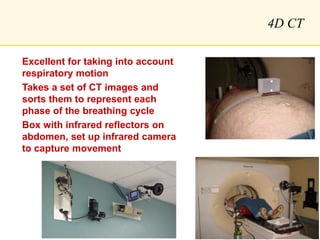
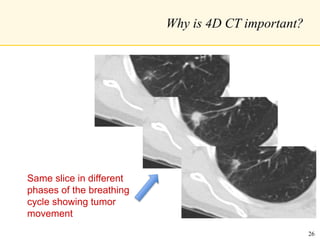
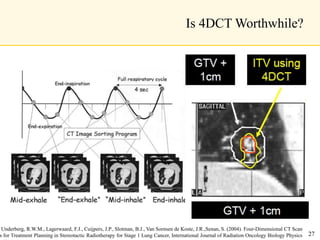
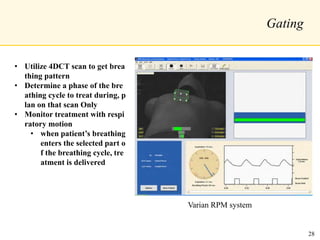
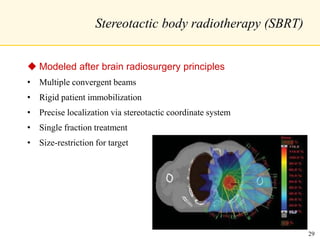

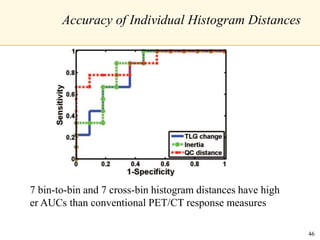
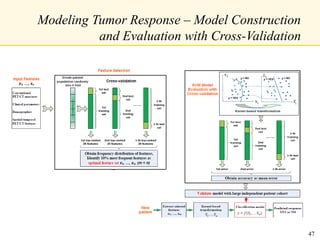
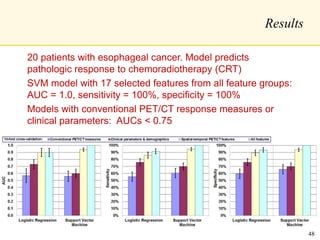
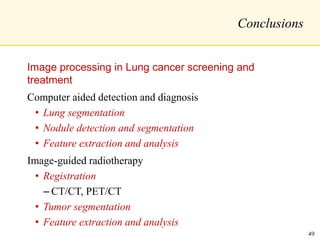


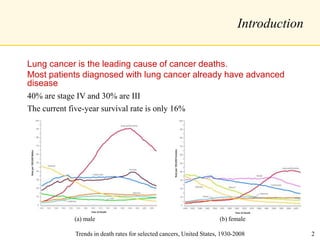
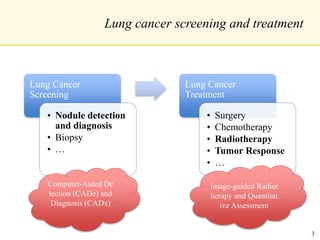
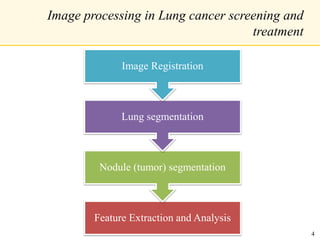
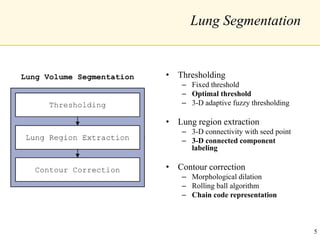
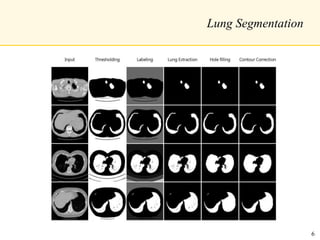
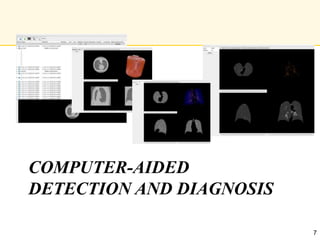
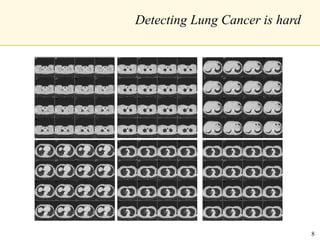
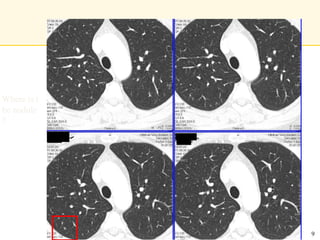
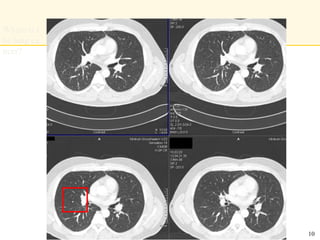
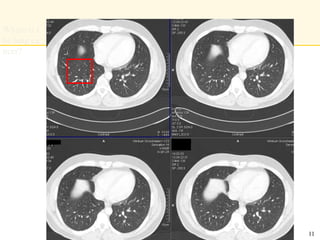
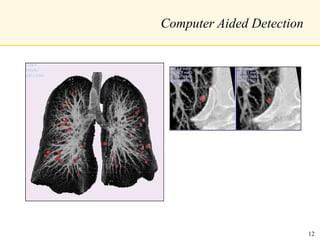
The document discusses image processing techniques for lung cancer screening and treatment. It covers topics like lung segmentation, nodule detection, computer-aided diagnosis, image-guided radiotherapy, and quantitative assessment of tumor response. Lung segmentation is used to isolate the lungs from other organs in CT images. Nodule detection algorithms then aim to find potential cancerous nodules. Computer-aided diagnosis systems analyze extracted features of nodules to determine if they are malignant or benign. Image-guided radiotherapy utilizes 4D CT and gating to account for tumor motion during treatment. Quantitative metrics like standardized uptake value are used to assess tumor response in PET imaging.


![CASE_PRESENTATION_ON_subdural_hematoma(SDH)[1 FINAL PPT]-1.pptx](https://cdn.slidesharecdn.com/ss_thumbnails/casepresentationonsubduralhematomasdh1finalppt-1-260129172522-d405d375-thumbnail.jpg?width=640&height=640&fit=bounds)
