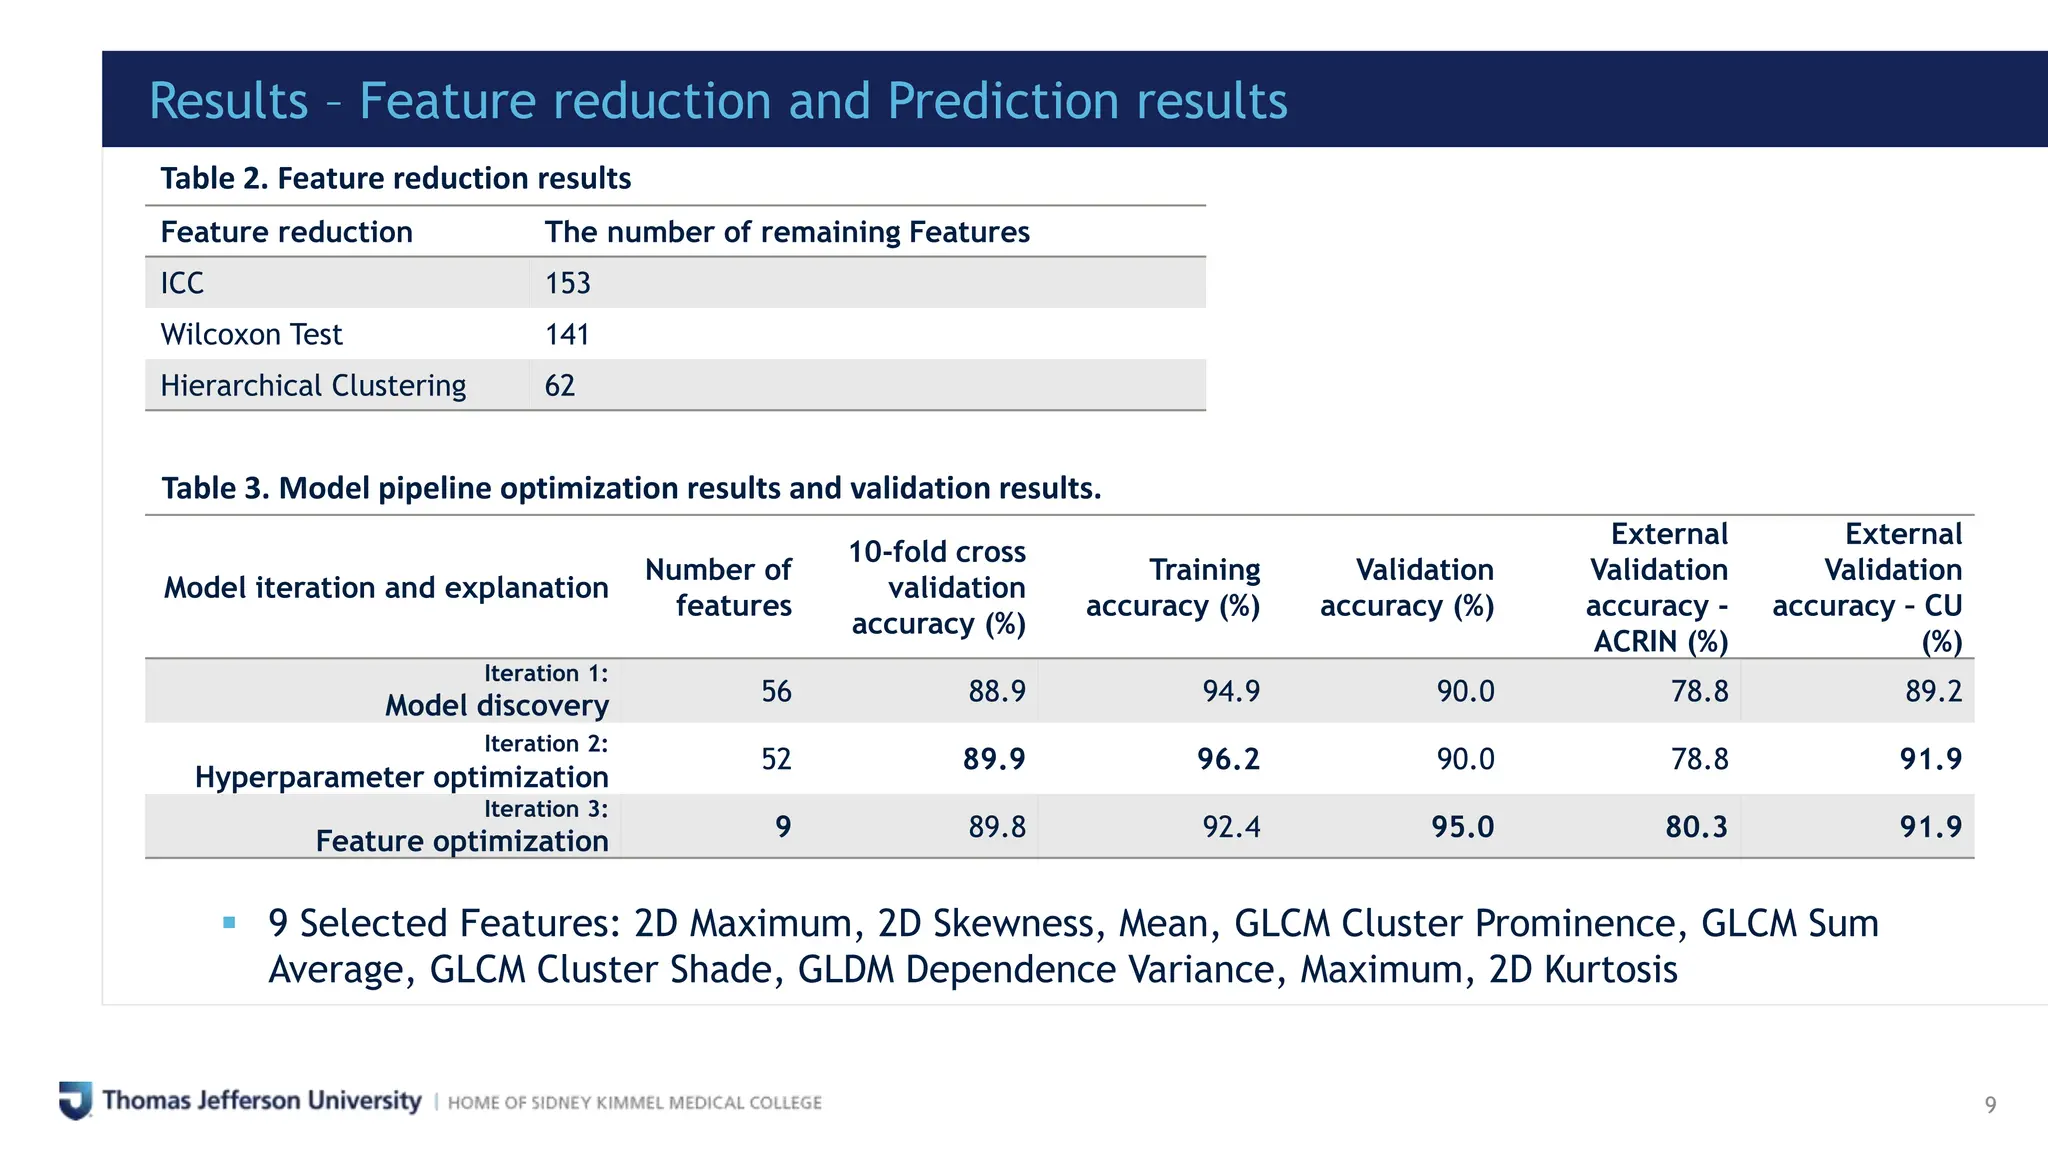
Novel Functional Radiomics for
Prediction of Cardiac PET Avidity
in Lung Cancer Radiotherapy
W. Choi1, Y. Jia1, J. Kwak2, A. P. Dicker1, N. L. Simone1, E. Storozynsky3, V. Jain1, and Y. Vinogradskiy
1Department of Radiation Oncology, Sidney Kimmel Medical College at Thomas Jefferson University, Philadelphia,
PA,
2University of Colorado School of Medicine, Aurora, CO,
3Department of Cardiology, Sidney Kimmel Medical College at Thomas Jefferson University, Philadelphia, PA
• Thomas Jefferson University
• A research grant from ViewRay, Inc.
• A research grant from the PROPEL Center
• Research SW license for INT Contour from Carina Medical
2
Disclosure
• Traditional methods of evaluating cardiotoxicity:
 Focus solely on radiation doses to the heart.
 Do not incorporate functional imaging information.
• Functional imaging has potential to improve cardiotoxicity prediction for
lung cancer patients undergoing radiotherapy:
 FDG PET/CT imaging is routinely obtained for lung cancer staging.
 PET scans can be used to evaluate cardiac inflammation.
 Studies indicate that PET cardiac signal can predict clinical outcomes.
• The purpose of this work:
 Develop a radiomics model to predict clinical cardiac assessment using FDG PET/CT
scans.
Introduction
3
• The study included 209 pre-treatment 18F-FDG PET-CT images of lung cancer patients from 3
different study populations (TJU: 100, ACRIN: 70, CU: 39).
 Low quality images were excluded 7 (TJU: 1, ACRIN: 4, CU:2).
Dataset
CLASS
LV MYOCARDIAL
UPTAKE PATTERN
TJU ACRIN CU TOTAL
0 Uniform 19 (19.2%) 21 (31.8%) 11 (29.8%) 51 (25.2%)
1 Absent 44 (44.4%) 23 (34.8%) 13 (35.1%) 80 (39.6%)
2 Heterogeneous 36 (36.4%) 22 (33.3%) 13 (35.1%) 71 (35.1%)
ALL 99 (100.0%) 66 (100.0%) 37 (100.0%) 202 (100.0%)
Table 1. Statistics of LV FDG Uptake Pattern Classification
Figure 2. Cardiac uptake classifications, Uniform, Absent, and Heterogeneous (Non-uniform and Focal )
4
5
Method - Study Flow Diagram
Figure 1. Study and cardiac model diagram, training dataset: TJU (N=99), and external validation data sets: ACRIN (N=66) and CU (N=37).
RFE: Recursive Feature Elimination, SFS: Sequential Feature Selection
1. Pre-processing
LV FDG uptake patter
review
By Radiation Oncologist
Manual
Heart Contouring
By Medical Physicist
Automatic
Heart Contouring
By 1Commercial Software
Training
Data set
(N=99)
2. Feature Analysis
Feature Extraction
- PyRadiomics
- In-house SW
Feature Reduction
- Wilcoxon test
- Clustering
Feature Selection
- RFE
- SFS
3. Model Building
Model Exploration
- TPOT
Optimization
- Hyper-parameters
- Feature Selection
Evaluation
- Validation
- External validation
Predicted
LV Uptake
Pattern
External
Validation
Data sets
(N=103)
1INTContour, Carina Medical https://www.carinaai.com/intcontour.html
• Training and Validation Data:
 Training dataset: TJU (N=100), 80% training set (TPOT optimization), 20% validation set.
 External validation datasets: ACRIN (N=70), CU (N=39)
• Radiomics Feature Extraction
 Heart delineation: Manual and Auto
 Selected 200 novel functional radiomics features – In-house: 103, PyRadiomics: 97
 Feature categories include Shape (2D and 3D), First-order (2D and 3D), GLCM, GLSZM, GLRLM, NGTDM,
GLDM.
• Feature Reduction
 Feature robustness test using ICC between features from Auto and Manual delineations
 Wilcoxon test (Bonferroni adjusted p<0.05)
 Hierarchical clustering
Method – Radiomics Feature Extraction and Reduction
6
• TPOT (Tree-Based Pipeline Optimization Tool)
 100 populations, 10 generations
 Evaluated 10,000 pipeline configurations to identify the best model.
• Pipeline Construction
 Three component template: Feature Selector—Feature Transformer—Classifier
o Feature Selector: P-value (ANOVA F-statistic), Family Wise Error Rate, Percentile, Low-Variance Feature Removal, RFE
with Extra Trees Classifier
o Feature Transformer: Binarization, ICA, Feature Agglomeration (Various Linkage & Affinity Methods), Scaling (Max
Absolute Value, Min-Max Values), Normalization (l1, l2, max norm) ,Kernel Approximation (RBF, Cosine, χ2, etc.), PCA,
Polynomial Features, RBF Sampler, Robust Scaler, Standard Scaler, Zero Count, One Hot Encoder
o Classifier: Naïve Bayesian (Bernoulli, Multinomial), Decision Tree Classifier, Extra Trees Classifier, Random Forest
Classifier, Gradient Boosting Classifier, XGBoost, KNN Classifier, Linear SVM Classifier, Logistic Regression, SGD, MLP
• Hyper-parameter Optimization: optimize parameters of the discovered pipeline
• Feature Optimization: Utilized RFE for feature ranking followed by SFS with TPOT optimization.
Method - Machine Learning Model Pipeline Selection and Optimization
7
8
Results: Pipeline Optimization using TPOT
Feature Selector
Variance Threshold
Threshold: 0.0001
56 features
Threshold: 0.005
52 features
RFE ranking and
SFS with TPOT optimization
Top 9 features
Feature Transformer
One Hot Encoder
Minimum_fraction: 0.15,
Sparse: False,
Threshold: 10
Minimum_fraction: 0.25
Minimum_fraction: 0.15
Classifier
Extra Trees Classifier
Bootstrap: False,
criterion: gini,
max_features: 0.95,
min_samples_leaf: 3,
min_samples_split: 20
Criterion: entropy,
max_features: 0.75,
min_samples_leaf: 2,
min_samples_split: 17
Bootstrap: True,
criterion: gini,
max_features: 0.8,
min_samples_split: 10
Model
Discovery
Hyper-
parameter
Optimization
Feature
Optimization
Validation Accuracy (%)
TJU ACRIN CU
90.0 78.8 90.2
90.0 78.8 91.9
95.0 80.3 91.9
Results – Feature reduction and Prediction results
Model iteration and explanation
Number of
features
10-fold cross
validation
accuracy (%)
Training
accuracy (%)
Validation
accuracy (%)
External
Validation
accuracy -
ACRIN (%)
External
Validation
accuracy – CU
(%)
Iteration 1:
Model discovery 56 88.9 94.9 90.0 78.8 89.2
Iteration 2:
Hyperparameter optimization
52 89.9 96.2 90.0 78.8 91.9
Iteration 3:
Feature optimization 9 89.8 92.4 95.0 80.3 91.9
 9 Selected Features: 2D Maximum, 2D Skewness, Mean, GLCM Cluster Prominence, GLCM Sum
Average, GLCM Cluster Shade, GLDM Dependence Variance, Maximum, 2D Kurtosis
Feature reduction The number of remaining Features
ICC 153
Wilcoxon Test 141
Hierarchical Clustering 62
Table 3. Model pipeline optimization results and validation results.
Table 2. Feature reduction results
9
• Utilized dataset of 209 patients for functional cardiac radiomics model
development.
• Achieved high accuracy:
 9 optimal features were selected
 Training set validation: TJU: 95%
 External validation : ACRIN: 80.3%, CU: 91.1%
• Clinical Application:
 Automated prediction of existing cardiac conditions.
 Early biomarker for post-radiotherapy cardiac complications.
Conclusion
10
Thank you !
Jefferson.edu

Novel Functional Radiomics for Prediction of Cardiac PET Avidity in Lung Cancer Radiotherapy

  • 1.
    Novel Functional Radiomicsfor Prediction of Cardiac PET Avidity in Lung Cancer Radiotherapy W. Choi1, Y. Jia1, J. Kwak2, A. P. Dicker1, N. L. Simone1, E. Storozynsky3, V. Jain1, and Y. Vinogradskiy 1Department of Radiation Oncology, Sidney Kimmel Medical College at Thomas Jefferson University, Philadelphia, PA, 2University of Colorado School of Medicine, Aurora, CO, 3Department of Cardiology, Sidney Kimmel Medical College at Thomas Jefferson University, Philadelphia, PA
  • 2.
    • Thomas JeffersonUniversity • A research grant from ViewRay, Inc. • A research grant from the PROPEL Center • Research SW license for INT Contour from Carina Medical 2 Disclosure
  • 3.
    • Traditional methodsof evaluating cardiotoxicity:  Focus solely on radiation doses to the heart.  Do not incorporate functional imaging information. • Functional imaging has potential to improve cardiotoxicity prediction for lung cancer patients undergoing radiotherapy:  FDG PET/CT imaging is routinely obtained for lung cancer staging.  PET scans can be used to evaluate cardiac inflammation.  Studies indicate that PET cardiac signal can predict clinical outcomes. • The purpose of this work:  Develop a radiomics model to predict clinical cardiac assessment using FDG PET/CT scans. Introduction 3
  • 4.
    • The studyincluded 209 pre-treatment 18F-FDG PET-CT images of lung cancer patients from 3 different study populations (TJU: 100, ACRIN: 70, CU: 39).  Low quality images were excluded 7 (TJU: 1, ACRIN: 4, CU:2). Dataset CLASS LV MYOCARDIAL UPTAKE PATTERN TJU ACRIN CU TOTAL 0 Uniform 19 (19.2%) 21 (31.8%) 11 (29.8%) 51 (25.2%) 1 Absent 44 (44.4%) 23 (34.8%) 13 (35.1%) 80 (39.6%) 2 Heterogeneous 36 (36.4%) 22 (33.3%) 13 (35.1%) 71 (35.1%) ALL 99 (100.0%) 66 (100.0%) 37 (100.0%) 202 (100.0%) Table 1. Statistics of LV FDG Uptake Pattern Classification Figure 2. Cardiac uptake classifications, Uniform, Absent, and Heterogeneous (Non-uniform and Focal ) 4
  • 5.
    5 Method - StudyFlow Diagram Figure 1. Study and cardiac model diagram, training dataset: TJU (N=99), and external validation data sets: ACRIN (N=66) and CU (N=37). RFE: Recursive Feature Elimination, SFS: Sequential Feature Selection 1. Pre-processing LV FDG uptake patter review By Radiation Oncologist Manual Heart Contouring By Medical Physicist Automatic Heart Contouring By 1Commercial Software Training Data set (N=99) 2. Feature Analysis Feature Extraction - PyRadiomics - In-house SW Feature Reduction - Wilcoxon test - Clustering Feature Selection - RFE - SFS 3. Model Building Model Exploration - TPOT Optimization - Hyper-parameters - Feature Selection Evaluation - Validation - External validation Predicted LV Uptake Pattern External Validation Data sets (N=103) 1INTContour, Carina Medical https://www.carinaai.com/intcontour.html
  • 6.
    • Training andValidation Data:  Training dataset: TJU (N=100), 80% training set (TPOT optimization), 20% validation set.  External validation datasets: ACRIN (N=70), CU (N=39) • Radiomics Feature Extraction  Heart delineation: Manual and Auto  Selected 200 novel functional radiomics features – In-house: 103, PyRadiomics: 97  Feature categories include Shape (2D and 3D), First-order (2D and 3D), GLCM, GLSZM, GLRLM, NGTDM, GLDM. • Feature Reduction  Feature robustness test using ICC between features from Auto and Manual delineations  Wilcoxon test (Bonferroni adjusted p<0.05)  Hierarchical clustering Method – Radiomics Feature Extraction and Reduction 6
  • 7.
    • TPOT (Tree-BasedPipeline Optimization Tool)  100 populations, 10 generations  Evaluated 10,000 pipeline configurations to identify the best model. • Pipeline Construction  Three component template: Feature Selector—Feature Transformer—Classifier o Feature Selector: P-value (ANOVA F-statistic), Family Wise Error Rate, Percentile, Low-Variance Feature Removal, RFE with Extra Trees Classifier o Feature Transformer: Binarization, ICA, Feature Agglomeration (Various Linkage & Affinity Methods), Scaling (Max Absolute Value, Min-Max Values), Normalization (l1, l2, max norm) ,Kernel Approximation (RBF, Cosine, χ2, etc.), PCA, Polynomial Features, RBF Sampler, Robust Scaler, Standard Scaler, Zero Count, One Hot Encoder o Classifier: Naïve Bayesian (Bernoulli, Multinomial), Decision Tree Classifier, Extra Trees Classifier, Random Forest Classifier, Gradient Boosting Classifier, XGBoost, KNN Classifier, Linear SVM Classifier, Logistic Regression, SGD, MLP • Hyper-parameter Optimization: optimize parameters of the discovered pipeline • Feature Optimization: Utilized RFE for feature ranking followed by SFS with TPOT optimization. Method - Machine Learning Model Pipeline Selection and Optimization 7
  • 8.
    8 Results: Pipeline Optimizationusing TPOT Feature Selector Variance Threshold Threshold: 0.0001 56 features Threshold: 0.005 52 features RFE ranking and SFS with TPOT optimization Top 9 features Feature Transformer One Hot Encoder Minimum_fraction: 0.15, Sparse: False, Threshold: 10 Minimum_fraction: 0.25 Minimum_fraction: 0.15 Classifier Extra Trees Classifier Bootstrap: False, criterion: gini, max_features: 0.95, min_samples_leaf: 3, min_samples_split: 20 Criterion: entropy, max_features: 0.75, min_samples_leaf: 2, min_samples_split: 17 Bootstrap: True, criterion: gini, max_features: 0.8, min_samples_split: 10 Model Discovery Hyper- parameter Optimization Feature Optimization Validation Accuracy (%) TJU ACRIN CU 90.0 78.8 90.2 90.0 78.8 91.9 95.0 80.3 91.9
  • 9.
    Results – Featurereduction and Prediction results Model iteration and explanation Number of features 10-fold cross validation accuracy (%) Training accuracy (%) Validation accuracy (%) External Validation accuracy - ACRIN (%) External Validation accuracy – CU (%) Iteration 1: Model discovery 56 88.9 94.9 90.0 78.8 89.2 Iteration 2: Hyperparameter optimization 52 89.9 96.2 90.0 78.8 91.9 Iteration 3: Feature optimization 9 89.8 92.4 95.0 80.3 91.9  9 Selected Features: 2D Maximum, 2D Skewness, Mean, GLCM Cluster Prominence, GLCM Sum Average, GLCM Cluster Shade, GLDM Dependence Variance, Maximum, 2D Kurtosis Feature reduction The number of remaining Features ICC 153 Wilcoxon Test 141 Hierarchical Clustering 62 Table 3. Model pipeline optimization results and validation results. Table 2. Feature reduction results 9
  • 10.
    • Utilized datasetof 209 patients for functional cardiac radiomics model development. • Achieved high accuracy:  9 optimal features were selected  Training set validation: TJU: 95%  External validation : ACRIN: 80.3%, CU: 91.1% • Clinical Application:  Automated prediction of existing cardiac conditions.  Early biomarker for post-radiotherapy cardiac complications. Conclusion 10
  • 11.
  • 12.

Editor's Notes

  • #7  gray level co-occurrence matrix (GLCM), gray level size zone matrix (GLSZM), gray level run length matrix (GLRLM), neighboring gray tone difference matrix (NGTDM), gray level dependence matrix (GLDM), and 2D and 3D shape features.
  • #8  gray level co-occurrence matrix (GLCM), gray level size zone matrix (GLSZM), gray level run length matrix (GLRLM), neighboring gray tone difference matrix (NGTDM), gray level dependence matrix (GLDM), and 2D and 3D shape features.