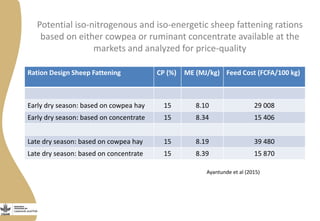
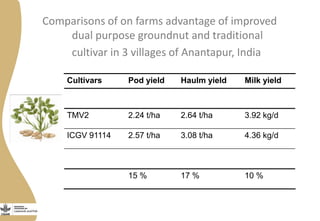
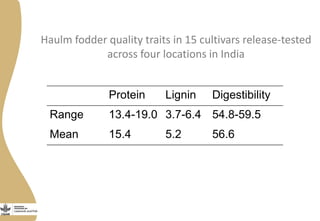
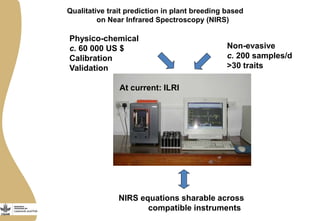
Download to read offline
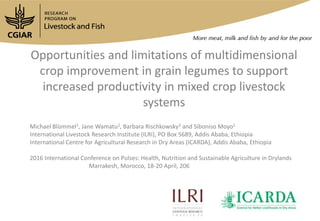
![Crop N % IVOMD % Source
Mean Range Mean Range
Cowpea [50x2x5] 2.2 1.5 – 2.5 59.1 56.7-61.0 Samireddipally et al (2016)
Groundnut [800] 1.7 1.2 – 2.3 56.3 51.7-61.1 Nigam & Blümmel (2014)
Chickpea [280] 0.7 0.4-1.7 49.5 44.0-58.6 Blümmel et al (2016)
Chickpea [475] 0.9 0.5-1.4 49.3 44.9-53.7 Wamatu et al (2016)
Field Pea [144] 1.25 0.6-1.5 50.1 47.8-52.5 Wamatu et al (2016)
Faba Bean [150] 0.83 0.8-0.9 42.1 40.4-43.7 Ashraf et al (2016)
Lentils [530] 1.5 0.6-2.4 49.3 44.9-53.7 Wamatu et al (2016)
Mean and ranges in haulm nitrogen (N) content and in
vitro digestibility (IVOMD) in some key grain legumes](https://image.slidesharecdn.com/kn09-michaelblummel-160418083156/85/Opportunities-and-limitations-of-multidimensional-crop-improvement-in-grain-legumes-to-support-increased-productivity-in-mixed-crop-livestock-systems-10-320.jpg)
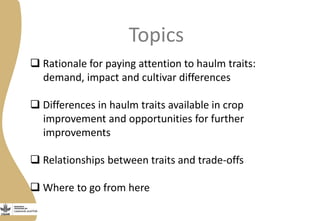
![Crop PY HY N IVOMD
1Cowpea [50 x 2 years x 5 locations] 0.50 0.29 0.67 0.61
2Groundnut [200 x 2 years x 2 H2O] 0.72 0.75 0.81 0.49
Broad sense heritabilities (h2) for pod (PY) and haulm yield
(HY) and key haulm fodder quality traits nitrogen
(N) and in vitro digestibility (IVOMD)
1Samireddipally et al (2016), Boukar et al (2016)
2Blümmel et al (2012)](https://image.slidesharecdn.com/kn09-michaelblummel-160418083156/85/Opportunities-and-limitations-of-multidimensional-crop-improvement-in-grain-legumes-to-support-increased-productivity-in-mixed-crop-livestock-systems-11-320.jpg)
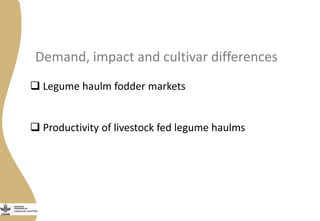
![T w e n ty h ig h e s t n itro g e n c o n te n ts
2 .3 2 .4 2 .5 2 .6 2 .7 2 .8 2 .9 3 .0 3 .1
0
5 0 0
1 0 0 0
1 5 0 0
2 0 0 0
2 5 0 0
C o n tro l: P = 0 .5
S tre s s : r= -0 .4 5 ; P = 0 .0 4
R e la tio n s h ip s b e tw e e n h a u lm n itro g e n c o n te n ts a n d p o d
y ie ld in c u ltiv a rs ra n k e d fo r h a u lm n itro g e n
N itro g e n c o n ten t o f h a u lm s (% )
Podyield(kg/ha)
T w e n ty h ig h e s t p o d y ie ld e rs
1 .7 1 .8 1 .9 2 .0 2 .1 2 .2 2 .3 2 .4 2 .5 2 .6 2 .7 2 .8
0
5 0 0
1 0 0 0
1 5 0 0
2 0 0 0
2 5 0 0
3 0 0 0
3 5 0 0
4 0 0 0
c o n tro l: P = 0 .2 5
s tre s s : P = 0 .1 6
N itro g en co n te n t o f h a u lm (% )
Podyield(kg/ha)
R e la tio n s h ip s b e tw e e n h a u lm n itro g e n c o n te n ts a n d p o d
y ie ld in c u ltiv a rs ra n k e d fo r p o d y ie ld
Primary of trait: Groundnut pod yield versus haulm nitrogen yield
Groundnut Set [200 x 2 years x 2 H2O]
Blümmel et al (2012)](https://image.slidesharecdn.com/kn09-michaelblummel-160418083156/85/Opportunities-and-limitations-of-multidimensional-crop-improvement-in-grain-legumes-to-support-increased-productivity-in-mixed-crop-livestock-systems-12-320.jpg)
![T w e n ty h ig h e s t in v itro digestibilities
6 1 6 2 6 3 6 4 6 5 6 6
0
5 0 0
1 0 0 0
1 5 0 0
2 0 0 0
2 5 0 0
3 0 0 0
c o n tro l: P = 0 .6 3
s tre s s : P = 0 .5 9
R e la tio n s h ip s b e tw e e n h a u lm in vitro d ig e s tib ility a n d p o d
y ie ld in c u ltiv a rs ra n k e d fo r in vitro d ig e s tib ility
In v itro digestibility of haulm s (% )
Podyield(kg/ha)
T w e n ty h ig h e s t p o d y ie ld e rs
5 7 5 8 5 9 6 0 6 1 6 2 6 3 6 4 6 5
0
5 0 0
1 0 0 0
1 5 0 0
2 0 0 0
2 5 0 0
3 0 0 0
3 5 0 0
4 0 0 0
s tre s s : P = 0 .7 6
c o n tro l: P = 0 .5 0
R e la tio n s h ip s b e tw e e n h a u lm in vitro d ig e s tib ility a n d p o d
y ie ld in c u ltiv a rs ra n k e d fo r p o d y ie ld
In v itro d ig e s tib ility o f h a u lm s (% )
Podyield(kg/ha)
Primary of trait: Groundnut pod yield versus haulm in vitro
digestibility yield
Groundnut Set [200 x 2 years x 2 H2O]
Blümmel et al (2012)](https://image.slidesharecdn.com/kn09-michaelblummel-160418083156/85/Opportunities-and-limitations-of-multidimensional-crop-improvement-in-grain-legumes-to-support-increased-productivity-in-mixed-crop-livestock-systems-13-320.jpg)
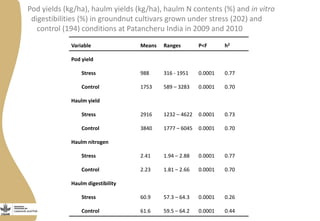
![Crop N vs PY IVOMD vs PY N vs HY IVOMD vs HY
Cowpea [50x2x5] -0.26 0.11 0.21 0.44**
Groundnut [800] 0.26*** 0.05 0.26*** 0.23***
Groundnut [200] -0.23*** -0.20*** 0.53*** 0.48***
Chickpea [475] -0.06 0.06 -0.02 0.11*
Faba Bean [150] -0.16* 0.16* -0.05 0.12
Lentils [530] -0.73*** -0.12** -0.25*** 0.19***
Correlations between haulm nitrogen (N) and in vitro
digestibilities and pod (PY) and haulm yield (HY)](https://image.slidesharecdn.com/kn09-michaelblummel-160418083156/85/Opportunities-and-limitations-of-multidimensional-crop-improvement-in-grain-legumes-to-support-increased-productivity-in-mixed-crop-livestock-systems-17-320.jpg)


The document discusses the opportunities and limitations of multidimensional crop improvement in grain legumes to enhance productivity in mixed crop-livestock systems. It emphasizes the significance of haulm traits, their variations, and the relationships between these traits and livestock productivity. Additionally, it suggests future directions for crop improvement practices to include haulm traits in cultivar release criteria based on farmer demand and valuation.


