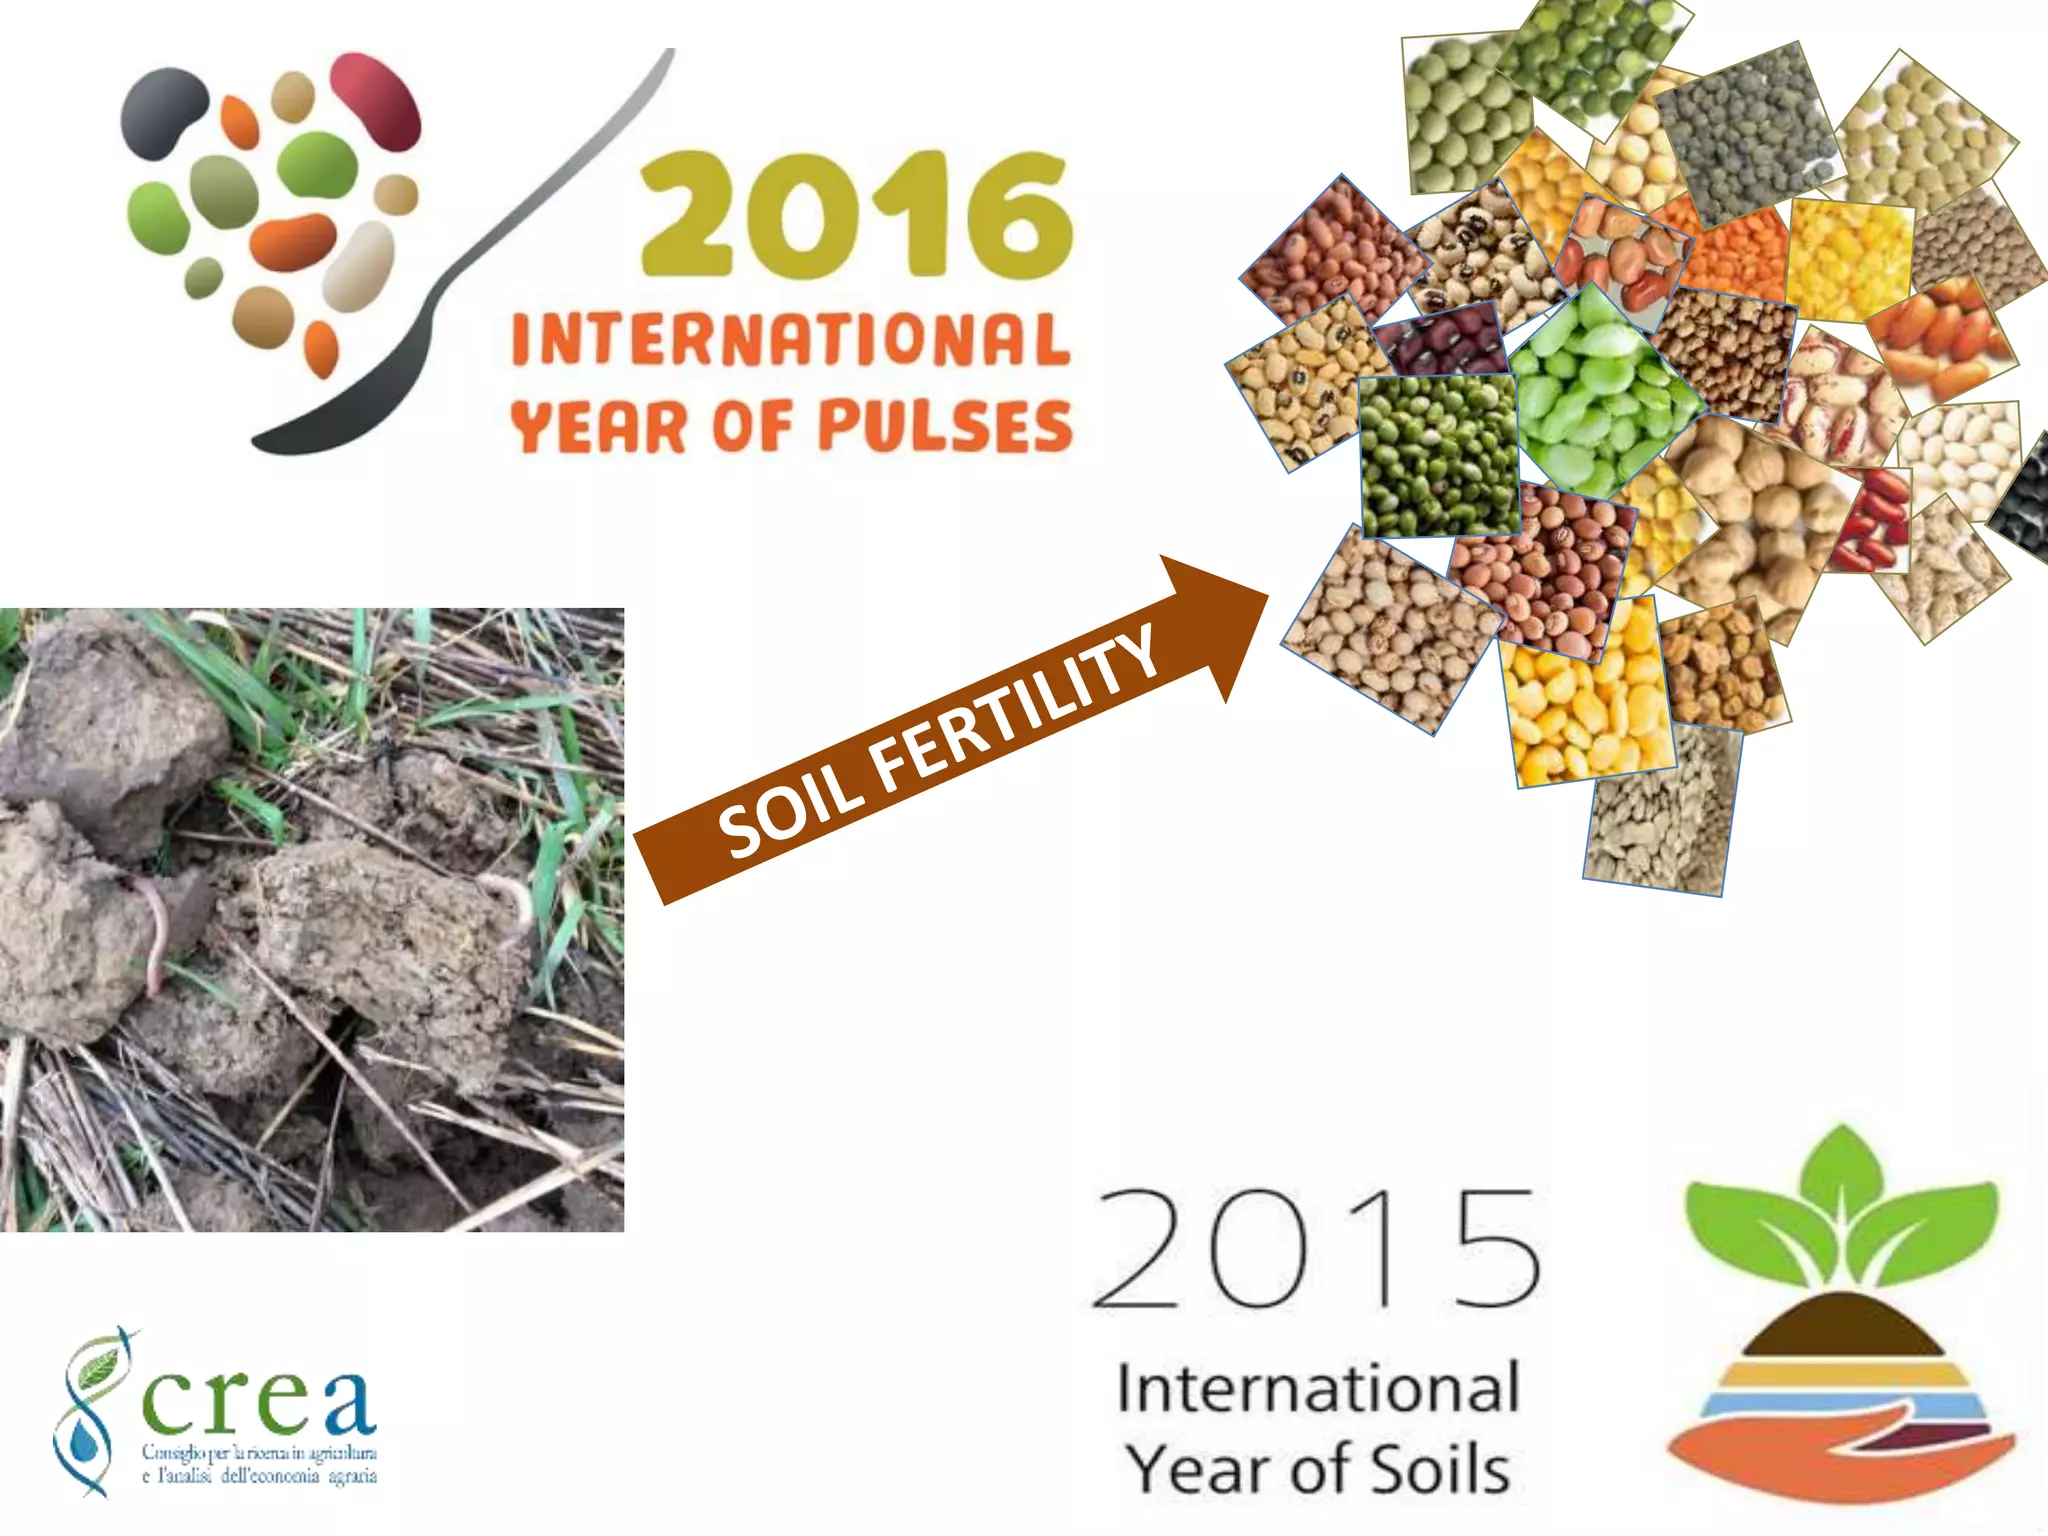
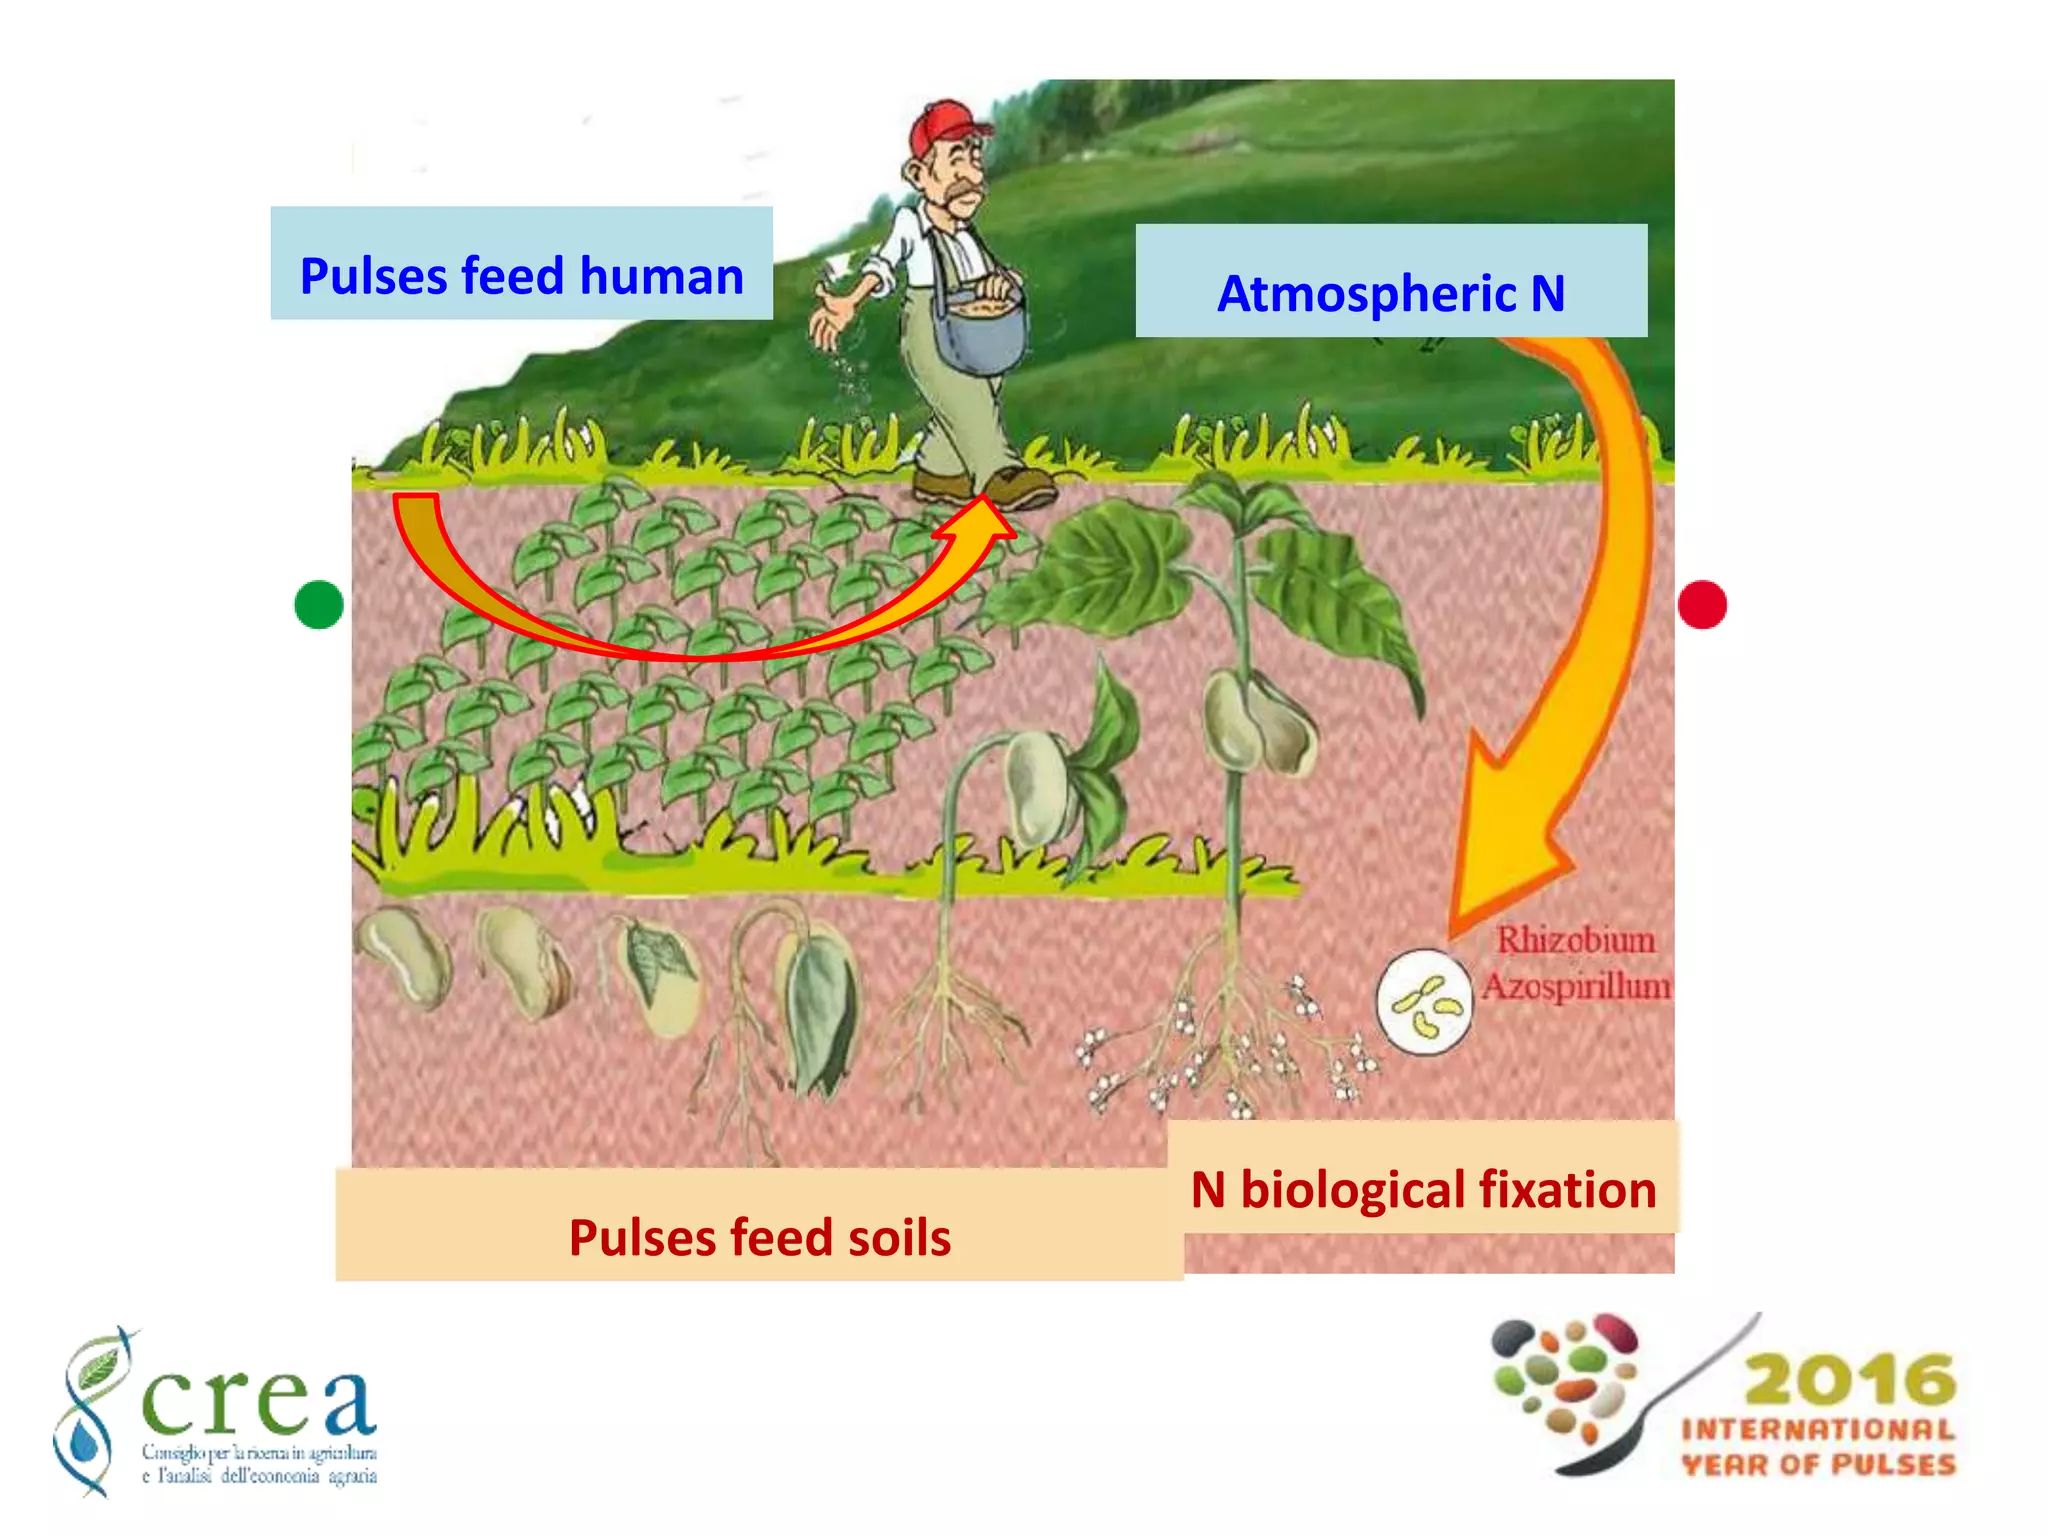
1
Michele Pisante
Deputy Commissioner, Council for Agricultural Research and Economics, Roma
Chair, Agronomy and crop sciences research and education center
University of Teramo, Italy
PULSE CROPS FOR SUSTAINABLE PRODUCTION INTENSIFICATION
N biological fixation
Atmospheric NPulses feed human
Pulses feed soils
PULSE CROPS
FOR
SUSTAINABLE PRODUCTION INTENSIFICATION
Relationship between the C cost of
seed production for selected legume
and non-legume crops. In order to
compare crop production
performance, various isoproduction
curves expressing the product of the
energy cost of 1 g of seed by the
yield have been indicated
Munier-Jolain and Salon, (2005); Jensen et al. (2012)
1962 1972 1982 1992 2002 2012
Cool-season legumes
Chickpea 12.2 10.5 10.3 9.3 10.4 12.1
Pea 10.3 8.0 7.4 7.2 6.0 6.3
Faba bean 6.1 4.2 3.3 2.9 2.7 2.4
Lentil 1.6 1.8 2.6 3.3 3.6 4.2
Vetches 2.4 1.7 1.0 1.0 0.9 0.6
Lupins 1.4 0.8 0.6 1.2 1.2 0.9
Warm-season legumes
Common bean 23.5 22.8 26.2 24.8 27.5 28.8
Cowpea 2.7 4.2 3.9 8.5 9.9 10.7
Pigeonpea 2.7 2.7 3.4 4.2 4.4 5.3
Major cereals, for comparison
Wheat 207.6 213.8 238.5 222.5 213.8 216.7
Rice 119.5 132.2 141.6 147.4 147.6 163.5
Maize 103.5 114.9 124.4 136.8 137.6 177.0
Trend for word acreage (Million hectares)
Rubiales and Mikic (2015) - Source: FAOSTAT, 2013
Plant breeding progress on the Pea
Plant architecture
(semi-dwarf habit;
leaflessness)
Improved standing ability
Improved winter survival
under autumn sowing
Cultivars Years of release Relative yield,
t ha-1
Spacial - Fraser 2011 - 2012 1.6
Spirale - Isard 2003 - 2005 1.2
Sydney - Cheyenne 1998 - 1999 1.0
Average grain yield increase of varieties bred in different years
across sites of north, centre and southern Italy (Annichiarico et al.,
unpublished data)
Mean grain, crude protein and energy (Milk Feed Units) yield
of 4 grain legumes across Italian subcontinental-and
Mediterranean-climate sites a
a As represented by the locally top-yielding cultivar out of 49 pea, 24 faba bean, 11 white lupin and 16
narrow-leafed lupin varieties (Annichiarico, 2008).
Species Yield
(t ha-1)
Protein
(%)
Crude protein
(t ha-1)
Milk Feed
(UNITS ha-1)
Pea 4.4 22.8 1.0 5080
Faba bean 3.4 29.4 1.0 3806
White lupin 3.5 38.8 1.4 4339
Narrow-leafed
lupin
3.1 30.6 0.9 3807
Alkaloids Aster Lublanc Luxor Lutteur Multitalia Rosetta
lupanine 60.8 11218.6 30.4 863.2 1377.9 361.8
13-α-tigloyloxylupanine 37.4 102.0 6.7 44.4 11.8 6.4
albine 30.2 1012.4 11.5 162.0 136.8 29.3
13-OH-lupanine 17.4 491.7 3.1 157.4 12.4 4.7
tetrahydrhorombifoline 12.8 24.1 1.0 8.8 2.9 1.1
ammodendrine 12.1 70.5 2.5 20.9 8.9 3.4
angustifoline 12.1 268.4 3.6 65.0 20.7 6.4
isolupanina 10.1 59.7 2.4 15.9 7.8 3.3
3-β-tigloyloxylupanine 6.2 16.6 2.4 7.5 1.5 1.5
11,12-dehydrolupanine - 23.7 - - - -
11,12-dehydrosparteine - 28.8 - - - -
17-oxolupanine - 25.2 - - - -
isosparteine - 14.5 - - - -
N-formylalbine - 13.0 - - - -
N-formylangustifoline - 18.5 - - - -
SharedUnshared
L.albusgroup
Values expressed as mg/Kg
Aster Lublanc Lutteur Multitalia
(3- 6 year crop rotations in 5 case studies across Europe)
21 - 88 kg ha-1 of N fertilizers could be saved on average in grain legume
rotations compared to rotations without legumes
Preissel et al. (2015)
Farm-economically relevant pre-crop effects
that increase GMs of subsequent crops
Process Protein crop Farm Agri-food system Global
Biological
nitrogen
fixation (BNF)
No N fertiliser required
Reduced N2O emissions
Below ground biodiversity
changes
Reduced N fertilizer
requirement
Reduced fossil energy
(natural gas) use
Reduced CO2 emissions
from industry
Reduced global GHG emissions
Grain protein
synthesis
Lower crop yield (compared
with cereals) due to resource
demands of protein synthesis
Increased on-farm supply of
protein
Increased diversity of
‘protein’ crop
commodity supplies
Reduced demand for globally
traded soya
Reduced direct land-use change
pressures
N
transformation
in soil
Reduced N2O emissions
Effect in both direction on
nitrate leaching
Reduced global GHG emissions
Soil
development
Improved water infiltration,
reduced cultivation energy,
increased crop yields
Phosphorous
transformations
Increased mobilisation of soil
P
Reduced optimum levels of
plant-available P
Reduced mining of phosphate
rock (minor effect)
Soil carbon
transformations
Positive soil carbon balance
Increased soil organic
matter, higher and more
stable crop yields
Increased soil carbon
sequestration (minor effect)
Weed, pest and
disease
development
Increased cropping system
yield.
Reduced emissions of
pesticides to water
Species
interactions
Increased pollen and nectar
provision. Increased soil fauna
diversity
Larger population of insects
supporting wider wildlife
Resource and Environmental effects of legumes arising from
key agroecological processes operating at four levels of scale
Reckling et al. (2014)
11
Thank You.
www.crea.gov.it
http://goo.gl/el6MnK

PULSE CROPS FOR SUSTAINABLE PRODUCTION INTENSIFICATION

  • 1.
    1 Michele Pisante Deputy Commissioner,Council for Agricultural Research and Economics, Roma Chair, Agronomy and crop sciences research and education center University of Teramo, Italy PULSE CROPS FOR SUSTAINABLE PRODUCTION INTENSIFICATION
  • 3.
    N biological fixation AtmosphericNPulses feed human Pulses feed soils
  • 4.
    PULSE CROPS FOR SUSTAINABLE PRODUCTIONINTENSIFICATION Relationship between the C cost of seed production for selected legume and non-legume crops. In order to compare crop production performance, various isoproduction curves expressing the product of the energy cost of 1 g of seed by the yield have been indicated Munier-Jolain and Salon, (2005); Jensen et al. (2012)
  • 5.
    1962 1972 19821992 2002 2012 Cool-season legumes Chickpea 12.2 10.5 10.3 9.3 10.4 12.1 Pea 10.3 8.0 7.4 7.2 6.0 6.3 Faba bean 6.1 4.2 3.3 2.9 2.7 2.4 Lentil 1.6 1.8 2.6 3.3 3.6 4.2 Vetches 2.4 1.7 1.0 1.0 0.9 0.6 Lupins 1.4 0.8 0.6 1.2 1.2 0.9 Warm-season legumes Common bean 23.5 22.8 26.2 24.8 27.5 28.8 Cowpea 2.7 4.2 3.9 8.5 9.9 10.7 Pigeonpea 2.7 2.7 3.4 4.2 4.4 5.3 Major cereals, for comparison Wheat 207.6 213.8 238.5 222.5 213.8 216.7 Rice 119.5 132.2 141.6 147.4 147.6 163.5 Maize 103.5 114.9 124.4 136.8 137.6 177.0 Trend for word acreage (Million hectares) Rubiales and Mikic (2015) - Source: FAOSTAT, 2013
  • 6.
    Plant breeding progresson the Pea Plant architecture (semi-dwarf habit; leaflessness) Improved standing ability Improved winter survival under autumn sowing Cultivars Years of release Relative yield, t ha-1 Spacial - Fraser 2011 - 2012 1.6 Spirale - Isard 2003 - 2005 1.2 Sydney - Cheyenne 1998 - 1999 1.0 Average grain yield increase of varieties bred in different years across sites of north, centre and southern Italy (Annichiarico et al., unpublished data)
  • 7.
    Mean grain, crudeprotein and energy (Milk Feed Units) yield of 4 grain legumes across Italian subcontinental-and Mediterranean-climate sites a a As represented by the locally top-yielding cultivar out of 49 pea, 24 faba bean, 11 white lupin and 16 narrow-leafed lupin varieties (Annichiarico, 2008). Species Yield (t ha-1) Protein (%) Crude protein (t ha-1) Milk Feed (UNITS ha-1) Pea 4.4 22.8 1.0 5080 Faba bean 3.4 29.4 1.0 3806 White lupin 3.5 38.8 1.4 4339 Narrow-leafed lupin 3.1 30.6 0.9 3807
  • 8.
    Alkaloids Aster LublancLuxor Lutteur Multitalia Rosetta lupanine 60.8 11218.6 30.4 863.2 1377.9 361.8 13-α-tigloyloxylupanine 37.4 102.0 6.7 44.4 11.8 6.4 albine 30.2 1012.4 11.5 162.0 136.8 29.3 13-OH-lupanine 17.4 491.7 3.1 157.4 12.4 4.7 tetrahydrhorombifoline 12.8 24.1 1.0 8.8 2.9 1.1 ammodendrine 12.1 70.5 2.5 20.9 8.9 3.4 angustifoline 12.1 268.4 3.6 65.0 20.7 6.4 isolupanina 10.1 59.7 2.4 15.9 7.8 3.3 3-β-tigloyloxylupanine 6.2 16.6 2.4 7.5 1.5 1.5 11,12-dehydrolupanine - 23.7 - - - - 11,12-dehydrosparteine - 28.8 - - - - 17-oxolupanine - 25.2 - - - - isosparteine - 14.5 - - - - N-formylalbine - 13.0 - - - - N-formylangustifoline - 18.5 - - - - SharedUnshared L.albusgroup Values expressed as mg/Kg Aster Lublanc Lutteur Multitalia
  • 9.
    (3- 6 yearcrop rotations in 5 case studies across Europe) 21 - 88 kg ha-1 of N fertilizers could be saved on average in grain legume rotations compared to rotations without legumes Preissel et al. (2015) Farm-economically relevant pre-crop effects that increase GMs of subsequent crops
  • 10.
    Process Protein cropFarm Agri-food system Global Biological nitrogen fixation (BNF) No N fertiliser required Reduced N2O emissions Below ground biodiversity changes Reduced N fertilizer requirement Reduced fossil energy (natural gas) use Reduced CO2 emissions from industry Reduced global GHG emissions Grain protein synthesis Lower crop yield (compared with cereals) due to resource demands of protein synthesis Increased on-farm supply of protein Increased diversity of ‘protein’ crop commodity supplies Reduced demand for globally traded soya Reduced direct land-use change pressures N transformation in soil Reduced N2O emissions Effect in both direction on nitrate leaching Reduced global GHG emissions Soil development Improved water infiltration, reduced cultivation energy, increased crop yields Phosphorous transformations Increased mobilisation of soil P Reduced optimum levels of plant-available P Reduced mining of phosphate rock (minor effect) Soil carbon transformations Positive soil carbon balance Increased soil organic matter, higher and more stable crop yields Increased soil carbon sequestration (minor effect) Weed, pest and disease development Increased cropping system yield. Reduced emissions of pesticides to water Species interactions Increased pollen and nectar provision. Increased soil fauna diversity Larger population of insects supporting wider wildlife Resource and Environmental effects of legumes arising from key agroecological processes operating at four levels of scale Reckling et al. (2014)
  • 11.
  • 12.