Download to read offline
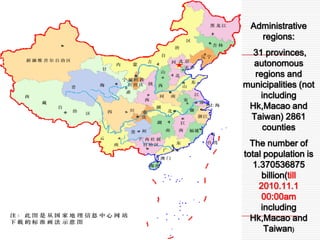
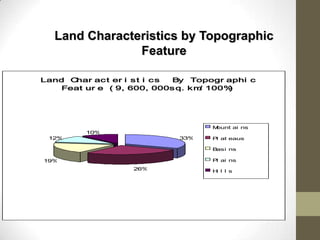
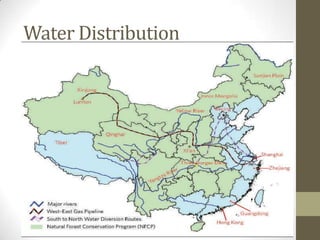
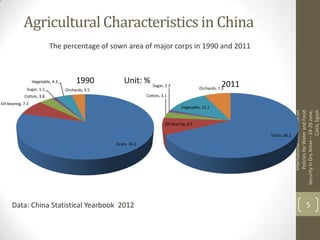


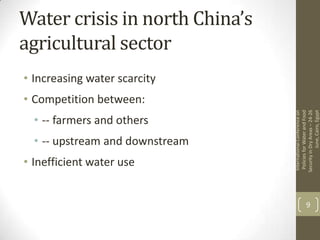
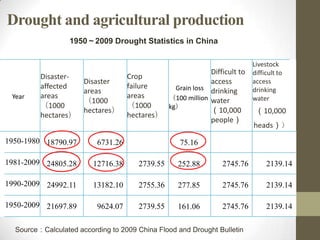
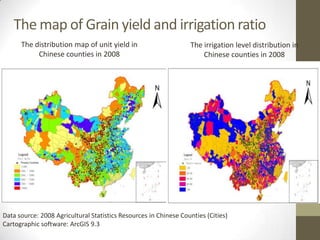
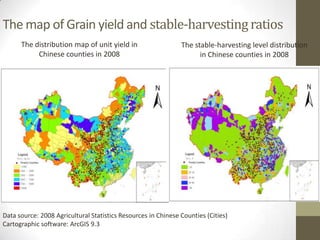
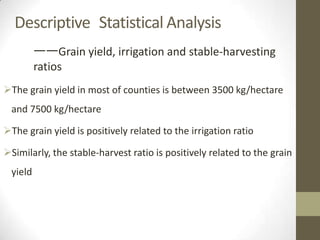
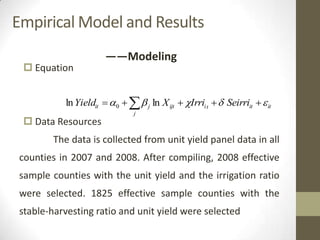
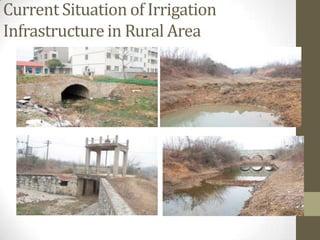
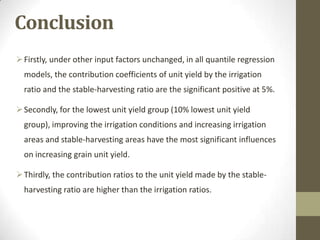


This document summarizes grain production characteristics and challenges related to climate change in China. It notes that China has diverse topography including mountains, plateaus, basins and plains. Historically, the majority of agricultural land was used for grain but that percentage has decreased in recent decades. North China faces increasing water scarcity and competition over water resources between different sectors. Drought has negatively impacted agricultural areas and production over the past decades. The document presents statistical analysis showing that grain yields are positively correlated with higher irrigation and stable harvesting ratios. Improving irrigation infrastructure and increasing stable harvesting areas can significantly increase yields, especially for regions with currently lower yields.


![5G Explained! A High Level Overview [Introduction]](https://cdn.slidesharecdn.com/ss_thumbnails/5gexplainedahighleveloverview-260119165306-cc137a3e-thumbnail.jpg?width=640&height=640&fit=bounds)


