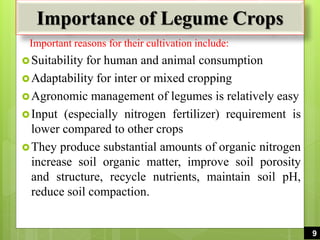
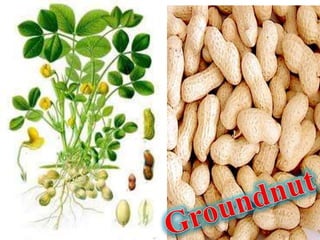
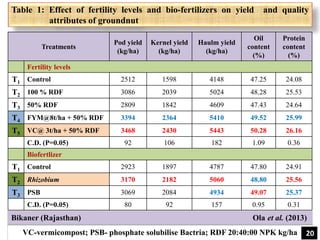
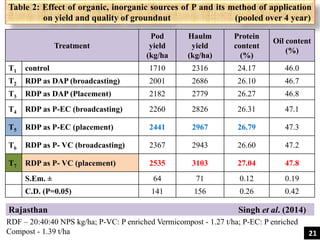
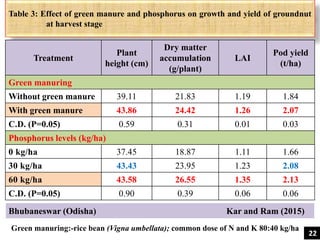
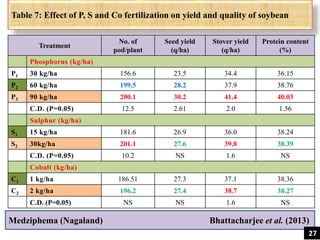
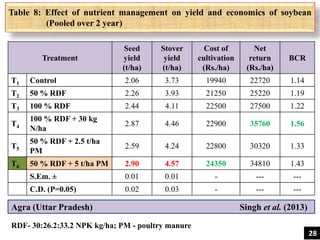
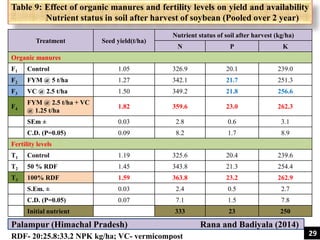
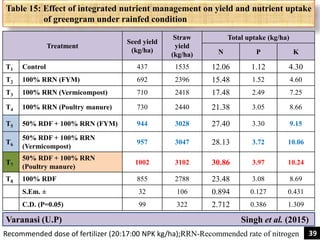
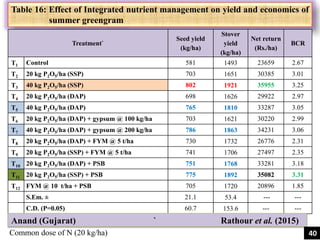
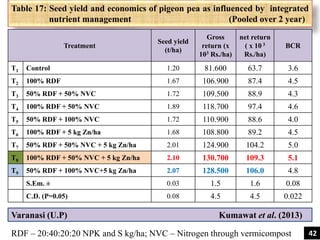
This document provides a summary of a seminar presentation on nutrient management in legume crops. It discusses the importance of legumes as a source of protein and their production globally and in India. It then summarizes the speaker's presentation which covered topics like essential plant nutrients, nutrient deficiency in legumes, principles of nutrient management, biological nitrogen fixation, integrated nutrient management, and the effects of fertilizer and organic amendments on the yield and quality of groundnuts. Tables of data from studies on groundnut are also summarized.
2. Seminar Presentation
on
Major Advisor
Dr. V. M. Patel
Assistant Research Scientist
Pulses and Castor Research Station
N. A.U., Navsari
Co-Guide
Dr. Sonal Tripathi
Associate Professor
Dept. of Soil Sci. and Agril. Chemistry
N. M. College of Agriculture
N. A.U., Navsari
Speaker
Mr. Joshi Jigarkumar R.
III Sem., M. Sc. (Agri.)
Reg. No:- 2010114038
Dept. of Agronomy
N. M. College of Agriculture
NAU, Navsari
NUTRIENT MANAGEMENT IN
LEGUME CROPS
2
3. Introduction
Legumes are members of the Fabaceae or bean family,
include several important food crops such as peas, beans,
soybeans, cowpea, chickpea, greengram, blackgram, lentil,
peanuts etc.
The global legume production, area and productivity during
2014 was 395 million tonnes, 218 million ha and 1811 kg/ha
respectively.
India is the forth largest producer of legumes next to
USA, Brazil and Argentina accounting about 10 present
of total production in the world
India is producing about 40 million tonnes of legumes
from an area of 42 million hectare with average
productivity 955 kg/ha (Anonymous 2014).
3
4. Nutritionally, legume seeds are two to three times richer
in protein than cereal grains. Some legumes, such as
soybeans and groundnut are also the rich source of oil.
The inadequate supply of protein is the major problem not
only in India but in all the developing countries of world
The legumes are cheap and easily available sources of
protein which compare very well in the nutritive values
with other sources of proteins.
Legumes occupy an extensive area in India but the yields
are low compared to other countries.
For increasing the production, productivity & protein
content of legumes, an efficient and effective nutrient
management is required.
4
5. Global top five legume Producing
Countries - 2014
USA
25%
Brazil
23%
Argentina
14%
India
10%
China
8%
Other
20%
Source : Ministry of Agriculture, Govt. of India.
5
6. Sr. No. Year
Area
(Million Hectares)
Production
(Million tonnes)
Yield
(Kg/ha)
1 2005-06 36.84 29.65 804
2 2006-07 37.14 27.91 751
3 2007-08 38.8 35.53 915
4 2008-09 37.76 31.65 838
5 2009-10 38.49 30.05 780
6 2010-11 41.86 39.24 937
7 2011-12 39.83 36.26 910
8 2012-13 39.3 37.71 959
9 2013-14 42.75 40.84 955
Source : Ministry of Agriculture, Government of India
Area, Production and productivity of Total legume in India
(2005-06 to 2013-14)
6
7. Name Area
(m ha)
Production
(m tonne)
Yield
(kg/ha)Common Scientific
Soybean Glycine max 11.7164 11.8608 1012
Groundnut Arachis hypogaea 5.5052 9.71390 1764
Chickpea Cicer arietinum 9.9274 9.5263 960
Pigeon pea Cajunus cajan 3.9049 3.1744 813
Urad Vigna mungo 4.018 1.700 423
Mung bean Vigna radiate 3.156 1.610 510
Lentil Lens culinaris 1.450 1.160 800
Moth bean Vigna aconitifolia 1.483 0.409 266
Other legume 3.624 2.561 706
Total/average 42.751 40.843 955
Source: Ministry of Agriculture, Government of India database (2013-2014)
Status of major grain legumes of India
(2013-14)
7
8. Area, production and productivity of major legume in Gujarat
(2013-14)
Sr.
No.
States
Area
(m ha)
Production
(m tonne)
Productivity
(kg/ha)
1 Groundnut 1.843 4.9176 2668
2 Chickpea 0.247 0.309 1251
3 Pigeon pea 0.210 0.209 995
4 Green Gram 0.183 0.103 564
5 Black gram 0.091 0.060 655
6 Soybean 0.060 0.044 733
7 Other legume 0.030 0.018 595
Total Gujarat 2.664 5.6606 2124
Source : Ministry of Agriculture, Govt. of India. 8
9. Importance of Legume Crops
Important reasons for their cultivation include:
Suitability for human and animal consumption
Adaptability for inter or mixed cropping
Agronomic management of legumes is relatively easy
Input (especially nitrogen fertilizer) requirement is
lower compared to other crops
They produce substantial amounts of organic nitrogen
increase soil organic matter, improve soil porosity
and structure, recycle nutrients, maintain soil pH,
reduce soil compaction.
9
10. It is a system used to manage the amount, form,
placement and timing of the application of nutrients
(whether as manure, commercial fertilizer or other
form of nutrients) to plants.
Nutrient management
10
11. Essential plant nutrients
Element
Forms absorbed by
plants
Concentration in
plant dry matter
C Co2 40-45 %
H H2O 6 %
O O2, H2O 40-45 %
N NH4
+ & NO3
- 4.0 %
P H2PO4
- & HPO4
-2 0.5 %
K K+ 4.0 %
Mg Mg+2 0.5 %
S SO4
-2 0.5 %
Ca Ca+2 1.0 %
Fe Fe+2 & Fe+3 200 ppm
Mn Mn+2 200 ppm
Zn Zn+2 30 Ppm
B H3BO3 & H2BO3
- 60 ppm
Cu Cu+2 10 ppm
Mo MoO4
-2 2 ppm
Cl Cl- 3000 ppm
Ni Ni+ ---- 11
13. Decreasing total cultivated area and increase population.
To improve productivity.
To maintain the growth and vigor of the plant.
To increase the fertilizer use efficiency.
To obtain higher yield and higher return.
To reduce the cost of production.
Improve the quality of produce.
To earn the foreign exchange.
13
14. Four R principles of nutrient
management
1. Right Source: Ensure a balanced supply of essential
nutrients.
2. Right Rate: Assess and make decisions based on soil
nutrient supply and plant demand.
3.Right Time: Assess and make decisions based on the
dynamics of crop uptake, soil supply, nutrient loss risks.
4. Right place: manage spatial variability within the field
to meet site-specific crop needs and limit potential losses
from the field.
14
16. Bio-fertilizer application in legumes
Seed treatment:
Clean seed on a cemented floor or gunny
bag
Prepare culture by bio-fertilizer and water
(1:2)
Sprinkled culture on the heap of the seed
and mix by hand so thin coated
Spread the seed under shade sometime for
drying.
Sow immediately
Soil application
10-15 packets (200 gm.) are mixed with40-
60 kg of organic fertilizer or soil for one
acre land.
Mixture sprinkled with water or
broadcasted into the soil at sowing time or
standing crop.
16
17. Integrated nutrient management
0
5000
10000
15000
20000
25000
30000
N P K Total
Thousandtonnes
year
Source : Ministry of Agriculture, Govt. of India.
Consumption of fertilisers in terms of Nutrients (N, P and K) in India (1950-1951 to
2013-2014)
INM involves the integrated use of mineral fertilizer through with organic
manures/ industrial agricultural waste and bio-fertilizer in suitable combination each
other to optimize input use and maximize production
17
21. Table 2: Effect of organic, inorganic sources of P and its method of application
on yield and quality of groundnut (pooled over 4 year)
Treatment
Pod
yield
(kg/ha
Haulm
yield
(kg/ha)
Protein
content
(%)
Oil content
(%)
T1 control 1710 2316 24.17 46.0
T2 RDP as DAP (broadcasting) 2001 2686 26.10 46.7
T3 RDP as DAP (Placement) 2182 2779 26.27 46.8
T4 RDP as P-EC (broadcasting) 2260 2826 26.31 47.1
T5 RDP as P-EC (placement) 2441 2967 26.79 47.3
T6 RDP as P- VC (broadcasting) 2367 2943 26.60 47.2
T7 RDP as P- VC (placement) 2535 3103 27.04 47.8
S.Em. ± 64 71 0.12 0.19
C.D. (P=0.05) 141 156 0.26 0.42
Rajasthan Singh et al. (2014)
RDF – 20:40:40 NPS kg/ha; P-VC: P enriched Vermicompost - 1.27 t/ha; P-EC: P enriched
Compost - 1.39 t/ha 21
22. Table 3: Effect of green manure and phosphorus on growth and yield of groundnut
at harvest stage
Treatment
Plant
height (cm)
Dry matter
accumulation
(g/plant)
LAI
Pod yield
(t/ha)
Green manuring
Without green manure 39.11 21.83 1.19 1.84
With green manure 43.86 24.42 1.26 2.07
C.D. (P=0.05) 0.59 0.31 0.01 0.03
Phosphorus levels (kg/ha)
0 kg/ha 37.45 18.87 1.11 1.66
30 kg/ha 43.43 23.95 1.23 2.08
60 kg/ha 43.58 26.55 1.35 2.13
C.D. (P=0.05) 0.90 0.39 0.06 0.06
Green manuring:-rice bean (Vigna umbellata); common dose of N and K 80:40 kg/ha
Bhubaneswar (Odisha) Kar and Ram (2015)
22
23. Table 4: Yield and economics as influenced by different nutrient management
practices in summer groundnut (pooled over 2 year)
Treatment
Pod yield
(kg/ha)
Gross
returns
(Rs./ha)
Net
returns
(Rs./ha)
BCR
ratio
T1 100% RDF 1966 98300 78100 4.59
T2 100% RDF + FYM 7.5 t/ha 2169 108450 88550 5.45
T3 75% RDF + 25% RDF TD at 30 DAS 1738 86900 68500 4.72
T4 75% RDF + 25% RDF TD at 30 DAS + FYM 7.5 t/ha 1909 95450 69910 3.74
T5 150% RDF 1822 91100 72538 4.91
T6 150% RDF + FYM 7.5 t/ha 1801 90050 63388 3.38
T7 100% RDF + 50% RDF TD at 30 DAS 1802 90100 69738 4.42
T8
100% RDF + 50% RDF TD at 30 DAS + FYM 7.5
t/ha
2006 100300 78798 4.66
T9 75% RDF + 75% RDF TD at 30 DAS 1721 86050 67248 4.58
T10 75% RDF + 75% RDF TD at 30 DAS + FYM 7.5 t/ha 1602 80100 53198 2.98
S.Em. ± 40 --- --- ---
C. D. (P=0.05) 114 --- --- ---
Vyara (Gujarat) Madhubala and Kedarnath (2015)
RDF- 25:50:00 N:P:K kg/ha; TD- top dressing; DAS- days after sowing 23
24. Table 5: Effect of organic manures on yield, economics and available N in soil
after harvest of summer groundnut
Treatment
Pod yield
(kg/ha)
Haulm
yield
(kg/ha)
Cost of
cultivation
(Rs./ha)
Net
return
(Rs./ha)
BCR
Available
N (kg/ha)
T1 Control 1917 2885 30549 59114 2.94 240.00
T2 FYM 5 t/ha 2626 4475 38049 87130 3.29 261.67
T3 BC 3 t/ha 2374 3884 39549 72889 2.84 257.00
T4 NADEP compost 3 t/ha 2020 3637 38049 59115 2.55 242.00
T5 VC 1.5 t/ha 2446 3907 38049 77371 3.03 258.33
T6 FYM 2.5 t/ha + NC 0.3 t/ha 2147 3659 36999 65347 2.77 250.00
T7 BC 1.5 t/ha + NC 0.3 t/ha 2162 3803 37749 65843 2.74 252.00
T8
NADEP compost 1.5 t/ha +
NC 0.3 t/ha
2008 3709
36999 60011 2.62
241.33
T9 VC 0.75 t/ha + NC 0.3 t/ha 2125 3757 36999 64906 2.75 244.00
T10
BC 1.25 t/ha + VC 165 kg/ha
+ CC 75 kg/ha
2197 3830
35724 69389 2.94
259.00
S.Em. ± 96 246.8 --- --- --- 5.08
C.D. (P=0.05) 284 733.3 --- --- --- 15.10
Initial value 241.0
Navsari (Gujarat) Kanara (2015)
BC: Biocompost; VC: vermicompost; NC: Neem cake; CC: castor cake 24
34. Table 12: Effect of sulphur and phosphorus management on yield, quality
and post harvest soil nutrient status of soil
Treatment
Seed yield
(kg/ha)
Protein
content (%)
Post harvest soil nutrients
status (kg/ha)
N P2O5 S
Sulphur levels (S)
S1 0 kg S/ha 720 17.27 223.85 45.10 20.68
S2 20 kg S/ha 807 18.14 231.26 47.76 22.75
S3 40 kg S/ha 783 21.60 233.77 47.71 25.31
S.Em. ± 10.75 0.56 0.43 0.50 0.399
C.D. (P=0.05) 30.94 1.62 1.24 1.45 1.15
Phosphorus management (P)
P1 Control 614 15.50 225.98 42.76 19.65
P2 PSB alone 714 16.91 228.51 45.71 21.84
P3 25 kg P2O5 /ha 855 20.38 230.50 47.93 24.06
P4 25 kg P2O5 /ha + PSB 899 22.50 233.97 51.02 26.10
S.Em. ± 12.41 0.65 0.45 0.58 0.461
C.D. (P=0.05) 35.72 1.87 1.44 1.67 1.33
Anand (Gujarat) Patel et al. (2014)
34
35.
36. Table 13(A): Effect of land configuration, fertilizer rates and farm yard manure application
on growth, yield and quality of green gram Pooled over two year)
Treatment
Plant
height
(cm)
No. of
nodules/pla
nt
No. of
pods/plant
Seed yield
(t/ha)
Stover yield
(t/ha)
Protein
content (%)
Land configuration
Flat bed 41.6 16.2 22.8 0.83 2.12 19.6
Raised bed 44.2 17.2 25.6 0.93 2.27 29.5
S.Em. ± 0.7 0.3 0.4 0.01 0.04 0.3
C.D. (P=0.05) 2.0 0.8 1.0 0.04 0.11 NS
Inorganic fertilizers
75% RDF 41.9 16.2 22.9 0.83 2.13 19.7
100% RDF 44.0 17.2 25.5 0.93 2.27 20.2
S.Em. ± 0.7 0.3 0.4 0.01 0.04 0.3
C.D. (P=0.05) 2.0 0.8 1.1 0.04 0.11 NS
FYM (t/ha)
0 @ t/ha 41.1 16.1 22.9 0.83 2.08 19.3
5 @ t/ha 44.7 17.3 25.4 0.93 2.31 20.2
S.Em. ± 0.7 0.3 0.4 0.01 0.04 0.3
C.D. (P=0.05) 2.0 0.8 1.1 0.04 0.11 0.8
Navsari (Gujarat) Jat et al. (2012)
Recommended dose of fertilizer (20:40:00 NPK kg/ha) 36
37. Table 13(B): Effects of fertilizer rates and farm yard manure application on available
NPK in soil after harvest of green gram (Pooled data of two year)
238.2
251.7
238
252
17.1 17.9 17.1 17.9
295.8 304.2
291
308.9
0
50
100
150
200
250
300
350
75% RDF 100 % RDF 0 t/ha 5 t/ha
Available N (kg/ha) Available P (kg/ha) Available k (kg/ha)
kg/ha
Chemical fertilizer FYM
Navsari (Gujarat) Jat et al. (2012)
Recommended dose of fertilizer (20:17.6:00 NPK kg/ha)
initial nutrient status: N(225 kg/ha), P2O5(15.41 kg/ha) and K2O N(291 kg/ha) 37
38. Table 14: Seed yield and soil health as influenced by sowing time and integrated
nutrient management in summer mungbean (Pooled over two year)
Treatment
Seed yield
(kg/ha)
pH
(%)
EC
(ds/m)
OM
(%)
Nutrient status of soil after
harvest (kg/ha)
N P K
Sowing time
5th April 1217 5.04 0.037 1.60 226.01 12.74 142.65
15th April 1009 4.98 0.036 1.56 224.77 10.84 141.98
S.Em. ± 71 0.07 0.001 0.01 2.72 0.87 2.86
C.D. (P=0.05) 105 NS NS NS NS NS NS
Integrated nutrient management
Control 905 4.82 0.034 1.44 221.08 8.75 137.32
100 % RDF 1067 5.00 0.036 1.62 225.42 12.62 142.21
50 % RDF + 50 % RDN (VC) + PSB 1367 5.20 0.041 1.69 229.67 14.00 147.42
S.Em. ± 10 0.06 0.0004 0.01 1.40 0.28 1.40
C.D. (P=0.05) 30 0.16 0.0011 0.03 4.04 0.80 4.02
Initial value 5.3 --- --- 225.3 12.40 140.0
Nagaland Kumar et al. (2015)
RDF– 20:40:00 NPK kg/ha; PSB – Phosphate solubilizing bacteria; EC – electric
conductivity; OM – organic matter 38
49. Application of required dose of nutrients
through selection of proper sources i.e. organic,
inorganic, biological and their combination at
right time through appropriate methods can
increase the production and improve nutritional
quality of legume crops with sustaining the soil
fertility status.
49