hyundaiglovis 086280 Algorithm Investment Report
•
0 likes•83 views

hyundaiglovis 086280 Algorithm Investment Report
![[Price for scheduled purchasing]
Arbitrarily made
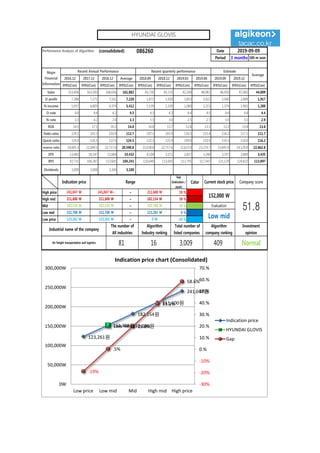
Algorithm stocks Trading Strategies (consolidated) 086260 Date
Period
Gap
(Indication /
stock)
Color
low price 123,261 W 123,261 W ~ 0 W -19 % 446,978 W 4
Low mid 152,708 W 152,708 W ~ 123,261 W 0 % -11,008 W -0
Mid 182,154 W 182,154 W ~ 152,708 W 20 % -468,995 W -3
High mid 211,600 W 211,600 W ~ 182,154 W 39 % -926,981 W -4
Suggested Purchase
Amount 2,364,094 W
Number of stocks
purchased 16
Indication price Range Buying / Selling Buying / Selling [Stocks]
High price 241,047 W 241,047 W~ ~ 211,600 W 59 % -1,384,968 W -6
2019-09-09
3 months
Current stock price Evaluation
Stock price rise
probability score
Investment opinion Prospective purchase amount
152,000 W Low mid 51.6 Normal 5,000,000 W
40.8 47.3 39.0 31.3 37.8 47.1
2019.04.15 2019.05.15 2019.06.13 2019.07.11 2019.08.08 2019.09.06
Stock price rise
probability score
A Sector 46.1 48.7 45.2 43.9 44.4 47.1
51.6B Sector 35.4 45.8 32.9 43.9 31.3 47.1
Total average
2019.06.13 2019.07.11 2019.08.08 2019.09.06
Total of
increase rate
Total score
A Sector 5 % -8 % -3 % 1 % 6 %
1 % 48.7B Sector 23 % -39 % 25 % -40 % 34 %
Total average 14 % -21 % -25 % 17 % 20 %
2019.05.15
46 49
45 44 44
47
35
46
33
44
31
47
41
47
39
31
38
47
0
10
20
30
40
50
60
2019.04.15 2019.05.15 2019.06.13 2019.07.11 2019.08.08 2019.09.06
Stock price rise probability score
A sector
B sector
Total average
5%
-8%
-3%
1%
6%
23%
-39%
25%
-40%
34%
14%
-21%
-25%
17% 20%
-60%
-40%
-20%
0%
20%
40%
2019.05.15 2019.06.13 2019.07.11 2019.08.08 2019.09.06
Increase rate of stock price rise
A sector
B sector
Total average
HYUNDAI GLOVIS](data:image/gif;base64,R0lGODlhAQABAIAAAAAAAP///yH5BAEAAAAALAAAAAABAAEAAAIBRAA7)
Recommended
Recommended
More Related Content
What's hot
What's hot (20)
Similar to hyundaiglovis 086280 Algorithm Investment Report
Similar to hyundaiglovis 086280 Algorithm Investment Report (20)
More from 알고리즘 기업분석 컨설팅-알기컨,algikeon
More from 알고리즘 기업분석 컨설팅-알기컨,algikeon (20)
Recently uploaded
Recently uploaded (20)
hyundaiglovis 086280 Algorithm Investment Report
- 1. Performance Analysis of Algorithm (consolidated) 086260 Date Period 3 months 100-m won 2016.12 2017.12 2018.12 Average 2018.09 2018.12 2019.03 2019.06 2019.09 2019.12 IFRS(Con) IFRS(Con) IFRS(Con) IFRS(Con) IFRS(Con) IFRS(Con) IFRS(Con) IFRS(Con) IFRS(Con) IFRS(Con) IFRS(Con) Sales 153,406 163,583 168,656 161,882 43,730 45,135 42,208 44,961 46,050 47,082 44,009 O-profit 7,288 7,271 7,101 7,220 1,871 1,920 1,853 2,022 2,040 2,089 1,917 N-income 5,057 6,805 4,374 5,412 1,539 1,339 1,060 1,215 1,374 1,461 1,288 O-rate 4.8 4.4 4.2 4.5 4.3 4.3 4.4 4.5 4.4 4.4 4.4 N-rate 3.3 4.2 2.6 3.3 3.5 3.0 2.5 2.7 3.0 3.1 2.9 ROE 14.5 17.1 10.3 14.0 14.8 13.7 12.8 13.1 13.3 13.4 13.6 Debt-ratio 129.1 105.2 103.9 112.7 107.3 103.9 120.1 115.4 116.2 117.1 111.7 Quick-ratio 124.0 126.5 122.9 124.5 122.3 122.9 109.0 110.9 110.3 110.0 116.2 reserve-ratio 18,005.3 21,049.5 22,717.6 20,590.8 22,038.8 22,717.6 22,623.9 23,270.7 23,695.9 24,129.0 22,662.8 EPS 13,485 18,147 11,664 14,432 4,104 3,571 2,827 3,240 3,707 3,869 3,435 BPS 92,731 106,387 113,605 104,241 110,640 113,605 113,795 117,547 121,129 124,822 113,897 Dividends 3,000 3,000 3,300 3,100 Major Financial Information Recent Annual Performance Recent quarterly performance Estimate Average 2019-09-09 Gap (Indication / stock) Color High price ~ 59 % High mid ~ 39 % Mid ~ 20 % Low mid ~ 0 % Low price ~ -19 % Normal 123,261 W 123,261 W 0 W Industrial name of the company The number of All industries Algorithm Industry ranking Total number of listed companies Algorithm company ranking Investment opinion Air freight transportation and logistics 81 16 3,009 409 211,600 W 211,600 W 182,154 W 182,154 W 182,154 W 152,708 W Evaluation 241,047 W 241,047 W~ 211,600 W 152,000 W 51.8152,708 W 152,708 W 123,261 W Low mid Indication price Range Current stock price Company score 123,261원 152,708원 182,154원 211,600원 241,047원 Low mid 152,000원 -19% .5% 19.8% 39.2% 58.6% -30% -20% -10% 0.% 10.% 20.% 30.% 40.% 50.% 60.% 70.% 0W 50,000W 100,000W 150,000W 200,000W 250,000W 300,000W Low price Low mid Mid High mid High price Indication price chart (Consolidated) Indication price HYUNDAI GLOVIS Gap HYUNDAI GLOVIS
- 2. [Price for scheduled purchasing] Arbitrarily made Algorithm stocks Trading Strategies (consolidated) 086260 Date Period Gap (Indication / stock) Color low price 123,261 W 123,261 W ~ 0 W -19 % 446,978 W 4 Low mid 152,708 W 152,708 W ~ 123,261 W 0 % -11,008 W -0 Mid 182,154 W 182,154 W ~ 152,708 W 20 % -468,995 W -3 High mid 211,600 W 211,600 W ~ 182,154 W 39 % -926,981 W -4 Suggested Purchase Amount 2,364,094 W Number of stocks purchased 16 Indication price Range Buying / Selling Buying / Selling [Stocks] High price 241,047 W 241,047 W~ ~ 211,600 W 59 % -1,384,968 W -6 2019-09-09 3 months Current stock price Evaluation Stock price rise probability score Investment opinion Prospective purchase amount 152,000 W Low mid 51.6 Normal 5,000,000 W 40.8 47.3 39.0 31.3 37.8 47.1 2019.04.15 2019.05.15 2019.06.13 2019.07.11 2019.08.08 2019.09.06 Stock price rise probability score A Sector 46.1 48.7 45.2 43.9 44.4 47.1 51.6B Sector 35.4 45.8 32.9 43.9 31.3 47.1 Total average 2019.06.13 2019.07.11 2019.08.08 2019.09.06 Total of increase rate Total score A Sector 5 % -8 % -3 % 1 % 6 % 1 % 48.7B Sector 23 % -39 % 25 % -40 % 34 % Total average 14 % -21 % -25 % 17 % 20 % 2019.05.15 46 49 45 44 44 47 35 46 33 44 31 47 41 47 39 31 38 47 0 10 20 30 40 50 60 2019.04.15 2019.05.15 2019.06.13 2019.07.11 2019.08.08 2019.09.06 Stock price rise probability score A sector B sector Total average 5% -8% -3% 1% 6% 23% -39% 25% -40% 34% 14% -21% -25% 17% 20% -60% -40% -20% 0% 20% 40% 2019.05.15 2019.06.13 2019.07.11 2019.08.08 2019.09.06 Increase rate of stock price rise A sector B sector Total average HYUNDAI GLOVIS
- 3. 정보와 완전 정보 결 투자판단 있습니 위배 무단으 숙지하 Compliance notice ① The information provided by The Algorithm Company Analysis Consulting is obtained through reliable data and information and The Algorithm Company Analysis Program (TACAP), but its accuracy or completeness are not guaranteed. Furthermore, it may change over time.Therefore, we are not legally responsible for the results of the data provided by The Algorithm Company Analysis Consulting because of information errors or omissions. ② The Algorithm Company Analysis Consulting and all the information provided on it site are reference materials for investment decisions and the final responsibility of investment is up to users utilizing this information. ③ The Algorithm Company Analysis Consulting and its site do not do anything that violates the related laws such as discretionary transaction. ④ Users can not reallocate and recycle the information provided by The Algorithm Company Analysis Consulting firm let alone the information provided by its Site. ⑤ Be sure to know about application period of this algorithm analysis report in order to improve its accuracy. Tel : 070 - 4667 - 5009 Email : tacac@tacac.co.kr Homepage : tacac.co.kr Blog : tacac.blog.me SERVICES M&A, IPO, RECOVER, CORPORATE RESTRUCTURING, MANAGEMENT OF TECHNOLOGY, BUSINESS STRATEGY, FAMILY BUSINESS Request : http://tacac.co.kr/?page_id=1374 ① Consulting The Algori accuracy o change ove results of Consulting ② informatio investmen up ③ do anythin transaction ④ The Algori informatio ⑤ analysis re