unison 018000 Algorithm Investment Report
•
0 likes•64 views

This document provides a performance analysis of an algorithm (consolidated) over several time periods. It includes key financial metrics such as sales, operating profit, net income, debt ratio, and stock price for the company. Charts show the indication price range compared to the current stock price and probability scores for stock price increases in different sectors. The analysis recommends a prospective purchase amount and number of stocks to purchase based on the indication price ranges. It notes that while the information and analysis is obtained through reliable data and programs, its accuracy is not guaranteed and users are responsible for their own investment decisions based on this reference material.
![[Price for scheduled purchasing]
Arbitrarily made
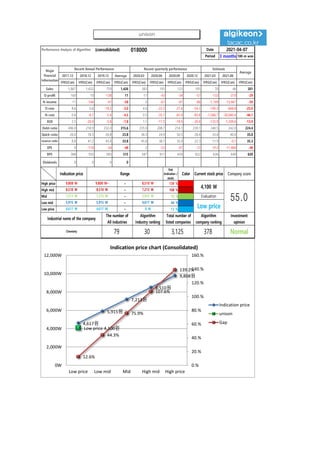
Algorithm stocks Trading Strategies (consolidated) 018000 Date
Period
Gap
(Indication /
stock)
Color
low price 4,617 W 4,617 W ~ 0 W 13 % -612,786 W -133
Low mid 5,915 W 5,915 W ~ 4,617 W 44 % -2,149,711 W -363
Mid 7,213 W 7,213 W ~ 5,915 W 76 % -3,686,637 W -511
High mid 8,510 W 8,510 W ~ 7,213 W 108 % -5,223,563 W All selling
Suggested Purchase
Amount 4,855,930 W
Number of stocks
purchased 1,184
Indication price Range Buying / Selling Buying / Selling [Stocks]
High price 9,808 W 9,808 W~ ~ 8,510 W 139 % -6,760,488 W All selling
2021-04-07
3 months
Current stock price Evaluation
Stock price rise
probability score
Investment opinion Prospective purchase amount
4,100 W Low price 61.9 Normal 8,800,000 W
40.7 46.0 40.9 26.7 37.8 45.4
2020.11.09 2020.12.07 2021.01.07 2021.02.04 2021.03.09 2021.04.06
Stock price rise
probability score
A Sector 46.1 51.6 52.5 47.6 41.8 50.8
61.9
B Sector 35.4 40.4 29.2 47.6 33.8 40.0
Total average
2021.01.07 2021.02.04 2021.03.09 2021.04.06
Total of
increase rate
Total score
A Sector 11 % 2 % -10 % -14 % 18 %
-2 % 47.7
B Sector 12 % -39 % 39 % -41 % 16 %
Total average 11 % -13 % -53 % 29 % 17 %
2020.12.07
46
52 53
48
42
51
35
40
29
48
34
40
41
46
41
27
38
45
0
10
20
30
40
50
60
2020.11.09 2020.12.07 2021.01.07 2021.02.04 2021.03.09 2021.04.06
Stock price rise probability score
A sector
B sector
Total average
11%
2%
-10% -14%
18%
12%
-39%
39%
-41%
16%
11%
-13%
-53%
29%
17%
-60%
-40%
-20%
0%
20%
40%
60%
2020.12.07 2021.01.07 2021.02.04 2021.03.09 2021.04.06
Increase rate of stock price rise
A sector
B sector
Total average
unison](data:image/gif;base64,R0lGODlhAQABAIAAAAAAAP///yH5BAEAAAAALAAAAAABAAEAAAIBRAA7)
Recommended
Recommended
More Related Content
What's hot
What's hot (20)
Similar to unison 018000 Algorithm Investment Report
Similar to unison 018000 Algorithm Investment Report (20)
More from 알고리즘 기업분석 컨설팅-알기컨,algikeon
More from 알고리즘 기업분석 컨설팅-알기컨,algikeon (20)
Recently uploaded
Recently uploaded (8)
unison 018000 Algorithm Investment Report
- 1. Performance Analysis of Algorithm (consolidated) 018000 Date Period 3 months 100-m won 2017.12 2018.12 2019.12 Average 2020.03 2020.06 2020.09 2020.12 2021.03 2021.06 IFRS(Con) IFRS(Con) IFRS(Con) IFRS(Con) IFRS(Con) IFRS(Con) IFRS(Con) IFRS(Con) IFRS(Con) IFRS(Con) IFRS(Con) Sales 1,867 1,652 759 1,426 383 191 123 105 70 46 201 O-profit 160 10 -138 11 17 -43 -34 -57 -133 -310 -29 N-income 11 -144 -41 -58 2 -67 -81 -88 -1,109 -13,967 -59 O-rate 8.6 0.6 -18.2 -3.0 4.4 -22.5 -27.6 -54.3 -190.3 -666.8 -25.0 N-rate 0.6 -8.7 -5.4 -4.5 0.5 -35.1 -65.9 -83.8 -1,586.7 -30,040.4 -46.1 ROE 2.5 -20.0 -5.8 -7.8 1.1 -17.5 -18.9 -20.4 -125.9 -1,209.6 -13.9 Debt-ratio 496.0 218.9 232.0 315.6 235.9 208.7 214.1 239.1 240.5 242.0 224.4 Quick-ratio 26.0 18.5 26.8 23.8 36.3 24.9 50.5 28.4 33.6 40.4 35.0 reserve-ratio 8.8 47.2 45.4 33.8 45.8 38.1 35.0 22.3 11.9 -0.1 35.3 EPS 9 -118 -34 -48 2 -55 -67 -72 -912 -11,484 -48 BPS 368 592 585 515 587 611 659 622 636 649 620 Dividends 0 0 0 0 Major Financial Information Recent Annual Performance Recent quarterly performance Estimate Average 2021-04-07 Gap (Indication / stock) Color High price ~ 139 % High mid ~ 108 % Mid ~ 76 % Low mid ~ 44 % Low price ~ 13 % Normal 4,617 W 4,617 W 0 W Industrial name of the company The number of All industries Algorithm Industry ranking Total number of listed companies Algorithm company ranking Investment opinion Chemistry 79 30 3,125 378 8,510 W 8,510 W 7,213 W 7,213 W 7,213 W 5,915 W Evaluation 9,808 W 9,808 W~ 8,510 W 4,100 W 55.0 5,915 W 5,915 W 4,617 W Low price Indication price Range Current stock price Company score 4,617원 5,915원 7,213원 8,510원 9,808원 Low price 4,100원 12.6% 44.3% 75.9% 107.6% 139.2% 0.% 20.% 40.% 60.% 80.% 100.% 120.% 140.% 160.% 0W 2,000W 4,000W 6,000W 8,000W 10,000W 12,000W Low price Low mid Mid High mid High price Indication price chart (Consolidated) Indication price unison Gap unison
- 2. [Price for scheduled purchasing] Arbitrarily made Algorithm stocks Trading Strategies (consolidated) 018000 Date Period Gap (Indication / stock) Color low price 4,617 W 4,617 W ~ 0 W 13 % -612,786 W -133 Low mid 5,915 W 5,915 W ~ 4,617 W 44 % -2,149,711 W -363 Mid 7,213 W 7,213 W ~ 5,915 W 76 % -3,686,637 W -511 High mid 8,510 W 8,510 W ~ 7,213 W 108 % -5,223,563 W All selling Suggested Purchase Amount 4,855,930 W Number of stocks purchased 1,184 Indication price Range Buying / Selling Buying / Selling [Stocks] High price 9,808 W 9,808 W~ ~ 8,510 W 139 % -6,760,488 W All selling 2021-04-07 3 months Current stock price Evaluation Stock price rise probability score Investment opinion Prospective purchase amount 4,100 W Low price 61.9 Normal 8,800,000 W 40.7 46.0 40.9 26.7 37.8 45.4 2020.11.09 2020.12.07 2021.01.07 2021.02.04 2021.03.09 2021.04.06 Stock price rise probability score A Sector 46.1 51.6 52.5 47.6 41.8 50.8 61.9 B Sector 35.4 40.4 29.2 47.6 33.8 40.0 Total average 2021.01.07 2021.02.04 2021.03.09 2021.04.06 Total of increase rate Total score A Sector 11 % 2 % -10 % -14 % 18 % -2 % 47.7 B Sector 12 % -39 % 39 % -41 % 16 % Total average 11 % -13 % -53 % 29 % 17 % 2020.12.07 46 52 53 48 42 51 35 40 29 48 34 40 41 46 41 27 38 45 0 10 20 30 40 50 60 2020.11.09 2020.12.07 2021.01.07 2021.02.04 2021.03.09 2021.04.06 Stock price rise probability score A sector B sector Total average 11% 2% -10% -14% 18% 12% -39% 39% -41% 16% 11% -13% -53% 29% 17% -60% -40% -20% 0% 20% 40% 60% 2020.12.07 2021.01.07 2021.02.04 2021.03.09 2021.04.06 Increase rate of stock price rise A sector B sector Total average unison
- 3. 정보와 완전 정보 결 투자판단 있습니 위배 무단으 숙지하 Compliance notice ① The information provided by The Algorithm Company Analysis Consulting is obtained through reliable data and information and The Algorithm Company Analysis Program (TACAP), but its accuracy or completeness are not guaranteed. Furthermore, it may change over time.Therefore, we are not legally responsible for the results of the data provided by The Algorithm Company Analysis Consulting because of information errors or omissions. ② The Algorithm Company Analysis Consulting and all the information provided on it site are reference materials for investment decisions and the final responsibility of investment is up to users utilizing this information. ③ The Algorithm Company Analysis Consulting and its site do not do anything that violates the related laws such as discretionary transaction. ④ Users can not reallocate and recycle the information provided by The Algorithm Company Analysis Consulting firm let alone the information provided by its Site. ⑤ Be sure to know about application period of this algorithm analysis report in order to improve its accuracy. Tel : 070 - 4667 - 5009 Email : tacac@tacac.co.kr Homepage : tacac.co.kr Blog : tacac.blog.me SERVICES M&A, IPO, RECOVER, CORPORATE RESTRUCTURING, MANAGEMENT OF TECHNOLOGY, BUSINESS STRATEGY, FAMILY BUSINESS Request : http://tacac.co.kr/?page_id=1374 ① Consulting is o The Algorithm accuracy or com change over tim results of the d Consulting bec ② information pr investment dec up ③ do anything th transaction. ④ The Algorithm information pr ⑤ analysis report