HYUNDAI E&C 000720 Algorithm Investment Report
•
0 likes•135 views

This document contains performance data and financial analysis of Algorithm company over several periods from 2016-2019. It includes sales, operating profit, net income, operating rate, net rate, return on equity, debt ratio, quick ratio, and other metrics on a quarterly and annual basis. It also provides the company's stock price history, probability of price increases by sector, and proposed purchase amounts and prices under different market conditions.
![[Price for scheduled purchasing]
Arbitrarily made
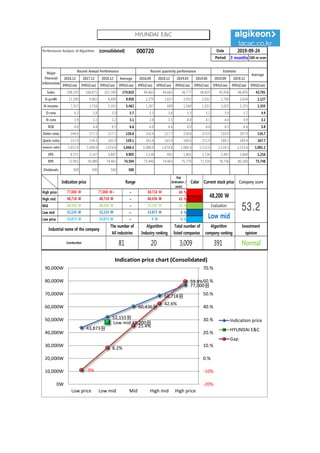
Algorithm stocks Trading Strategies (consolidated) 000720 Date
Period
Gap
(Indication /
stock)
Color
low price 43,873 W 43,873 W ~ 0 W -9 % 285,297 W 7
Low mid 52,155 W 52,155 W ~ 43,873 W 8 % -260,756 W -5
Mid 60,436 W 60,436 W ~ 52,155 W 25 % -806,809 W -13
High mid 68,718 W 68,718 W ~ 60,436 W 43 % -1,352,862 W -20
Suggested Purchase
Amount 3,178,099 W
Number of stocks
purchased 66
Indication price Range Buying / Selling Buying / Selling [Stocks]
High price 77,000 W 77,000 W~ ~ 68,718 W 60 % -1,898,914 W -25
2019-09-24
3 months
Current stock price Evaluation
Stock price rise
probability score
Investment opinion Prospective purchase amount
48,200 W Low mid 49.9 Normal 7,000,000 W
36.0 45.2 46.3 59.6 37.8 42.1
2019.04.26 2019.05.28 2019.06.26 2019.07.24 2019.08.22 2019.09.23
Stock price rise
probability score
A Sector 50.0 46.7 47.1 44.6 48.1 50.4
49.9B Sector 22.1 43.8 45.4 44.6 27.5 33.8
Total average
2019.06.26 2019.07.24 2019.08.22 2019.09.23
Total of
increase rate
Total score
A Sector -7 % 1 % -6 % 7 % 5 %
-1 % 49.3B Sector 50 % 4 % -2 % -62 % 19 %
Total average 20 % 2 % 22 % -58 % 10 %
2019.05.28
50
47 47 45
48 50
22
44 45 45
28
3436
45 46
60
38
42
0
10
20
30
40
50
60
70
2019.04.26 2019.05.28 2019.06.26 2019.07.24 2019.08.22 2019.09.23
Stock price rise probability score
A sector
B sector
Total average
-7%
1%
-6%
7% 5%
50%
4% -2%
-62%
19%20%
2%
22%
-58%
10%
-80%
-60%
-40%
-20%
0%
20%
40%
60%
2019.05.28 2019.06.26 2019.07.24 2019.08.22 2019.09.23
Increase rate of stock price rise
A sector
B sector
Total average
HYUNDAI E&C](data:image/gif;base64,R0lGODlhAQABAIAAAAAAAP///yH5BAEAAAAALAAAAAABAAEAAAIBRAA7)
Recommended
Recommended
More Related Content
What's hot
What's hot (20)
Similar to HYUNDAI E&C 000720 Algorithm Investment Report
Similar to HYUNDAI E&C 000720 Algorithm Investment Report (20)
More from 알고리즘 기업분석 컨설팅-알기컨,algikeon
More from 알고리즘 기업분석 컨설팅-알기컨,algikeon (20)
Recently uploaded
Recently uploaded (8)
HYUNDAI E&C 000720 Algorithm Investment Report
- 1. Performance Analysis of Algorithm (consolidated) 000720 Date Period 3 months 100-m won 2016.12 2017.12 2018.12 Average 2018.09 2018.12 2019.03 2019.06 2019.09 2019.12 IFRS(Con) IFRS(Con) IFRS(Con) IFRS(Con) IFRS(Con) IFRS(Con) IFRS(Con) IFRS(Con) IFRS(Con) IFRS(Con) IFRS(Con) Sales 188,250 168,871 167,309 174,810 44,863 44,663 38,777 46,819 45,956 46,405 43,781 O-profit 11,590 9,861 8,400 9,950 2,379 1,627 2,052 2,451 2,700 2,654 2,127 N-income 7,317 3,716 5,353 5,462 1,267 669 1,560 1,922 2,023 2,255 1,355 O-rate 6.2 5.8 5.0 5.7 5.3 3.6 5.3 5.2 5.9 5.7 4.9 N-rate 3.9 2.2 3.2 3.1 2.8 1.5 4.0 4.1 4.4 4.9 3.1 ROE 9.0 4.4 6.5 6.6 6.0 4.6 6.0 6.4 6.5 6.6 5.8 Debt-ratio 144.6 117.5 117.7 126.6 116.4 117.7 118.6 113.9 110.9 107.9 116.7 Quick-ratio 157.0 154.3 165.9 159.1 163.4 165.9 169.6 171.9 180.1 189.4 167.7 reserve-ratio 1,015.9 1,048.9 1,074.8 1,046.5 1,088.0 1,074.8 1,086.4 1,115.0 1,124.3 1,133.6 1,091.1 EPS 6,571 3,337 4,807 4,905 1,138 601 1,401 1,726 1,447 1,664 1,216 BPS 72,961 76,089 74,463 74,504 75,440 74,463 75,770 77,318 78,736 80,180 75,748 Dividends 500 500 500 500 Major Financial Information Recent Annual Performance Recent quarterly performance Estimate Average 2019-09-24 Gap (Indication / stock) Color High price ~ 60 % High mid ~ 43 % Mid ~ 25 % Low mid ~ 8 % Low price ~ -9 % Normal 43,873 W 43,873 W 0 W Industrial name of the company The number of All industries Algorithm Industry ranking Total number of listed companies Algorithm company ranking Investment opinion Construction 81 20 3,009 391 68,718 W 68,718 W 60,436 W 60,436 W 60,436 W 52,155 W Evaluation 77,000 W 77,000 W~ 68,718 W 48,200 W 53.252,155 W 52,155 W 43,873 W Low mid Indication price Range Current stock price Company score 43,873원 52,155원 60,436원 68,718원 77,000원 Low mid 48,200원 -9% 8.2% 25.4% 42.6% 59.8% -20% -10% 0.% 10.% 20.% 30.% 40.% 50.% 60.% 70.% 0W 10,000W 20,000W 30,000W 40,000W 50,000W 60,000W 70,000W 80,000W 90,000W Low price Low mid Mid High mid High price Indication price chart (Consolidated) Indication price HYUNDAI E&C Gap HYUNDAI E&C
- 2. [Price for scheduled purchasing] Arbitrarily made Algorithm stocks Trading Strategies (consolidated) 000720 Date Period Gap (Indication / stock) Color low price 43,873 W 43,873 W ~ 0 W -9 % 285,297 W 7 Low mid 52,155 W 52,155 W ~ 43,873 W 8 % -260,756 W -5 Mid 60,436 W 60,436 W ~ 52,155 W 25 % -806,809 W -13 High mid 68,718 W 68,718 W ~ 60,436 W 43 % -1,352,862 W -20 Suggested Purchase Amount 3,178,099 W Number of stocks purchased 66 Indication price Range Buying / Selling Buying / Selling [Stocks] High price 77,000 W 77,000 W~ ~ 68,718 W 60 % -1,898,914 W -25 2019-09-24 3 months Current stock price Evaluation Stock price rise probability score Investment opinion Prospective purchase amount 48,200 W Low mid 49.9 Normal 7,000,000 W 36.0 45.2 46.3 59.6 37.8 42.1 2019.04.26 2019.05.28 2019.06.26 2019.07.24 2019.08.22 2019.09.23 Stock price rise probability score A Sector 50.0 46.7 47.1 44.6 48.1 50.4 49.9B Sector 22.1 43.8 45.4 44.6 27.5 33.8 Total average 2019.06.26 2019.07.24 2019.08.22 2019.09.23 Total of increase rate Total score A Sector -7 % 1 % -6 % 7 % 5 % -1 % 49.3B Sector 50 % 4 % -2 % -62 % 19 % Total average 20 % 2 % 22 % -58 % 10 % 2019.05.28 50 47 47 45 48 50 22 44 45 45 28 3436 45 46 60 38 42 0 10 20 30 40 50 60 70 2019.04.26 2019.05.28 2019.06.26 2019.07.24 2019.08.22 2019.09.23 Stock price rise probability score A sector B sector Total average -7% 1% -6% 7% 5% 50% 4% -2% -62% 19%20% 2% 22% -58% 10% -80% -60% -40% -20% 0% 20% 40% 60% 2019.05.28 2019.06.26 2019.07.24 2019.08.22 2019.09.23 Increase rate of stock price rise A sector B sector Total average HYUNDAI E&C
- 3. 정보와 완전 정보 결 투자판단 있습니 위배 무단으 숙지하 Compliance notice ① The information provided by The Algorithm Company Analysis Consulting is obtained through reliable data and information and The Algorithm Company Analysis Program (TACAP), but its accuracy or completeness are not guaranteed. Furthermore, it may change over time.Therefore, we are not legally responsible for the results of the data provided by The Algorithm Company Analysis Consulting because of information errors or omissions. ② The Algorithm Company Analysis Consulting and all the information provided on it site are reference materials for investment decisions and the final responsibility of investment is up to users utilizing this information. ③ The Algorithm Company Analysis Consulting and its site do not do anything that violates the related laws such as discretionary transaction. ④ Users can not reallocate and recycle the information provided by The Algorithm Company Analysis Consulting firm let alone the information provided by its Site. ⑤ Be sure to know about application period of this algorithm analysis report in order to improve its accuracy. Tel : 070 - 4667 - 5009 Email : tacac@tacac.co.kr Homepage : tacac.co.kr Blog : tacac.blog.me SERVICES M&A, IPO, RECOVER, CORPORATE RESTRUCTURING, MANAGEMENT OF TECHNOLOGY, BUSINESS STRATEGY, FAMILY BUSINESS Request : http://tacac.co.kr/?page_id=1374 ① Consulting The Algori accuracy o change ove results of Consulting ② informatio investmen up ③ do anythin transaction ④ The Algori informatio ⑤ analysis re