samsung biologics 207940 Algorithm Investment Report
•
0 likes•17 views

samsung biologics 207940 Algorithm Investment Report
![[Price for scheduled purchasing]
Arbitrarily made
Algorithm stocks Trading Strategies (Separate) 207940 Date
Period
Gap
(Indication /
stock)
Color
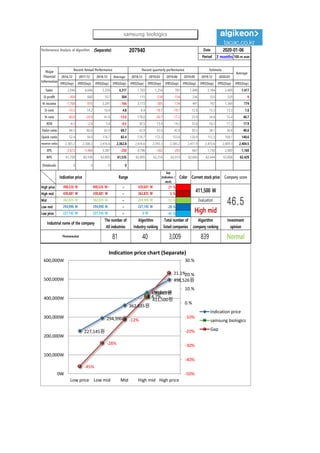
low price 227,145 W 227,145 W ~ 0 W -45 % 658,948 W 3
Low mid 294,990 W 294,990 W ~ 227,145 W -28 % 416,446 W 1
Mid 362,835 W 362,835 W ~ 294,990 W -12 % 173,944 W 0
High mid 430,681 W 430,681 W ~ 362,835 W 5 % -68,558 W -0
Suggested Purchase
Amount 1,470,839 W
Number of stocks
purchased 4
Indication price Range Buying / Selling Buying / Selling [Stocks]
High price 498,526 W 498,526 W~ ~ 430,681 W 21 % -311,060 W -1
2020-01-06
3 months
Current stock price Evaluation
Stock price rise
probability score
Investment opinion Prospective purchase amount
411,500 W High mid 62.9 Normal 3,500,000 W
Stock price rise
probability score
A Sector 47.7 49.9 48.4 47.3 50.8 54.4
62.9B Sector 36.3 12.9 47.3 47.3 36.7 60.4
Total average 42.0 31.4 46.1 56.7 43.7 57.4
2019.08.06 2019.09.04 2019.10.07 2019.11.05 2019.12.03 2020.01.03
2019.10.07 2019.11.05 2019.12.03 2020.01.03
Total of
increase rate
Total score
A Sector 4 % -3 % -2 % 7 % 7 %
2 % 49.7B Sector -181 % 70 % 7 % -29 % 39 %
Total average -34 % 32 % 19 % -30 % 24 %
2019.09.04
4% -3% -2% 7% 7%
-181%
70%
7%
-29%
39%
-34%
32%
19%
-30%
24%
-200%
-150%
-100%
-50%
0%
50%
100%
2019.09.04 2019.10.07 2019.11.05 2019.12.03 2020.01.03
Increase rate of stock price rise
A sector
B sector
Total average
samsung biologics
48 50 48 47
51
54
36
13
44
47
37
60
42
31
46
57
44
57
0
10
20
30
40
50
60
70
2019.08.06 2019.09.04 2019.10.07 2019.11.05 2019.12.03 2020.01.03
Stock price rise probability score
A sector
B sector
Total average](data:image/gif;base64,R0lGODlhAQABAIAAAAAAAP///yH5BAEAAAAALAAAAAABAAEAAAIBRAA7)
Recommended
Recommended
More Related Content
What's hot
What's hot (20)
Similar to samsung biologics 207940 Algorithm Investment Report
Similar to samsung biologics 207940 Algorithm Investment Report (20)
More from 알고리즘 기업분석 컨설팅-알기컨,algikeon
More from 알고리즘 기업분석 컨설팅-알기컨,algikeon (20)
Recently uploaded
Recently uploaded (20)
samsung biologics 207940 Algorithm Investment Report
- 1. Performance Analysis of Algorithm (Separate) 207940 Date Period 3 months 100-m won 2016.12 2017.12 2018.12 Average 2018.12 2019.03 2019.06 2019.09 2019.12 2020.03 IFRS(Sep) IFRS(Sep) IFRS(Sep) IFRS(Sep) IFRS(Sep) IFRS(Sep) IFRS(Sep) IFRS(Sep) IFRS(Sep) IFRS(Sep) IFRS(Sep) Sales 2,946 4,646 5,358 4,317 1,783 1,254 781 1,848 2,184 2,469 1,417 O-profit -304 660 557 304 115 -234 -154 236 333 329 -9 N-income -1,768 -970 2,241 -166 3,173 -385 -134 441 761 1,369 774 O-rate -10.3 14.2 10.4 4.8 6.4 -18.7 -19.7 12.8 15.3 13.3 1.6 N-rate -60.0 -20.9 41.8 -13.0 178.0 -30.7 -17.2 23.9 34.8 55.4 40.7 ROE -4.3 -2.4 5.4 -0.5 30.5 13.4 14.2 15.6 16.2 17.2 17.9 Debt-ratio 84.5 80.6 43.9 69.7 43.9 43.0 42.0 39.5 38.1 36.8 40.6 Quick-ratio 52.4 18.0 176.7 82.4 176.7 172.3 153.0 120.9 112.3 108.1 140.6 reserve-ratio 2,365.2 2,306.5 2,416.6 2,362.8 2,416.6 2,393.3 2,385.2 2,411.9 2,410.6 2,409.3 2,404.5 EPS -2,672 -1,466 3,387 -250 4,796 -582 -203 667 1,150 2,069 1,169 BPS 61,700 60,100 62,805 61,535 62,805 62,216 62,013 62,683 62,644 62,606 62,429 Dividends 0 0 0 0 2020-01-06 Major Financial Information Recent Annual Performance Recent quarterly performance Estimate Average Gap (Indication / stock) Color High price ~ 21 % High mid ~ 5 % Mid ~ -12 % Low mid ~ -28 % Low price ~ -45 % Normal 227,145 W 227,145 W 0 W Industrial name of the company The number of All industries Algorithm Industry ranking Total number of listed companies Algorithm company ranking Investment opinion Pharmaceutical 81 40 3,009 839 430,681 W 430,681 W 362,835 W 362,835 W 362,835 W 294,990 W Evaluation 498,526 W 498,526 W~ 430,681 W 411,500 W 46.5294,990 W 294,990 W 227,145 W High mid Indication price Range Current stock price Company score 227,145원 294,990원 362,835원 430,681원 498,526원 High mid 411,500원 -45% -28% -12% 4.7% 21.1% -50% -40% -30% -20% -10% 0.% 10.% 20.% 30.% 0W 100,000W 200,000W 300,000W 400,000W 500,000W 600,000W Low price Low mid Mid High mid High price Indication price chart (Separate) Indication price samsung biologics Gap samsung biologics
- 2. [Price for scheduled purchasing] Arbitrarily made Algorithm stocks Trading Strategies (Separate) 207940 Date Period Gap (Indication / stock) Color low price 227,145 W 227,145 W ~ 0 W -45 % 658,948 W 3 Low mid 294,990 W 294,990 W ~ 227,145 W -28 % 416,446 W 1 Mid 362,835 W 362,835 W ~ 294,990 W -12 % 173,944 W 0 High mid 430,681 W 430,681 W ~ 362,835 W 5 % -68,558 W -0 Suggested Purchase Amount 1,470,839 W Number of stocks purchased 4 Indication price Range Buying / Selling Buying / Selling [Stocks] High price 498,526 W 498,526 W~ ~ 430,681 W 21 % -311,060 W -1 2020-01-06 3 months Current stock price Evaluation Stock price rise probability score Investment opinion Prospective purchase amount 411,500 W High mid 62.9 Normal 3,500,000 W Stock price rise probability score A Sector 47.7 49.9 48.4 47.3 50.8 54.4 62.9B Sector 36.3 12.9 47.3 47.3 36.7 60.4 Total average 42.0 31.4 46.1 56.7 43.7 57.4 2019.08.06 2019.09.04 2019.10.07 2019.11.05 2019.12.03 2020.01.03 2019.10.07 2019.11.05 2019.12.03 2020.01.03 Total of increase rate Total score A Sector 4 % -3 % -2 % 7 % 7 % 2 % 49.7B Sector -181 % 70 % 7 % -29 % 39 % Total average -34 % 32 % 19 % -30 % 24 % 2019.09.04 4% -3% -2% 7% 7% -181% 70% 7% -29% 39% -34% 32% 19% -30% 24% -200% -150% -100% -50% 0% 50% 100% 2019.09.04 2019.10.07 2019.11.05 2019.12.03 2020.01.03 Increase rate of stock price rise A sector B sector Total average samsung biologics 48 50 48 47 51 54 36 13 44 47 37 60 42 31 46 57 44 57 0 10 20 30 40 50 60 70 2019.08.06 2019.09.04 2019.10.07 2019.11.05 2019.12.03 2020.01.03 Stock price rise probability score A sector B sector Total average
- 3. do not the Compliance notice ① The information provided by The Algorithm Company Analysis Consulting is obtained through reliable data and information and The Algorithm Company Analysis Program (TACAP), but its accuracy or completeness are not guaranteed. Furthermore, it may change over time.Therefore, we are not legally responsible for the results of the data provided by The Algorithm Company Analysis Consulting because of information errors or omissions. ② The Algorithm Company Analysis Consulting and all the information provided on it site are reference materials for investment decisions and the final responsibility of investment is up to users utilizing this information. ③ The Algorithm Company Analysis Consulting and its site do not do anything that violates the related laws such as discretionary transaction. ④ Users can not reallocate and recycle the information provided by The Algorithm Company Analysis Consulting firm let alone the information provided by its Site. ⑤ Be sure to know about application period of this algorithm analysis report in order to improve its accuracy. Tel : 070 - 4667 - 5009 Email : tacac@tacac.co.kr Homepage : tacac.co.kr Blog : tacac.blog.me SERVICES M&A, IPO, RECOVER, CORPORATE RESTRUCTURING, MANAGEMENT OF TECHNOLOGY, BUSINESS STRATEGY, FAMILY BUSINESS Request : http://tacac.co.kr/?page_id=1374