hmm 011200 Algorithm Investment Report
•
1 like•73 views

hmm 011200 Algorithm Investment Report
![[Price for scheduled purchasing]
Arbitrarily made
Algorithm stocks Trading Strategies (consolidated) 011200 Date
Period
Gap
(Indication /
stock)
Color
2021-06-04
3 months
Current stock price Evaluation
Stock price rise
probability score
Investment opinion Prospective purchase amount
47,250 W High price 37.9 Normal 4,000,000 W
Suggested Purchase
Amount 1,191,358 W
Number of stocks
purchased 25
Indication price Range Buying / Selling Buying / Selling [Stocks]
High price 31,609 W 31,609 W~ ~ 27,314 W -33 % 394,367 W 12
High mid 27,314 W 27,314 W ~ 23,020 W -42 % 502,654 W 18
Mid 23,020 W 23,020 W ~ 18,725 W -51 % 610,941 W 27
Low mid 18,725 W 18,725 W ~ 14,430 W -60 % 719,229 W 38
low price 14,430 W 14,430 W ~ 0 W -69 % 827,516 W 57
Stock price rise
probability score
A Sector 49.2 48.4 46.7 48.4 50.4 46.1
37.9
B Sector 56.7 37.5 53.8 48.4 16.7 44.6
Total average
2021.01.07 2021.02.04 2021.03.09 2021.04.06 2021.05.04 2021.06.03
52.9 43.0 50.2 30.8 33.5 45.4
8 % 26 %
2021.02.04 2021.03.09 2021.04.06 2021.05.04 2021.06.03
Total of
increase rate
Total score
A Sector -2 % -4 % 4 % 4 % -9 %
-8 % 44.0
B Sector -51 % 30 % -11 % -191 % 63 %
Total average -23 % 14 % -63 %
49 48 47 48 50
46
57
38
54
48
17
45
53
43
50
31
34
45
0
10
20
30
40
50
60
2021.01.07 2021.02.04 2021.03.09 2021.04.06 2021.05.04 2021.06.03
Stock price rise probability score
A sector
B sector
Total average
-2% -4% 4% 4% -9%
-51%
30%
-11%
-191%
63%
-23%
14%
-63%
8%
26%
-250%
-200%
-150%
-100%
-50%
0%
50%
100%
2021.02.04 2021.03.09 2021.04.06 2021.05.04 2021.06.03
Increase rate of stock price rise
A sector
B sector
Total average
hmm](data:image/gif;base64,R0lGODlhAQABAIAAAAAAAP///yH5BAEAAAAALAAAAAABAAEAAAIBRAA7)
Recommended
Recommended
More Related Content
What's hot
What's hot (20)
Similar to hmm 011200 Algorithm Investment Report
Similar to hmm 011200 Algorithm Investment Report (20)
More from 알고리즘 기업분석 컨설팅-알기컨,algikeon
More from 알고리즘 기업분석 컨설팅-알기컨,algikeon (20)
Recently uploaded
Recently uploaded (20)
hmm 011200 Algorithm Investment Report
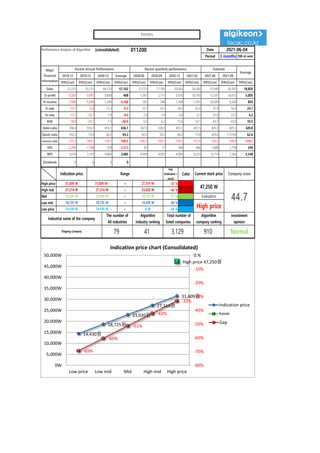
- 1. Performance Analysis of Algorithm (consolidated) 011200 Date Period 3 months 100-m won 2018.12 2019.12 2020.12 Average 2020.06 2020.09 2020.12 2021.03 2021.06 2021.09 IFRS(Con) IFRS(Con) IFRS(Con) IFRS(Con) IFRS(Con) IFRS(Con) IFRS(Con) IFRS(Con) IFRS(Con) IFRS(Con) IFRS(Con) Sales 52,221 55,131 64,133 57,162 13,751 17,185 20,065 24,280 25,949 28,392 18,820 O-profit -5,587 -2,997 9,808 408 1,387 2,771 5,670 10,193 12,201 16,012 5,005 N-income -7,906 -5,898 1,240 -4,188 281 246 1,368 1,541 16,028 9,504 859 O-rate -10.7 -5.4 15.3 -0.3 10.1 16.1 28.3 42.0 47.0 56.4 24.1 N-rate -15.1 -10.7 1.9 -8.0 2.0 1.4 6.8 6.3 61.8 33.5 4.2 ROE -76.0 -54.1 7.3 -40.9 6.5 6.2 15.0 14.1 63.7 42.8 10.5 Debt-ratio 296.4 556.7 455.1 436.1 387.9 438.5 455.1 401.5 403.5 405.5 420.8 Quick-ratio 142.5 74.4 66.2 94.3 60.2 50.2 66.2 73.8 205.0 1,174.8 62.6 reserve-ratio -125.3 -180.1 -176.1 -160.5 -185.3 -183.1 -176.1 -151.9 -150.2 -148.4 -174.1 EPS -2,289 -1,708 359 -1,213 81 71 396 446 1,888 1,778 249 BPS 3,010 3,157 4,889 3,685 4,999 4,901 4,889 6,203 6,714 7,266 5,248 Dividends 0 0 0 0 2021-06-04 Major Financial Information Recent Annual Performance Recent quarterly performance Estimate Average Gap (Indication / stock) Color High price ~ -33 % High mid ~ -42 % Mid ~ -51 % Low mid ~ -60 % Low price ~ -69 % Indication price Range Current stock price Company score 27,314 W 27,314 W 23,020 W 23,020 W 23,020 W 18,725 W Evaluation 31,609 W 31,609 W~ 27,314 W 47,250 W 44.7 18,725 W 18,725 W 14,430 W High price Normal 14,430 W 14,430 W 0 W Industrial name of the company The number of All industries Algorithm Industry ranking Total number of listed companies Algorithm company ranking Investment opinion Shipping Company 79 41 3,129 910 14,430원 18,725원 23,020원 27,314원 31,609원 High price 47,250원 -69% -60% -51% -42% -33% -80% -70% -60% -50% -40% -30% -20% -10% 0.% 0W 5,000W 10,000W 15,000W 20,000W 25,000W 30,000W 35,000W 40,000W 45,000W 50,000W Low price Low mid Mid High mid High price Indication price chart (Consolidated) Indication price hmm Gap hmm
- 2. [Price for scheduled purchasing] Arbitrarily made Algorithm stocks Trading Strategies (consolidated) 011200 Date Period Gap (Indication / stock) Color 2021-06-04 3 months Current stock price Evaluation Stock price rise probability score Investment opinion Prospective purchase amount 47,250 W High price 37.9 Normal 4,000,000 W Suggested Purchase Amount 1,191,358 W Number of stocks purchased 25 Indication price Range Buying / Selling Buying / Selling [Stocks] High price 31,609 W 31,609 W~ ~ 27,314 W -33 % 394,367 W 12 High mid 27,314 W 27,314 W ~ 23,020 W -42 % 502,654 W 18 Mid 23,020 W 23,020 W ~ 18,725 W -51 % 610,941 W 27 Low mid 18,725 W 18,725 W ~ 14,430 W -60 % 719,229 W 38 low price 14,430 W 14,430 W ~ 0 W -69 % 827,516 W 57 Stock price rise probability score A Sector 49.2 48.4 46.7 48.4 50.4 46.1 37.9 B Sector 56.7 37.5 53.8 48.4 16.7 44.6 Total average 2021.01.07 2021.02.04 2021.03.09 2021.04.06 2021.05.04 2021.06.03 52.9 43.0 50.2 30.8 33.5 45.4 8 % 26 % 2021.02.04 2021.03.09 2021.04.06 2021.05.04 2021.06.03 Total of increase rate Total score A Sector -2 % -4 % 4 % 4 % -9 % -8 % 44.0 B Sector -51 % 30 % -11 % -191 % 63 % Total average -23 % 14 % -63 % 49 48 47 48 50 46 57 38 54 48 17 45 53 43 50 31 34 45 0 10 20 30 40 50 60 2021.01.07 2021.02.04 2021.03.09 2021.04.06 2021.05.04 2021.06.03 Stock price rise probability score A sector B sector Total average -2% -4% 4% 4% -9% -51% 30% -11% -191% 63% -23% 14% -63% 8% 26% -250% -200% -150% -100% -50% 0% 50% 100% 2021.02.04 2021.03.09 2021.04.06 2021.05.04 2021.06.03 Increase rate of stock price rise A sector B sector Total average hmm
- 3. 정보와 완전 정보 결 투자판단 있습니 위배 무단으 숙지하 Compliance notice ① The information provided by The Algorithm Company Analysis Consulting is obtained through reliable data and information and The Algorithm Company Analysis Program (TACAP), but its accuracy or completeness are not guaranteed. Furthermore, it may change over time.Therefore, we are not legally responsible for the results of the data provided by The Algorithm Company Analysis Consulting because of information errors or omissions. ② The Algorithm Company Analysis Consulting and all the information provided on it site are reference materials for investment decisions and the final responsibility of investment is up to users utilizing this information. ③ The Algorithm Company Analysis Consulting and its site do not do anything that violates the related laws such as discretionary transaction. ④ Users can not reallocate and recycle the information provided by The Algorithm Company Analysis Consulting firm let alone the information provided by its Site. ⑤ Be sure to know about application period of this algorithm analysis report in order to improve its accuracy. Tel : 070 - 4667 - 5009 Email : tacac@tacac.co.kr Homepage : tacac.co.kr Blog : tacac.blog.me SERVICES M&A, IPO, RECOVER, CORPORATE RESTRUCTURING, MANAGEMENT OF TECHNOLOGY, BUSINESS STRATEGY, FAMILY BUSINESS Request : http://tacac.co.kr/?page_id=1374 ① Consulting is o The Algorithm accuracy or com change over tim results of the d Consulting bec ② information pr investment dec up ③ do anything th transaction. ④ The Algorithm information pr ⑤ analysis report