Celltrion Pharm 068760 Algorithm Investment Report
•
0 likes•71 views

This document provides financial and stock performance data for Celltrion Pharm over several periods from 2016-2019. It includes key metrics like sales, operating profit, net income, debt ratio, and stock price. It also provides the company's stock indication price range, the current stock price, and evaluation of the stock's probability to rise based on an analysis algorithm. Purchase amounts are suggested based on the stock's position within its indication price range.
![[Price for scheduled purchasing]
Arbitrarily made
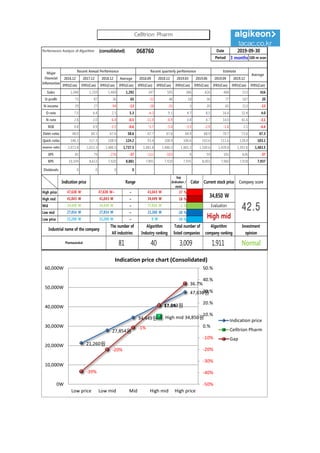
Algorithm stocks Trading Strategies (consolidated) 068760 Date
Period
Gap
(Indication /
stock)
Color
low price 21,260 W 21,260 W ~ 0 W -39 % 145,647 W 7
Low mid 27,854 W 27,854 W ~ 21,260 W -20 % 74,973 W 3
Mid 34,449 W 34,449 W ~ 27,854 W -1 % 4,299 W 0
High mid 41,043 W 41,043 W ~ 34,449 W 18 % -66,375 W -2
Suggested Purchase
Amount 373,492 W
Number of stocks
purchased 11
Indication price Range Buying / Selling Buying / Selling [Stocks]
High price 47,638 W 47,638 W~ ~ 41,043 W 37 % -137,049 W -3
2019-09-30
3 months
Current stock price Evaluation
Stock price rise
probability score
Investment opinion Prospective purchase amount
34,850 W High mid 39.2 Normal 1,500,000 W
40.1 46.2 36.9 12.5 37.9 49.4
2019.05.03 2019.06.03 2019.07.02 2019.07.30 2019.08.28 2019.09.27
Stock price rise
probability score
A Sector 46.8 43.6 46.7 43.8 47.5 50.4
39.2B Sector 33.3 48.8 27.1 43.8 28.3 48.3
Total average
2019.07.02 2019.07.30 2019.08.28 2019.09.27
Total of
increase rate
Total score
A Sector -7 % 7 % -7 % 8 % 6 %
-23 % 49.3B Sector 32 % -80 % 38 % -54 % 41 %
Total average 13 % -25 % -195 % 67 % 23 %
2019.06.03
47
44
47
44
48
50
33
49
27
44
28
48
40
46
37
13
38
49
0
10
20
30
40
50
60
2019.05.03 2019.06.03 2019.07.02 2019.07.30 2019.08.28 2019.09.27
Stock price rise probability score
A sector
B sector
Total average
-7%
7% -7%
8% 6%
32%
-80%
38%
-54%
41%
13%
-25%
-195%
67%
23%
-250%
-200%
-150%
-100%
-50%
0%
50%
100%
2019.06.03 2019.07.02 2019.07.30 2019.08.28 2019.09.27
Increase rate of stock price rise
A sector
B sector
Total average
Celltrion Pharm](data:image/gif;base64,R0lGODlhAQABAIAAAAAAAP///yH5BAEAAAAALAAAAAABAAEAAAIBRAA7)
Recommended
Recommended
More Related Content
What's hot
What's hot (20)
Similar to Celltrion Pharm 068760 Algorithm Investment Report
Similar to Celltrion Pharm 068760 Algorithm Investment Report (20)
More from 알고리즘 기업분석 컨설팅-알기컨,algikeon
More from 알고리즘 기업분석 컨설팅-알기컨,algikeon (20)
Recently uploaded
Recently uploaded (8)
Celltrion Pharm 068760 Algorithm Investment Report
- 1. Performance Analysis of Algorithm (consolidated) 068760 Date Period 3 months 100-m won 2016.12 2017.12 2018.12 Average 2018.09 2018.12 2019.03 2019.06 2019.09 2019.12 IFRS(Con) IFRS(Con) IFRS(Con) IFRS(Con) IFRS(Con) IFRS(Con) IFRS(Con) IFRS(Con) IFRS(Con) IFRS(Con) IFRS(Con) Sales 1,048 1,359 1,469 1,292 347 505 386 426 468 513 416 O-profit 73 87 36 65 -22 46 18 36 77 167 20 N-income 29 27 -94 -13 -38 -35 3 20 65 213 -13 O-rate 7.0 6.4 2.5 5.3 -6.3 9.1 4.7 8.5 16.6 32.4 4.0 N-rate 2.8 2.0 -6.4 -0.5 -11.0 -6.9 0.8 4.7 14.0 41.6 -3.1 ROE 0.8 0.9 -3.5 -0.6 -5.7 -5.4 -3.5 -2.9 -1.6 2.1 -4.4 Debt-ratio 48.0 60.1 67.6 58.6 67.7 67.6 64.9 68.9 70.7 72.6 67.3 Quick-ratio 146.3 117.3 108.9 124.2 93.4 108.9 106.6 103.6 111.6 128.0 103.1 reserve-ratio 2,072.8 1,653.3 1,486.5 1,737.5 1,481.8 1,486.5 1,465.3 1,500.6 1,439.8 1,392.6 1,483.5 EPS 85 79 -276 -37 -111 -103 9 59 192 626 -37 BPS 10,109 8,613 7,920 8,881 7,891 7,920 7,935 8,003 7,960 7,918 7,937 Dividends 0 0 0 0 Major Financial Information Recent Annual Performance Recent quarterly performance Estimate Average 2019-09-30 Gap (Indication / stock) Color High price ~ 37 % High mid ~ 18 % Mid ~ -1 % Low mid ~ -20 % Low price ~ -39 % Normal 21,260 W 21,260 W 0 W Industrial name of the company The number of All industries Algorithm Industry ranking Total number of listed companies Algorithm company ranking Investment opinion Pharmaceutical 81 40 3,009 1,911 41,043 W 41,043 W 34,449 W 34,449 W 34,449 W 27,854 W Evaluation 47,638 W 47,638 W~ 41,043 W 34,850 W 42.527,854 W 27,854 W 21,260 W High mid Indication price Range Current stock price Company score 21,260원 27,854원 34,449원 41,043원 47,638원 High mid 34,850원 -39% -20% -1% 17.8% 36.7% -50% -40% -30% -20% -10% 0.% 10.% 20.% 30.% 40.% 50.% 0W 10,000W 20,000W 30,000W 40,000W 50,000W 60,000W Low price Low mid Mid High mid High price Indication price chart (Consolidated) Indication price Celltrion Pharm Gap Celltrion Pharm
- 2. [Price for scheduled purchasing] Arbitrarily made Algorithm stocks Trading Strategies (consolidated) 068760 Date Period Gap (Indication / stock) Color low price 21,260 W 21,260 W ~ 0 W -39 % 145,647 W 7 Low mid 27,854 W 27,854 W ~ 21,260 W -20 % 74,973 W 3 Mid 34,449 W 34,449 W ~ 27,854 W -1 % 4,299 W 0 High mid 41,043 W 41,043 W ~ 34,449 W 18 % -66,375 W -2 Suggested Purchase Amount 373,492 W Number of stocks purchased 11 Indication price Range Buying / Selling Buying / Selling [Stocks] High price 47,638 W 47,638 W~ ~ 41,043 W 37 % -137,049 W -3 2019-09-30 3 months Current stock price Evaluation Stock price rise probability score Investment opinion Prospective purchase amount 34,850 W High mid 39.2 Normal 1,500,000 W 40.1 46.2 36.9 12.5 37.9 49.4 2019.05.03 2019.06.03 2019.07.02 2019.07.30 2019.08.28 2019.09.27 Stock price rise probability score A Sector 46.8 43.6 46.7 43.8 47.5 50.4 39.2B Sector 33.3 48.8 27.1 43.8 28.3 48.3 Total average 2019.07.02 2019.07.30 2019.08.28 2019.09.27 Total of increase rate Total score A Sector -7 % 7 % -7 % 8 % 6 % -23 % 49.3B Sector 32 % -80 % 38 % -54 % 41 % Total average 13 % -25 % -195 % 67 % 23 % 2019.06.03 47 44 47 44 48 50 33 49 27 44 28 48 40 46 37 13 38 49 0 10 20 30 40 50 60 2019.05.03 2019.06.03 2019.07.02 2019.07.30 2019.08.28 2019.09.27 Stock price rise probability score A sector B sector Total average -7% 7% -7% 8% 6% 32% -80% 38% -54% 41% 13% -25% -195% 67% 23% -250% -200% -150% -100% -50% 0% 50% 100% 2019.06.03 2019.07.02 2019.07.30 2019.08.28 2019.09.27 Increase rate of stock price rise A sector B sector Total average Celltrion Pharm
- 3. 정보와 완전 정보 결 투자판단 있습니 위배 무단으 숙지하 Compliance notice ① The information provided by The Algorithm Company Analysis Consulting is obtained through reliable data and information and The Algorithm Company Analysis Program (TACAP), but its accuracy or completeness are not guaranteed. Furthermore, it may change over time.Therefore, we are not legally responsible for the results of the data provided by The Algorithm Company Analysis Consulting because of information errors or omissions. ② The Algorithm Company Analysis Consulting and all the information provided on it site are reference materials for investment decisions and the final responsibility of investment is up to users utilizing this information. ③ The Algorithm Company Analysis Consulting and its site do not do anything that violates the related laws such as discretionary transaction. ④ Users can not reallocate and recycle the information provided by The Algorithm Company Analysis Consulting firm let alone the information provided by its Site. ⑤ Be sure to know about application period of this algorithm analysis report in order to improve its accuracy. Tel : 070 - 4667 - 5009 Email : tacac@tacac.co.kr Homepage : tacac.co.kr Blog : tacac.blog.me SERVICES M&A, IPO, RECOVER, CORPORATE RESTRUCTURING, MANAGEMENT OF TECHNOLOGY, BUSINESS STRATEGY, FAMILY BUSINESS Request : http://tacac.co.kr/?page_id=1374 ① Consulting The Algori accuracy o change ove results of Consulting ② informatio investmen up ③ do anythin transaction ④ The Algori informatio ⑤ analysis re