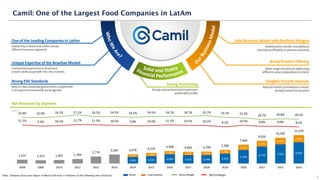
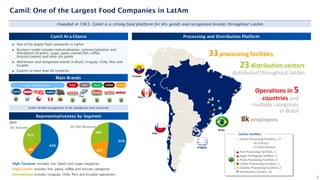
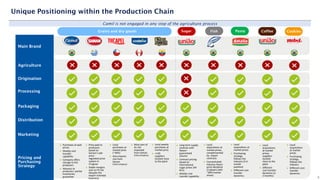
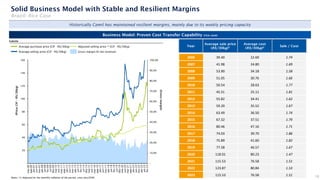
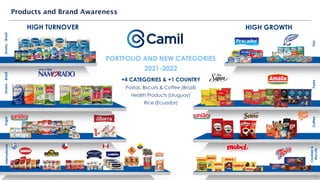
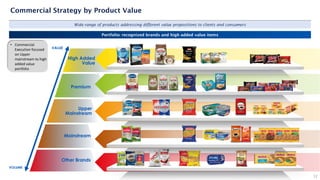
2. Financial data is presented in accordance with the International Financial Reporting Standards and represents the Company's consolidated results in
millions of reais (R$), unless otherwise indicated. The Company's fiscal year begins in March and ends in February of the following year (inclusive). The
results presented here include recent transaction data as of their conclusion, except when specified.
This presentation may contain forward-looking statements that are inherently difficult to predict. Actual results could differ materially for a variety of
reasons. Forward-looking statements speak only as of the date they are made, and the Company does not assume any obligation to update them in
light of new information or future developments.
This material is published solely for informational purposes and should not be construed as a solicitation or an offer to buy or sell any securities or
related financial instruments. Likewise, it does not provide, and should not be treated as providing, investment advice. It has no regard for the specific
investment objectives, financial situation, or particular needs of any recipient. No representation or warranty, either express or implied, is provided
regarding the accuracy, completeness, or reliability of the information contained herein. Recipients should not consider it a substitute for the exercise
of their own judgment.
This presentation contains summarized information that should not be considered complete. Certain percentages and other amounts included in this
document have been rounded to facilitate its presentation. Therefore, numbers presented as totals in some tables may not represent the arithmetic
sum of the numbers that precede them and may differ from those presented in the financial statements. Operational data is not audited, as it consists
of measures that are not recognized by IFRS or other accounting standards. Neither this presentation nor anything contained herein should create the
basis for any contract or commitment.
All information contained here is subject to adjustments and revisions without notice. By creating this presentation, neither the Company nor any of its
affiliated companies, directors, executives, or employees assume any obligation to provide the receiver access to any additional information, update
this presentation or any information, or correct any inaccuracy in any of this information. This presentation does not contain all the relevant
information about the Company.
Disclaimer
2
3. I. Camil Alimentos S.A.
II. Categories Overview
III. Capital Markets & Transactions
IV.ESG
Table of Contents
3
5. Camil: One of the Largest Food Companies in LatAm
5
W
h
o
W
e
A
r
e
?
Solid and Stable
Financial Performance
O
u
r
B
u
s
i
n
e
s
s
M
o
d
e
l
One of the Leading Companies in LatAm
Leadershipin Braziland LatAm across
differentbusinesssegments
Unique Expertise of the Brazilian Market
Unmatchedexperiencein Braziland
provenabilityto growth intonew markets
Strong ESG Standards
Best-in-classcorporategovernancecoupledwith
a strongenvironmental& socialagenda
Solid Business Model with Resilient Margins
Weeklyprice transferandabilityto
maintainprofitabilityinadverse scenarios
Broad Product Offering
Widerange of productsaddressing
differentvaluepropositionsto clients
Tangible Growth Avenues
Naturalmarketconsolidatorin Brazil,
alreadytested intopractice
(R$mn)
Net Revenues by Segment
Strong Positioning
Strongcashpositionandinvestment
gradedebt profile
Note: Company fiscal year begins in March and ends in February of the following year (inclusive)
2,601 2,935 3,683 3,331 3,346 3,915
5,354
6,720 7,591 8,392
1,075 1,294
1,265 1,332 1,403
1,481
2,112
2,296
2,614
2,858
1,513 1,313 1,407 1,784
2,776
3,582 3,676 4,229
4,948 4,663 4,749 5,396
7,466
9,016
10,205
11,250
22.9% 22.8% 24.2% 27.1% 24.1% 24.5% 23.2% 24.5% 24.7% 24.7% 25.7% 23.2% 22.2% 19.7% 20.8% 20.2%
11.1% 9.4% 10.1% 11.7% 11.3% 10.5% 9.8% 10.0% 11.1% 10.5% 10.2% 8.2% 10.5% 9.0% 9.0% 8.1%
2008 2009 2010 2011 2012 2013 2014 2015 2016 2017 2018 2019 2020 2021 2022 2023
6. 61%
8%
31%
(%) Volume
51%
20%
29%
(%) Net Revenue
Camil At-a-Glance
Founded in 1963, Camil is a strong food platform for dry goods and recognized brands throughout LatAm
◼ One of the largest food companies in LatAm
◼ Business model includes industrialization, commercialization and
distribution of grains, sugar, pasta, canned fish, coffee,
biscuits/cookies and other dry goods
◼ Well-known and recognized brands in Brazil, Uruguay, Chile, Peru and
Ecuador
◼ Exports to more than 60 countries
Representativeness by Segment
Camil: One of the Largest Food Companies in LatAm
High Turnover includes rice, beans and sugar categories
High Growth includes fish, pasta, coffee and biscuits categories
International includes Uruguay, Chile, Peru and Ecuador operations
Main Brands
Sugar Fish Pasta Coffee
Iconic brand recognition in all categories and countries
Cookies
Grains and Dry Goods
2023
Processing and Distribution Platform
Uruguay
Chile
Peru
Brazil
Ecuador
33 processing facilities
23 distribution centers
distributed throughout LatAm
Operations in 5
countries and
multiple categories
in Brazil
8k employees
Grains Processing Facilities: 27
- 10 in Brazil
- 17 International
Fish Processing Facilities: 1
Sugar Packaging Facilities: 1
Pasta Processing Facilities: 1
Coffee Processing Facilities: 1
Cookies Processing Facilities: 2
Distribution Centers: 23
Camil’s Facilities
6
7. 60’s: Foundation 80’s: Professionalization and Organic Expansion 2000’s: Acquisitions / International Expansion 2017-2022: IPO + Recent Transactions
Over the past 60 years, Camil has expanded its portfolio of brands in LatAm, proven its capacity of successfully identifying, acquiring and integrating strategic acquisitions
Unique Expertise in the LatAm Market
Foundation, in the
city of Itaqui-RS
Pioneer in distributing
packaged rice (migration
from rice in bulk)
Inauguration of the
distribution center in SP
Beans
commercialization
Acquisition of SAMAN
Brazil in Pernambuco
Logistics expansion: new
subsidiaries in North and
Northeast regions
Acquisition of
Saman in Uruguay
Acquisition of Rio
Grande plant (Brazil)
Acquisition of
Tucapel (Chile)
Acquisition of SLC
Alimentos
Sale of La Loma
(Argentina)
Acquisition of Bom
Maranhense (Brazil)
Camil’s IPO (B3)
Acquisition of canned
fish (Brazil) and
Costeño (Peru)
Acquisition of sugar
category (Brazil)
Acquisition of
Carreteiro (Brazil) and
La Loma (Argentina)
Warburg Pincus
divestment (Buyback)
2001
2002
2005
2007
2008
2009
2022
1963
1987
2014
2017 2018 2019 2021
2010
2011
2012
2013
1974
1975
Acquisition of
Camaquã plant in Rio
Grande do Sul
Acquisition of
Paisana (Peru)
•Santa Amália (Brazil - Pasta)
•Seleto brand (Brazil - Coffee)
•Café Bom Dia (Brazil - Coffee)
•Dajahu (Equador)
•Silcom S.A. (Uruguai)
7
•Launch: Coffee business
(União brand)
Mabel & Toddy – biscuits
and Cookies
8. Unique Positioning within the Production Chain
Camil is not engaged in any step of the agriculture process
Main Brand
Agriculture
Origination
Processing
Packaging
Distribution
Marketing
Pricing and
Purchasing
Strategy
Grains and dry goods Sugar Fish Pasta
◼ Purchases at spot
prices
◼ Weekly cost
transfer
capability
◼ Company offers
storage to the
producers
◼ Advance to
producers: partial
inventories
guarantee
◼ Price paid to
producers
based on
Saman’s sale
price -
regulated price
system in
Uruguay
◼ Stable margins
and no FX risk
(despite the
export-oriented
business)
◼ Local
purchases at
market price
(~50%)
◼ Also imports
rice from
Saman
(intercompany)
◼ Most part of
its rice
imported
from Saman
(intercompany)
◼ Long term supply
contract with
Raízen:
guaranteed
volume
◼ Contract pricing
based on
international
sugar prices (NY
#11)
◼ Weekly cost
transfer capability
◼ Local
acquisitions at
market prices,
complemented
by import
contracts
◼ Concentrated
industry favors
price discipline
(2 players with
~90% market
share)
Coffee
◼ Local weekly
purchases at
market price
◼ >130
suppliers
located close
to the plant
◼ Local
acquisitions at
market prices
◼ Purchasing
strategy
follows the
industry (3-4
month
position)
◼ Different cost
transfer
dynamics
◼ Local
acquisitions
at market
prices:
suppliers
located
close to the
plant
◼ Different
cost transfer
dynamics (1-
2 months)
8
Cookies
◼ Local
acquisitions
at market
prices
◼ Purchasing
strategy
follows the
industry
◼ Different cost
transfer
dynamics
9. 1,196 1,169 1,229 1,210 1,236 1,351 1,403 1,480 1,335 1,342
32 37 40 36 35
39 37
59
140 174
534 586
706 732 630
634 678 627 703 675
454 473 505 564
852
1,300
1,883 1,792
1,974 1,978 1,901
2,024 2,115 2,166 2,178 2,192
4% 7% 12%
51% 53%
35%
2% 10% 0% -4% 6% 5% 2% 1% 1%
2008 2009 2010 2011 2012 2013 2014 2015 2016 2017 2018 2019 2020 2021 2022 2023
High Turnover High Growth International
2,601 2,935 3,683 3,331 3,346 3,915
5,354
6,726 7,591 8,392
1,075 1,294
1,265 1,332 1,403
1,481
2,112
2,290
2,614
2,858
1,513 1,313 1,407 1,784
2,776
3,582 3,676 4,229
4,948 4,663 4,749
5,396
7,466
9,016
10,206
11,250
-13.2%
7.1%
26.8%
55.6%
29.0%
2.6% 15.0% 17.0%
-5.8% 1.8% 13.6%
38.4%
20.8% 13.2% 10.2%
2008 2009 2010 2011 2012 2013 2014 2015 2016 2017 2018 2019 2020 2021 2022 2023
Brazil International Growth Rate
9.1%
5.9%
10.9%
6.7%
8.4%
4.3%
2.2%
-4.3%
-6.3%
2.0% 2.3%
1.3% 1.2% 1.4% 1.0%
1.6%
5.1%
-0.1%
7.5%
4.0%
1.9%
3.0%
0.5%
-3.5%
-3.3%
1.3% 1.8%
1.2%
-3.3%
4.8%
3.0% 2.9%
2008 2009 2010 2011 2012 2013 2014 2015 2016 2017 2018 2019 2020 2021 2022 2023
Retail Sales Total GDP
For over 15 years, Camil has posted solid operational and profitable results, even with a slowdown in the Brazilian economy
9
Solid Business Model with Stable and Resilient Margins
Notes: Company fiscal year begins in March and ends in February of the following year (inclusive); (1) IBGE
Volume and Growth (mn ton, %)
EBITDA, Gross Margin and EBITDA Margin (R$mn, %)
Net Revenues by Segment (R$mn)
Camil continue to grow in volumes and revenues,
despite years in Brazil with a GDP decrease
Brazil: GDP and Retail Sales¹ (% growth, real terms)
CAGR2008-2023 11.9%
CAGR2008-2023 14.3%
CAGR2008-2023 11.1%
169 123 142
209
315
375 361
423
547
490 483 442
787 810
920 914
22.9% 22.8% 24.2% 27.1% 24.1% 24.5% 23.2% 24.5% 24.7% 24.7% 25.7% 23.2% 22.2%
19.6% 20.8% 20.2%
11.1% 9.4% 10.1% 11.7% 11.3% 10.5% 9.8% 10.0% 11.1% 10.5% 10.2% 8.2% 10.5% 9.0% 9.0% 8.1%
2008 2009 2010 2011 2012 2013 2014 2015 2016 2017 2018 2019 2020 2021 2022 2023
EBITDA Gross Margin EBITDA Margin
10. Adjusted selling price (1) (CIF - R$/30kg)
Notes: (1) Adjusted by the monthly inflation of the period, since Jan/2006
(Gross
margin)
Average sale price
(R$/30kg)2
Average cost
(R$/30kg)2 Sale / Cost
Year
Subtitle
Average purchase price (CIF - R$/30kg)
Gross margin (% net revenue)
Average selling price (CIF - R$/30kg)
Historically Camil has maintained resilient margins, mainly due to its weekly pricing capacity
Business Model: Proven Cost Transfer Capability (rice case)
Solid Business Model with Stable and Resilient Margins
Brazil: Rice Case
(Price:
CIF
–
R$/30kg)
10
2006 39.40 22.69 1.74
2007 41.98 24.80 1.69
2008 53.90 34.18 1.58
2009 51.05 30.76 1.66
2010 50.54 28.63 1.77
2011 45.51 25.11 1.81
2012 55.82 34.41 1.62
2013 59.20 35.52 1.67
2014 63.49 36.50 1.74
2015 67.32 37.51 1.79
2016 80.46 47.16 1.71
2017 74.03 39.70 1.86
2018 75.89 41.60 1.82
2019 77.58 46.57 1.67
2020 118.01 80.23 1.47
2021 115.53 76.58 1.51
2022 123.87 80.84 1.53
2023 115.53 76.58 1.51
–
10,0%
20,0%
30,0%
40,0%
50,0%
60,0%
70,0%
80,0%
90,0%
100,0%
-
20
40
60
80
100
120
140
160
mar-06
ago-06
jan-07
jun-07
nov-07
abr-08
set-08
fev-09
jul-09
dez-09
mai-10
out-10
mar-11
ago-11
jan-12
jun-12
nov-12
abr-13
set-13
fev-14
jul-14
dez-14
mai-15
out-15
mar-16
ago-16
jan-17
jun-17
nov-17
abr-18
set-18
fev-19
jul-19
dez-19
mai-20
out-20
mar-21
ago-21
jan-22
jun-22
nov-22
abr-23
set-23
fev-24
13. Main Competitor
Unique Footprint
◼ Points of sale reaching a big part
of the population in Brazil –
specially in SP
◼ Wide presence across all States of
Brazil
Pricing Power
◼ "Brand of sugar": higher prices
compared to the main competitors
Market Leadership
◼ Absolute Leadership with 82% of
Top-of-Mind¹
◼ Total Company refined sugar
brands have ~29%² market share
Market Share
13
✓ 115
100
Sugar price³
1º
+5%
105
100
Camil Others
Rice Strategy
◼ Replicating the sugar model from
commodity to brand
◼ Focus on branding and premium
price strategy
Rice price³
Others
Iconic Brand Recognition and Premium Prices
Sugar Successful Case from Commodity to Brand
+15%
29%
União: Brand of strong emotional bond, preferred by consumers and with greater perception of value
Notes: (1) Top of Mind Camil Ipsos; (2) Scanntech; (3) Price Index Nielsen
(launch in 1S22)
Coffee
✓
✓
✓
14. 89 vs. 58 (#2)
Brand Awareness
Complementary product portfolio composed of strong and most recognized brands by consumers
M A I N B R A N D S - B r a z i l
I N T E R N AT I O N A L B R A N D S
BHT - Brand Health Tracking¹
Bought the
Product before
Recognition 99 vs. 94 (#2)
87 vs. 64 (#2)
96 vs. 88 (#2)
90 vs. 61 (#2)
100 vs. 91 (#2)
Sardines Tuna
88 vs. 91 (#1)
98 vs. 98 (#1)
72 vs. 85 (#1)
92 vs. 96 (#1)
December, 2023
Brazil
1st 1st
1st
Market Share² ³
1) IPSOS Institution; 2) Scanntech; 3) Uruguay: Informe comission sectorial de arroz; Chile: Nielsen Scantrack; Peru:
Lock&Asociados, Canal Supermercados; Equador: company. 14
Brand Recognition
•Folha de São Paulo The Best of the Gastronomy Coqueiro (Tuna) 1st; Camil (Rice and
beans) in 1st; União (Sugar) 1st
•Folha de São Paulo Top of Mind Award Coqueiro Sardines – 1st
9% (aged rice)
48% 30% 29%
1st
2nd
1nd
•União: registered as Alto
Renome (highly renowned)
brand
2nd 2nd
Rice Sugar
Beans
1st
9%
1st
Rice
4%
3rd
Beans
29%
1st
Sugar
38%
2nd
Sardine
2nd
29%
Tuna
4th
6% Brazil (#4);
30% MG (#1)
Pasta
2% Brazil;
4% GSP/GRJ (#4)
Coffee
3%
Biscuits
4th
9th
,
15. Own Sales Force
Wholesale Retailers
Key Accounts
Outsourced Sales Force
Distributor & Others
#
Indicates the
representativeness
of direct points of
sale by region in
Brazil
17%
13%
44%
26%
% Sales (tons)
15
Wholesale Stores / Retailers
Brazil Key Accounts
A LatAm successful case of a strong distribution network favoring the business expansion to new segments
Wide Distribution Network
Equador
Uruguay
94% of sales made by the
company’s own sales
force and 6% from
distributors (canned fish)
Brazil
Chile
Brazil: % Sales (ton)
Peru
33%
27%
33%
52%
27%
22% Retail
WholeSale
Others
9%
48%
8%
36%
Retail
Wholesale
Other
Distributor
41%
42%
7%
10% Retail
Wholesale
Other
Distributor
6%
5%
30%
58%
7%
Small Retail
Wholesale
Key Accounts
Distributor
17. 456 454 473 505
560
817
1,267
1,196 1,169
1,229 1,210 1,236
1,351
1,401
1,478
1,335 1,342
0
200
400
600
800
1000
1200
1400
1600
2007 2008 2009 2010 2011 2012 2013 2014 2015 2016 2017 2018 2019 2020 2021 2022 2023
-
50.0
100.0
150.0
200.0
250.0
300.0
350.0
400.0
-
1.0
2.0
3.0
4.0
5.0
6.0
7.0
1Q17
2Q17
3Q17
4Q17
1Q18
2Q18
3Q18
4Q18
1Q19
2Q19
3Q19
4Q19
1Q20
2Q20
3Q20
4Q20
1Q21
2Q21
3Q21
4Q21
1Q22
2Q22
3Q22
4Q22
1Q23
2Q23
3Q23
4Q23
Camil's Gross Price Rice - Mkt. Price Beans - Mkt. Price Sugar - Mkt. Price
17
Brazil Food Segment | High Turnover
High turnover: Grains and Sugar in Brazil
Substantial Historical Growth in a Fragmented Industry - Consolidation Opportunity
CAGR 08-23: +7.5%
Through Organic and
Inorganic Growth, Camil is an
Undisputed Market Leader in
Rice, Beans and Sugar in Brazil
Main Brands¹ Camil Historical Annual Volume (k ton)
Camil’s Gross Price vs. Market Prices (R$/kg) Camil Historical Quarterly Volume (k ton)
• Camil - Rice: #1 Rice Brand in Brazil, with 9%
market share
• Camil - Beans: #3 Beans Brand in Brazil, with
4% market share
• União - Sugar: #1 Refined Sugar Brand in
Brazil, with 29% market share and a 15%
premium prices
• Other brands: +10 value priced brands to
meet the demand of consumers seeking for
lower prices and regional brands
High turnover: weekly
cost transfer capability
Mkt.
Prices
Camil’s
Gross
Price
Notes: (1) Scanntech (2) CEPEA; rice indicator Esalq/Senar-RS 50kg; Agrolink; beans indicator Sc 60kg; CEPEA; Cristal Sugar indicator Esalq-SP 50kg.
2
0
50,000
100,000
150,000
200,000
250,000
300,000
350,000
400,000
450,000
1Q17
2Q17
3Q17
4Q17
1Q18
2Q18
3Q18
4Q18
1Q19
2Q19
3Q19
4Q19
1Q20
2Q20
3Q20
4Q20
1Q21
2Q21
3Q21
4Q21
1Q22
2Q22
3Q22
4Q22
1Q23
2Q23
3Q23
4Q23
18. 4
34 33 32 37 40 36 35 39 37
60
140
174
0
20
40
60
80
100
120
140
160
180
200
2011 2012 2013 2014 2015 2016 2017 2018 2019 2020 2021 2022 2023
0
500
1000
1500
2000
-
5.00
10.00
15.00
20.00
25.00
1Q17
2Q17
3Q17
4Q17
1Q18
2Q18
3Q18
4Q18
1Q19
2Q19
3Q19
4Q19
1Q20
2Q20
3Q20
4Q20
1Q21
2Q21
3Q21
4Q21
1Q22
2Q22
3Q22
4Q22
1Q23
2Q23
3Q23
4Q23
High Growth Gross Price Wheat - Mkt. Price Coffee - Mkt. Price
18
Brazil Food Segment | High Growth
High Growth: canned fish, pasta, biscuits/cookies and coffee in Brazil
High Growth Opportunity with
well-recognized brands and a portfolio
with value added categories in Brazil
CAGR 11-23’: +37.0%
Mains Brands¹ Camil Historical Annual Volume (k ton)
Camil’s Gross Price vs Market Prices (R$/kg) Camil Historical Quarterly Volume (k ton)
• Canned Fish: Coqueiro. #2 player, with 38% market share in
sardines and 29% in Tuna
• Pasta: Santa Amalia. #1 player in pasta in Minas Gerais region,
with a 30% market share (#4 player in Brazil)
• Coffee: União. Launch in April/2022, 4% market share in São
Paulo/Rio de Janeiro region.
• Cookies and Biscuits: Mabel for biscuits and Toddy for
cookies. Acquisition in November/2022, high growth rate in
operation since the conclusion, with 3% market share in Brazil
Active price dynamics, with
different strategies by
category
Historical quarterly sales seasonality
impacted by the canned fish; and
growth in 2021-2022 impacted by the
acquisitions (pasta, coffee, biscuits)
Notes: (1) Scanntech (2) CEPEA; Esalq/Senar - Wheat indicator; CEPEA Esalq - Arabica Coffee Indicator; the chart considers the market prices of wheat from 3Q21 and coffee from 2Q22, when the company entered those segments.
2
0
5,000
10,000
15,000
20,000
25,000
30,000
35,000
40,000
45,000
50,000
1Q17
2Q17
3Q17
4Q17
1Q18
2Q18
3Q18
4Q18
1Q19
2Q19
3Q19
4Q19
1Q20
2Q20
3Q20
4Q20
1Q21
2Q21
3Q21
4Q21
1Q22
2Q22
3Q22
4Q22
1Q23
2Q23
3Q23
4Q23
Mkt.
Prices
Camil’s
Gross
Price
20. Brazil – RICE1 & 2
#1 9%
#2 Player 2 4%
#3 Player 3 3%
Consolidation of the brazilian grains market coupled with new categories and geographical expansion in LatAm
Acquisitions and Tangible Growth Opportunities
Notes: (1) Market shares referring to total Camil Company brands; (2) Scanntech
Consolidation: Grains in Brazil New Categories and New Products
New Geographies: LatAm
Brazil – BEANS1 & 2
#1 Player 1 6%
#2 Player 2 4%
#3 4%
Rice Beans
1st
2nd
Camil's wide distribution network enables synergies in new categories in Brazil
New geographies and new categories in LatAm
Chile
Ready for new
categories
Regions with focus on expansion
New markets
IV III
II
I
V
40%
8%
5%
8%
13%
11%
6%
19%
22%
16%
VII
1% 12%
VI
2% 13%
% rice market share1 & 2 - Camil
% rice consumption by region
IV III
II
I
V
25%
6%
1%
1%
7%
15%
11%
14%
24%
17%
VII
1% 7%
VI
2% 10%
% beans market share1 & 2 - Camil
% beans consumption by region
20
Big growth opportunities in dry goods
market in Brazil (logistics, sales and
fiscal synergies with current operations)
…and new added value products to be
developed in actual categories
Wheat Business
Coffee
Santa Amália’s (pasta) leadership in MG and Mabel strong presence in GO:
opportunity to grow and integrate other categories in Brazil
Uruguay: new business
opportunities, as Silcom in
Healthy Goods (local market)
Chile: ready to integrate new
categories
Peru: opportunity to grow on
packaged rice
New Markets: Colombia,
Argentina, Mexico
22. 1998 - 2006 2011 - 2016
Private
Equity
Private Equity History
1998 – 1st Private Equity: TCW
(acquisition of cooperative’s part. 50%)
2006 – TCW divestment
2011 – Gávea’s investment (31.75%)
2016 – Gávea’s divestment and Warburg
Pincus investment (same PM)
2017 – IPO and Warburg Pincus partial
divestment (23% sale, remaining a 9%
stake)
2019 – Warburg Pincus total divestment
(Partially via Camil Repurchase Program)
22
1998 - 2010 2011 - 2016 2017 - 2022
Acquisitions
2001 – SAMAN Brazil in Pernambuco
2002 – Camaquã Plant (Brazil)
2007 – Saman (Uruguay)
2009 – Tucapel (Chile)
2010 - BB Mendes (Brazil)
2011 – Pescador and Coqueiro brands
(Canned Fish – Brazil)
2011 – Costeño (Peru)
2012 – União and Da Barra brands
(Sugar - Brazil)
2013 – Carreteiro (Brazil)
2013 – La Loma (Argentina)
2014 – Paisana (Peru)
2018 – SLC Alimentos (Brazil)
2018 – Sale of La Loma (Argentina)
2019 - Warburg Pincus divestment (Buyback)
2021 – International: Acquisition in
Ecuador (Dajahu) and Silcom (Uruguay)
2021 – Brazil: Acquisition of pasta business
in Brazil (Santa Amalia), coffee brands and
coffee operation in Brazil (Seleto and Café
Bom Dia + launch of União)
2022 – Brazil: Acquisition of Mabel and
licensing of Toddy Cookies
M&A
(sold in 2018)
(Ecuador)
(Pasta- Brazil)
(Coffee - Brazil)
Solid Track Record of Successful Transactions
Camil’s M&A history reflects its ability to find and deliver new opportunities and synergies
(Grains- Brazil)
(Uruguay)
2017
(Cookies - Brazil)
23. 23
Recent Transactions 2021-2022 | Summary
Acquisitions in line with the Company's expansion strategy and an important step forward in new markets
Brands
Notes: (1) Considering FX at the time of the announcement
2021 2022
Acquisitions Total
Amount & Closing Date
Investments Thesis
Acquisition
Silcom
(Uruguay)
Dejahu
(Ecuador)
Santa Amália
(Brazil)
Seleto Brand
(Brazil)
Café Bom Dia
(Brazil)
Mabel
(Brazil)
• Healthy
products
• Expansion in
the local market
(Uruguay)
• Entry into the
Pasta segment
in Brazil;
• Leadership in
MG region
• Entry into the
Ecuadorian
Market
• Leadership
position
• Brand acquisition
to support
Camil’s launch in
the Coffee
Segment
• Investment in
Café Bom Dia
brand and its
operations in
Minas Gerais
• Mabel
Acquisition and
licensing of
Toddy brand for
Cookies.
Not Disclosed
(mar/22)
R$220 million
(sep/21)
R$410 million
(oct/21)
Not Disclosed
(oct/21)
63 million (dec/21) R$177 million
(nov/22)
24. 8 Buyback Programs
Substantial Growth in Number of Investors to 37k on
Feb.24 from 2.0k Investors on Nov.17
24
2017: Camil’s IPO
Camil successfully completed its Initial Public Offering on September 2017
Shareholder Structure
Corporate Governance
Shareholder’s Profile
Camil is listed on B3’s
Novo Mercado
segment, the highest
level of corporate
governance
Investors
Breakdown
# of Investors# ON (mn)
%
ON
Controlling holders & Related
Parties
5 255 73%
Institutional 116 71 21%
Retail/Ind. Holders 36,600 23 7%
Total 36,730 350 100%
49%
51%
% number of investors
Feb, 2024
Camil
Investimentos¹
Free Float
65.7% 4.8%
Management and
Related Parties
27.0%
Treasury Shares
2.6%
Notes: 1) Camil Investimentos represents Quartiero’s family ownership (does not include individual ownership, included on
Management and Related Parties)
Share Buyback
+69 million
ON shares acquired and
+R$535 million
Invested in share buyback
+60 million
ON shares canceled
350¹
million ON
IPO - 2017 Feb - 2024
-15%
410
million ON
(8th Ongoing)
• Common voting shares only
• 100% Tag along
• 50% of independent Board Members
• Minimum Free Float of 25%
• OPA by fair value
• Minimum dividend/JCP of 25% of the net profit
(in compliance with Law No 6.404)
• Board: 9 members, 66% independent
(2 women - certified by WOB - Women on Board)
350mn shares
Feb, 2024
Feb, 2024
Shares in Treasury
2.6%
Camil
Investimentos
70%
Free
Float
27%
25. 25
Debt Issuances
Emissions 8th Debenture (CRA) 9th Debenture 10th Debenture 11th Debenture 12th Debenture (CRA) 13th Debenture (CRA)
Emission Date Apr/2019 Sep/2020 May/2021 Nov/2021 Jun/2023 Nov/2023
Emission 8th Deb. Issuance/CRA 9th Deb. Issuance 10th Deb. Issuance 11th Deb. Issuance 12th Deb. Issuance/CRA 13th Deb. Issuance/CRA
Securitization
Company
Eco Securitizadora - - - Eco Securitizadora Eco Securitizadora
Total Amount R$600 million R$350 million R$600 million R$650 million R$625 million R$650 million
Cost / serie
1st: 98% CDI p.a.
2nd: 101% CDI p.a.
Single:
CDI +2.7% p.a.
Single:
CDI +1.7% p.a.
1st
: CDI+1.55% p.a.
2nd
:CDI+1.55% p.a.
Single:
CDI+0,9% p.a.
1st
: CDI+0.65% a.a.
2nd
: IPCA+6,34% a.a
3rd
: IPCA+6,52% a.a
Amortization
Bullet - Series:
1st: 4 years (Apr/23) - settled
2nd: 6 years (Apr/25)
2 amortizations on
4th year and 5th year
Bullet
3 years (May/2024)
2 amortizations and 7-year
maturity
Bullet
2.5 year (Dec/2025)
1st
: Bullet
2nd
: Nov.2029 & Nov.2030
3rd
: Nov.2031, Nov.2032 & Nov.
2033
Interest Semester Semester Semester Semester Semester Semester
Financial Covenant Net Debt/EBITDA LTM <3.5x
Net Debt/EBITDA LTM <3.5x (up
to 4.0x after the 8th Deb. Maturity)
Net Debt/EBITDA LTM <3.5x (up
to 4.0x after the 8th Deb. Maturity)
Net Debt/EBITDA LTM <3.5x (up
to 4.0x after the 8th Deb. Maturity)
Net Debt/EBITDA LTM <3.5x (up
to 4.0x after the 8th Deb. Maturity)
Net Debt/EBITDA LTM <3.5x (up
to 4.0x after the 8th Deb. Maturity)
Liability Management on amortization profile schedule
National: Br AA+ (stable)
Agribusiness Receivables Certificate (CRA)
Debt Evolution Rating
Amortization Schedule
1,680 1,698
666 490 635
349
2024 2025 2026 2027 2028 After Feb/29
571
1,032 1,033 1,080
1,634
2,743 2,671
1.2x
2.1x 2.3x
1.4x
2,0x
3.0x 2.9x
4Q17 4Q18 4Q19 4Q20 4Q21 4Q22 4Q23
Net Debt Net Debt/EBITDA LTM
Covenant: 3,5x
27. Governance: Statutory Directors, Councils and Committees
Jairo Quartiero
(Chairman)
Rodrigo
Colmonero
(Founder & CEO
of Gringo and
Partner at Neo
Investimentos)
Thiago
Quartiero
(Camil
Investimentos,
Tzar and Q4)
Jacques
Quartiero
(Camil
Investimentos
and Q4)
José Fay
(Former Board Member at
J.Macedo & former CEO of
BRF)
Carlos Júlio
(Former CEO of
Tecnisa, HSM,
Polaroid. Board
member at Aramis,
Katz and TV1.Curator
Training at Startse
Advisors)
Founding Family
Independent Members
Camil is listed in Novo Mercado, B3’s highest standard of Corporate Governance
✓ 2-year term, re-election allowed
✓Current terms end in June/2024
✓9 members, 66% independent members (2 women)
✓Certified by the presence of at least two women on the
board by WOB
Fiscal Council
✓Formed by 6 members, 3 effective and 3 alternates
✓ 1Y Term (June/2024)
Audit Committee
✓Formed by 3 effective members
✓2Y Term (June/2024)
Finance, Investments and Risk Committee
✓Formed by 3 effective members
✓2Y Term (June/2024)
Strategy, Innovation, Brands and Market Committee
✓Formed by 5 effective members
✓2Y Term (June/2024)
Personnel Management Committee
✓ Formed by 4 effective members
✓2Y Term (June/2024)
ESG and Ethics Committee
✓Formed by 3 effective members
✓2Y Term (June/2024)
Piero
Minardi
(Warburg
Pincus, board
member of GPS,
America Net,
Eleva Educação)
Sandra Montes
(Former CMO at
Olist, Ex CMO of
Rappi, OLX and
Electrolux)
Cláudia Elisa
(Board Member at
IBGC and Chairman
of Cassol Group, ex-
member of Arezzo,
TOTVS and Roldão
Atacadista)
Luciano Quartiero
CEO
Flavio Vargas, CFA
CFO and IR Director
31 31
Experience Education
7 27
Experience Education
Statutory Directors
2 C-level statutory directors
✓ 2Y Term (June/2024)
Years of Experience in Camil
Years of Experience in the market
Councils and Committees Board of Directors
28. Recipe:
Commitment to
mitigate E&S risks
the Company’s
business and
strategy
Preparation
Method: governance
that encourages the
creation of ESG
practices throughout
the organization
Ingredients:
Integration of ESG
through Working
Groups, nurturing
Camil's ESG
commitment
ESG commitment:
1Y goals linked to
all directors
variable
compensation
ESG and
Ethics
Committee
Internal
ESG
Committee
Working
Groups
1Y ESG
Goals
Integration of best practices into the business management and development strategy, focused in sustainable growth
ESG Governance
28
Created in January 2021
Support the Board of Directors
on social, environmental,
integrity and Governance
matters
Formed by 3 members (1
independent member)
Strategic planning also includes
ESG practices
Variable remuneration of all
directors linked to ESG goals (1Y)
ESG Goals linked to Camil’s
Strategy and Growth Opportunities
Support to ESG and Ethics
Committee
Formed by 4 directors, for
monitoring the working groups to
implement goals and adherent
practices
8 Working groups in ESG
(material themes)
Multidisciplinary teams (+80
people), distributed in the 5
countries where Camil operates
Quarterly meetings to
evaluate and improve ESG
themes
29. Sustainable Culture
✓Variable compensation of all directors linked to ESG
goals
✓+80 people in the ESG Brazil, Uruguay, Chile, Peru
and Ecuador WGs, with initiatives linked to material
topics and monitored by the ESG and Ethics
Committee
✓66% independent members on the Board of
Directors
Ethics & Integrity
✓Integrity Program and new training reaching +98%
of the Company's target audience
✓LatAm Integrated Risk Management
Employee Health, Safety and Development
✓+50% of plants in Brazil with zero lost-time
accidents
✓Training School project in the Itaqui community in
professional courses
Purpose and
People
Quality and
Sales
All ESG actions
aligned with Camil’s
Strategic Plan
Eficiency and
Growth
UN Global Compact
signatory
Women on Board
Ecoefficiency
✓100% of Brazil units operating with renewable energy
✓+40% of consumed energy generated by Camil, through
the consumption of 97k ton of rice husk
✓ New Termo Project: consumption of up to 100% of the
husk generated in Cambaí/Itaqui (RS) for energy
✓Annual inventory of GHG emissions and Score C at CDP
(Climate Change; Water Security)
Supply
✓Workshops for suppliers on best ESG practices
Social Investment
✓Confectionery and Business School Doce Futuro União
2.0, with more than 600 graduates
✓Business School Grãos da Base, We trained 24
businesses in four months; in the course, we covered
topics such as business management, culinary arts,
marketing, among others.
To learn more about our sustainable initiatives, check our sustainability report with our performance and
progress on environmental, ethics and community on LatAm.
ESG Highlights
29
Corporate Sustainability
Index
2024