LG display 034220 Algorithm Investment Report
•
0 likes•54 views

LG display 034220 Algorithm Investment Report
![[Price for scheduled purchasing]
Arbitrarily made
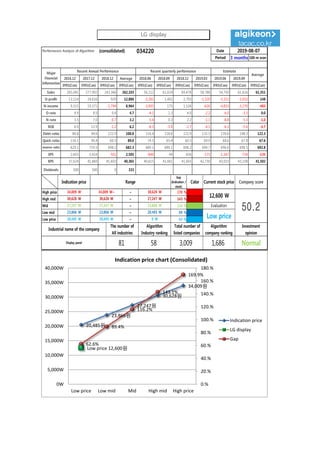
Algorithm stocks Trading Strategies (consolidated) 034220 Date
Period
Gap
(Indication /
stock)
Color
low price 20,485 W 20,485 W ~ 0 W 63 % -513,073 W -25
Low mid 23,866 W 23,866 W ~ 20,485 W 89 % -733,063 W -31
Mid 27,247 W 27,247 W ~ 23,866 W 116 % -953,053 W All selling
High mid 30,628 W 30,628 W ~ 27,247 W 143 % -1,173,043 W All selling
Suggested Purchase
Amount 819,850 W
Number of stocks
purchased 65
Indication price Range Buying / Selling Buying / Selling [Stocks]
High price 34,009 W 34,009 W~ ~ 30,628 W 170 % -1,393,033 W All selling
2019-08-07
3 months
Current stock price Evaluation
Stock price rise
probability score
Investment opinion Prospective purchase amount
12,600 W Low price 4.4 Normal 2,500,000 W
44.9 40.1 42.2 29.2 41.7 42.6
2019.03.14 2019.04.11 2019.05.13 2019.06.11 2019.07.09 2019.08.06
Stock price rise
probability score
A Sector 49.3 46.9 39.8 46.2 46.0 44.8
4.4B Sector 40.4 33.3 44.6 46.2 37.5 40.4
Total average
2019.05.13 2019.06.11 2019.07.09 2019.08.06
Total of
increase rate
Total score
A Sector -5 % -18 % 14 % -1 % -3 %
-4 % 45.0B Sector -21 % 25 % 4 % -23 % 7 %
Total average -12 % 5 % -45 % 30 % 2 %
2019.04.11
49 47
40
46 46 45
40
33
45 46
38
40
45
40 42
29
42 43
0
10
20
30
40
50
60
2019.03.14 2019.04.11 2019.05.13 2019.06.11 2019.07.09 2019.08.06
Stock price rise probability score
A sector
B sector
Total average
-5%
-18%
14%
-1% -3%
-21%
25%
4%
-23%
7%
-12%
5%
-45%
30%
2%
-60%
-40%
-20%
0%
20%
40%
2019.04.11 2019.05.13 2019.06.11 2019.07.09 2019.08.06
Increase rate of stock price rise
A sector
B sector
Total average
LG display](data:image/gif;base64,R0lGODlhAQABAIAAAAAAAP///yH5BAEAAAAALAAAAAABAAEAAAIBRAA7)
Recommended
Recommended
More Related Content
What's hot
What's hot (20)
Similar to LG display 034220 Algorithm Investment Report
Similar to LG display 034220 Algorithm Investment Report (20)
More from 알고리즘 기업분석 컨설팅-알기컨,algikeon
More from 알고리즘 기업분석 컨설팅-알기컨,algikeon (20)
Recently uploaded
Recently uploaded (20)
LG display 034220 Algorithm Investment Report
- 1. Performance Analysis of Algorithm (consolidated) 034220 Date Period 3 months 100-m won 2016.12 2017.12 2018.12 Average 2018.06 2018.09 2018.12 2019.03 2019.06 2019.09 IFRS(Con) IFRS(Con) IFRS(Con) IFRS(Con) IFRS(Con) IFRS(Con) IFRS(Con) IFRS(Con) IFRS(Con) IFRS(Con) IFRS(Con) Sales 265,041 277,902 243,366 262,103 56,112 61,024 69,478 58,788 54,750 61,616 61,351 O-profit 13,114 24,616 929 12,886 -2,281 1,401 2,793 -1,320 -3,311 -2,032 148 N-income 9,315 19,371 -1,794 8,964 -3,005 175 1,526 -626 -4,833 -3,270 -483 O-rate 4.9 8.9 0.4 4.7 -4.1 2.3 4.0 -2.2 -6.0 -3.3 0.0 N-rate 3.5 7.0 -0.7 3.2 -5.4 0.3 2.2 -1.1 -8.8 -5.3 -1.0 ROE 6.9 12.9 -1.2 6.2 -8.3 -3.9 -2.7 -4.1 -6.3 -5.6 -4.7 Debt-ratio 84.8 94.6 122.9 100.8 116.4 118.6 122.9 131.5 139.6 148.3 122.3 Quick-ratio 116.1 90.4 60.5 89.0 74.5 65.4 60.5 69.9 68.6 67.8 67.6 reserve-ratio 629.1 719.5 698.2 682.3 689.1 689.1 698.2 694.7 696.6 698.5 692.8 EPS 2,603 5,414 -501 2,505 -840 49 426 -175 -1,347 -724 -135 BPS 37,624 41,869 41,603 40,365 40,615 41,061 41,603 42,730 43,033 43,338 41,502 Dividends 500 500 0 333 Major Financial Information Recent Annual Performance Recent quarterly performance Estimate Average 2019-08-07 Gap (Indication / stock) Color High price ~ 170 % High mid ~ 143 % Mid ~ 116 % Low mid ~ 89 % Low price ~ 63 % Normal 20,485 W 20,485 W 0 W Industrial name of the company The number of All industries Algorithm Industry ranking Total number of listed companies Algorithm company ranking Investment opinion Display panel 81 58 3,009 1,686 30,628 W 30,628 W 27,247 W 27,247 W 27,247 W 23,866 W Evaluation 34,009 W 34,009 W~ 30,628 W 12,600 W 50.223,866 W 23,866 W 20,485 W Low price Indication price Range Current stock price Company score 20,485원 23,866원 27,247원 30,628원 34,009원 Low price 12,600원 62.6% 89.4% 116.2% 143.1% 169.9% 0.% 20.% 40.% 60.% 80.% 100.% 120.% 140.% 160.% 180.% 0W 5,000W 10,000W 15,000W 20,000W 25,000W 30,000W 35,000W 40,000W Low price Low mid Mid High mid High price Indication price chart (Consolidated) Indication price LG display Gap LG display
- 2. [Price for scheduled purchasing] Arbitrarily made Algorithm stocks Trading Strategies (consolidated) 034220 Date Period Gap (Indication / stock) Color low price 20,485 W 20,485 W ~ 0 W 63 % -513,073 W -25 Low mid 23,866 W 23,866 W ~ 20,485 W 89 % -733,063 W -31 Mid 27,247 W 27,247 W ~ 23,866 W 116 % -953,053 W All selling High mid 30,628 W 30,628 W ~ 27,247 W 143 % -1,173,043 W All selling Suggested Purchase Amount 819,850 W Number of stocks purchased 65 Indication price Range Buying / Selling Buying / Selling [Stocks] High price 34,009 W 34,009 W~ ~ 30,628 W 170 % -1,393,033 W All selling 2019-08-07 3 months Current stock price Evaluation Stock price rise probability score Investment opinion Prospective purchase amount 12,600 W Low price 4.4 Normal 2,500,000 W 44.9 40.1 42.2 29.2 41.7 42.6 2019.03.14 2019.04.11 2019.05.13 2019.06.11 2019.07.09 2019.08.06 Stock price rise probability score A Sector 49.3 46.9 39.8 46.2 46.0 44.8 4.4B Sector 40.4 33.3 44.6 46.2 37.5 40.4 Total average 2019.05.13 2019.06.11 2019.07.09 2019.08.06 Total of increase rate Total score A Sector -5 % -18 % 14 % -1 % -3 % -4 % 45.0B Sector -21 % 25 % 4 % -23 % 7 % Total average -12 % 5 % -45 % 30 % 2 % 2019.04.11 49 47 40 46 46 45 40 33 45 46 38 40 45 40 42 29 42 43 0 10 20 30 40 50 60 2019.03.14 2019.04.11 2019.05.13 2019.06.11 2019.07.09 2019.08.06 Stock price rise probability score A sector B sector Total average -5% -18% 14% -1% -3% -21% 25% 4% -23% 7% -12% 5% -45% 30% 2% -60% -40% -20% 0% 20% 40% 2019.04.11 2019.05.13 2019.06.11 2019.07.09 2019.08.06 Increase rate of stock price rise A sector B sector Total average LG display
- 3. 정보와 완전 정보 결 투자판단 있습니 위배 무단으 숙지하 Compliance notice ① The information provided by The Algorithm Company Analysis Consulting is obtained through reliable data and information and The Algorithm Company Analysis Program (TACAP), but its accuracy or completeness are not guaranteed. Furthermore, it may change over time.Therefore, we are not legally responsible for the results of the data provided by The Algorithm Company Analysis Consulting because of information errors or omissions. ② The Algorithm Company Analysis Consulting and all the information provided on it site are reference materials for investment decisions and the final responsibility of investment is up to users utilizing this information. ③ The Algorithm Company Analysis Consulting and its site do not do anything that violates the related laws such as discretionary transaction. ④ Users can not reallocate and recycle the information provided by The Algorithm Company Analysis Consulting firm let alone the information provided by its Site. ⑤ Be sure to know about application period of this algorithm analysis report in order to improve its accuracy. Tel : 070 - 4667 - 5009 Email : tacac@tacac.co.kr Homepage : tacac.co.kr Blog : tacac.blog.me SERVICES M&A, IPO, RECOVER, CORPORATE RESTRUCTURING, MANAGEMENT OF TECHNOLOGY, BUSINESS STRATEGY, FAMILY BUSINESS Request : http://tacac.co.kr/?page_id=1374 ① Consulting The Algori accuracy o change ove results of Consulting ② informatio investmen up ③ do anythin transaction ④ The Algori informatio ⑤ analysis re