samsung electro mechanics 009150 algorithm investment report
•
0 likes•176 views

samsung electro mechanics 009150 algorithm investment report
![[Price for scheduled purchasing]
Arbitrarily made
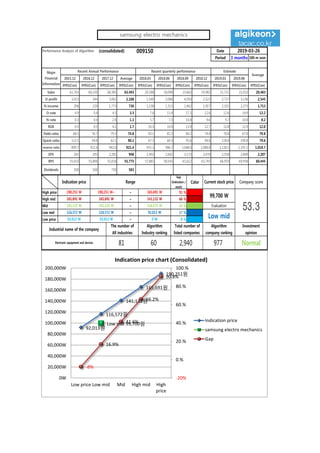
Algorithm stocks Trading Strategies (consolidated) 009150 Date
Period
Gap
(Indication /
stock)
Color
low price 92,013 W 92,013 W ~ 0 W -8 % 267,419 W 3
Low mid 116,572 W 116,572 W ~ 92,013 W 17 % -586,944 W -5
Mid 141,132 W 141,132 W ~ 116,572 W 42 % -1,441,308 W -10
High mid 165,691 W 165,691 W ~ 141,132 W 66 % -2,295,671 W -14
Suggested Purchase
Amount 3,468,319 W
Number of stocks
purchased 35
Indication price Range Buying / Selling Buying / Selling [Stocks]
High price 190,251 W 190,251 W~ ~ 165,691 W 91 % -3,150,034 W -17
2019-03-26
3 months
Current stock price Evaluation
Stock price rise
probability score
Investment opinion Prospective purchase amount
99,700 W Low mid 53.4 Normal 8,000,000 W
43.4 40.6 41.0 28.3 30.2 40.7
2018.10.25 2018.11.22 2018.12.20 2019.01.22 2019.02.22 2019.03.25
Stock price rise
probability score
A Sector 46.8 48.7 42.9 43.5 47.9 45.6
53.4B Sector 40.0 32.5 39.2 43.5 12.5 35.8
Total average
2018.12.20 2019.01.22 2019.02.22 2019.03.25
Total of
increase rate
Total score
A Sector 4 % -13 % 1 % 9 % -5 %
-4 % 46.3B Sector -23 % 17 % 10 % -248 % 65 %
Total average -7 % 1 % -45 % 6 % 26 %
2018.11.22
47 49
43 44
48 46
40
33
39
44
13
36
43
41 41
28 30
41
0
10
20
30
40
50
60
2018.10.25 2018.11.22 2018.12.20 2019.01.22 2019.02.22 2019.03.25
Stock price rise probability score
A sector
B sector
Total average
4%
-13% 1% 9% -5%
-23%
17% 10%
-248%
65%
-7% 1%
-45%
6%
26%
-300%
-250%
-200%
-150%
-100%
-50%
0%
50%
100%
2018.11.22 2018.12.20 2019.01.22 2019.02.22 2019.03.25
Increase rate of stock price rise
A sector
B sector
Total average
samsung electro mechanics](data:image/gif;base64,R0lGODlhAQABAIAAAAAAAP///yH5BAEAAAAALAAAAAABAAEAAAIBRAA7)
Recommended
Recommended
More Related Content
What's hot
What's hot (20)
Similar to samsung electro mechanics 009150 algorithm investment report
Similar to samsung electro mechanics 009150 algorithm investment report (20)
More from 알고리즘 기업분석 컨설팅-알기컨,algikeon
More from 알고리즘 기업분석 컨설팅-알기컨,algikeon (20)
Recently uploaded
Recently uploaded (20)
samsung electro mechanics 009150 algorithm investment report
- 1. Performance Analysis of Algorithm (consolidated) 009150 Date Period 3 months 100-m won 2015.12 2016.12 2017.12 Average 2018.03 2018.06 2018.09 2018.12 2019.03 2019.06 IFRS(Con) IFRS(Con) IFRS(Con) IFRS(Con) IFRS(Con) IFRS(Con) IFRS(Con) IFRS(Con) IFRS(Con) IFRS(Con) IFRS(Con) Sales 61,763 60,330 68,385 63,493 20,188 18,098 23,663 19,982 21,715 21,032 20,483 O-profit 3,013 244 3,062 2,106 1,540 2,068 4,050 2,523 2,727 3,136 2,545 N-income 206 229 1,773 736 1,158 1,313 2,462 1,917 2,101 2,273 1,713 O-rate 4.9 0.4 4.5 3.3 7.6 11.4 17.1 12.6 12.6 14.9 12.2 N-rate 0.3 0.4 2.6 1.1 5.7 7.3 10.4 9.6 9.7 10.8 8.2 ROE 0.5 0.5 4.1 1.7 10.3 10.9 13.9 12.7 12.8 12.9 12.0 Debt-ratio 68.5 76.7 79.3 74.8 83.1 81.2 80.2 74.8 70.8 67.0 79.8 Quick-ratio 113.5 94.8 62.1 90.1 67.3 60.5 95.6 94.8 128.8 190.8 79.6 reserve-ratio 899.7 922.4 942.0 921.4 955.3 986.7 1,048.0 1,088.8 1,138.5 1,191.1 1,019.7 EPS 265 295 2,285 948 1,492 1,692 3,173 2,470 2,558 2,809 2,207 BPS 55,610 55,896 55,818 55,775 57,882 58,543 61,612 63,743 66,959 69,958 60,445 Dividends 500 500 750 583 Major Financial Information Recent Annual Performance Recent quarterly performance Estimate Average 2019-03-26 Gap (Indication / stock) Color High price ~ 91 % High mid ~ 66 % Mid ~ 42 % Low mid ~ 17 % Low price ~ -8 % Normal 92,013 W 92,013 W 0 W Industrial name of the company The number of All industries Algorithm Industry ranking Total number of listed companies Algorithm company ranking Investment opinion Electronic equipment and devices 81 60 2,940 977 165,691 W 165,691 W 141,132 W 141,132 W 141,132 W 116,572 W Evaluation 190,251 W 190,251 W~ 165,691 W 99,700 W 53.3116,572 W 116,572 W 92,013 W Low mid Indication price Range Current stock price Company score 92,013원 116,572원 141,132원 165,691원 190,251원 Low mid 99,700원 -8% 16.9% 41.6% 66.2% 90.8% -20% 0.% 20.% 40.% 60.% 80.% 100.% 0W 20,000W 40,000W 60,000W 80,000W 100,000W 120,000W 140,000W 160,000W 180,000W 200,000W Low price Low mid Mid High mid High price Indication price chart (Consolidated) Indication price samsung electro mechanics Gap samsung electro mechanics
- 2. [Price for scheduled purchasing] Arbitrarily made Algorithm stocks Trading Strategies (consolidated) 009150 Date Period Gap (Indication / stock) Color low price 92,013 W 92,013 W ~ 0 W -8 % 267,419 W 3 Low mid 116,572 W 116,572 W ~ 92,013 W 17 % -586,944 W -5 Mid 141,132 W 141,132 W ~ 116,572 W 42 % -1,441,308 W -10 High mid 165,691 W 165,691 W ~ 141,132 W 66 % -2,295,671 W -14 Suggested Purchase Amount 3,468,319 W Number of stocks purchased 35 Indication price Range Buying / Selling Buying / Selling [Stocks] High price 190,251 W 190,251 W~ ~ 165,691 W 91 % -3,150,034 W -17 2019-03-26 3 months Current stock price Evaluation Stock price rise probability score Investment opinion Prospective purchase amount 99,700 W Low mid 53.4 Normal 8,000,000 W 43.4 40.6 41.0 28.3 30.2 40.7 2018.10.25 2018.11.22 2018.12.20 2019.01.22 2019.02.22 2019.03.25 Stock price rise probability score A Sector 46.8 48.7 42.9 43.5 47.9 45.6 53.4B Sector 40.0 32.5 39.2 43.5 12.5 35.8 Total average 2018.12.20 2019.01.22 2019.02.22 2019.03.25 Total of increase rate Total score A Sector 4 % -13 % 1 % 9 % -5 % -4 % 46.3B Sector -23 % 17 % 10 % -248 % 65 % Total average -7 % 1 % -45 % 6 % 26 % 2018.11.22 47 49 43 44 48 46 40 33 39 44 13 36 43 41 41 28 30 41 0 10 20 30 40 50 60 2018.10.25 2018.11.22 2018.12.20 2019.01.22 2019.02.22 2019.03.25 Stock price rise probability score A sector B sector Total average 4% -13% 1% 9% -5% -23% 17% 10% -248% 65% -7% 1% -45% 6% 26% -300% -250% -200% -150% -100% -50% 0% 50% 100% 2018.11.22 2018.12.20 2019.01.22 2019.02.22 2019.03.25 Increase rate of stock price rise A sector B sector Total average samsung electro mechanics
- 3. 정보와 완전 정보 결 투자판단 있습니 위배 무단으 숙지하 Compliance notice ① The information provided by The Algorithm Company Analysis Consulting is obtained through reliable data and information and The Algorithm Company Analysis Program (TACAP), but its accuracy or completeness are not guaranteed. Furthermore, it may change over time.Therefore, we are not legally responsible for the results of the data provided by The Algorithm Company Analysis Consulting because of information errors or omissions. ② The Algorithm Company Analysis Consulting and all the information provided on it site are reference materials for investment decisions and the final responsibility of investment is up to users utilizing this information. ③ The Algorithm Company Analysis Consulting and its site do not do anything that violates the related laws such as discretionary transaction. ④ Users can not reallocate and recycle the information provided by The Algorithm Company Analysis Consulting firm let alone the information provided by its Site. ⑤ Be sure to know about application period of this algorithm analysis report in order to improve its accuracy. Tel : 070 - 4667 - 5009 Email : tacac@tacac.co.kr Homepage : tacac.co.kr Blog : tacac.blog.me SERVICES EDUCATION, M&A, IPO, RECOVER, CORPORATE RESTRUCTURING, MANAGEMENT OF TECHNOLOGY, BUSINESS STRATEGY, FAMILY BUSINESS Request : http://tacac.co.kr/?page_id=1374 ① Consulting The Algori accuracy o change ove results of Consulting ② informatio investmen up ③ do anythin transaction ④ The Algori informatio ⑤ analysis re