kakao 035720 Algorithm Investment Report
•
0 likes•94 views

This document provides a performance analysis of an algorithm (consolidated) over several periods from 2017-2020. It includes key financial metrics such as sales, operating profit, net income, operating rate, net rate, and debt ratio. It also analyzes stock price rise probability scores for different sectors over time and suggests amounts to purchase algorithm stocks at different price levels based on the current stock price and indication price range.
![[Price for scheduled purchasing]
Arbitrarily made
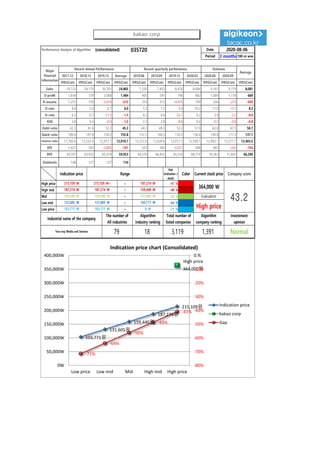
Algorithm stocks Trading Strategies (consolidated) 035720 Date
Period
Gap
(Indication /
stock)
Color
low price 103,771 W 103,771 W ~ 0 W -71 % 580,822 W 6
Low mid 131,605 W 131,605 W ~ 103,771 W -64 % 518,696 W 4
Mid 159,440 W 159,440 W ~ 131,605 W -56 % 456,571 W 3
High mid 187,274 W 187,274 W ~ 159,440 W -49 % 394,445 W 2
Suggested Purchase
Amount 812,434 W
Number of stocks
purchased 2
Indication price Range Buying / Selling Buying / Selling [Stocks]
High price 215,109 W 215,109 W~ ~ 187,274 W -41 % 332,320 W 2
2020-08-06
3 months
Current stock price Evaluation
Stock price rise
probability score
Investment opinion Prospective purchase amount
364,000 W High price 42.8 Normal 3,000,000 W
36.7 44.1 53.3 39.6 35.0 34.6
2020.03.13 2020.04.10 2020.05.14 2020.06.11 2020.07.09 2020.08.06
Stock price rise
probability score
A Sector 46.8 49.4 51.6 49.3 43.8 44.6
42.8B Sector 26.7 38.8 55.0 49.3 26.3 24.6
Total average
2020.05.14 2020.06.11 2020.07.09 2020.08.06
Total of
increase rate
Total score
A Sector 5 % 4 % -5 % -13 % 2 %
-3 % 46.3B Sector 31 % 30 % -12 % -88 % -7 %
Total average 17 % 17 % -35 % -13 % -1 %
2020.04.10
47 49 52 49
44 45
27
39
55
49
26 25
37
44
53
40
35 35
0
10
20
30
40
50
60
2020.03.13 2020.04.10 2020.05.14 2020.06.11 2020.07.09 2020.08.06
Stock price rise probability score
A sector
B sector
Total average
5% 4%
-5%
-13%
2%
31% 30%
-12%
-88%
-7%
17% 17%
-35%
-13%
-1%
-100%
-80%
-60%
-40%
-20%
0%
20%
40%
2020.04.10 2020.05.14 2020.06.11 2020.07.09 2020.08.06
Increase rate of stock price rise
A sector
B sector
Total average
kakao corp](data:image/gif;base64,R0lGODlhAQABAIAAAAAAAP///yH5BAEAAAAALAAAAAABAAEAAAIBRAA7)
Recommended
Recommended
More Related Content
What's hot
What's hot (20)
Similar to kakao 035720 Algorithm Investment Report
Similar to kakao 035720 Algorithm Investment Report (20)
More from 알고리즘 기업분석 컨설팅-알기컨,algikeon
More from 알고리즘 기업분석 컨설팅-알기컨,algikeon (20)
Recently uploaded
Recently uploaded (8)
kakao 035720 Algorithm Investment Report
- 1. Performance Analysis of Algorithm (consolidated) 035720 Date Period 3 months 100-m won 2017.12 2018.12 2019.12 Average 2019.06 2019.09 2019.12 2020.03 2020.06 2020.09 IFRS(Con) IFRS(Con) IFRS(Con) IFRS(Con) IFRS(Con) IFRS(Con) IFRS(Con) IFRS(Con) IFRS(Con) IFRS(Con) IFRS(Con) Sales 19,723 24,170 30,701 24,865 7,330 7,832 8,476 8,684 9,161 9,719 8,081 O-profit 1,654 729 2,068 1,484 405 591 796 882 1,004 1,178 669 N-income 1,251 159 -3,419 -670 310 515 -4,419 799 356 -215 -699 O-rate 8.4 3.0 6.7 6.0 5.5 7.5 9.4 10.2 11.0 12.1 8.2 N-rate 6.3 0.7 -11.1 -1.4 4.2 6.6 -52.1 9.2 3.9 -2.2 -8.0 ROE 2.8 0.3 -6.0 -1.0 2.2 2.8 -8.6 0.4 -0.2 -0.8 -0.8 Debt-ratio 42.3 41.4 52.2 45.3 44.3 49.3 52.2 57.0 62.0 67.5 50.7 Quick-ratio 189.4 147.8 130.2 155.8 137.3 144.5 130.2 136.4 149.8 171.3 137.1 reserve-ratio 11,782.6 12,232.4 12,017.1 12,010.7 12,372.0 12,628.6 12,017.1 12,596.1 12,902.7 13,217.7 12,403.5 EPS 1,421 181 -3,885 -761 352 585 -5,021 908 403 -242 -794 BPS 50,707 63,935 65,218 59,953 64,376 66,852 65,218 68,714 70,263 71,847 66,290 Dividends 148 127 127 134 Major Financial Information Recent Annual Performance Recent quarterly performance Estimate Average 2020-08-06 Gap (Indication / stock) Color High price ~ -41 % High mid ~ -49 % Mid ~ -56 % Low mid ~ -64 % Low price ~ -71 % Normal 103,771 W 103,771 W 0 W Industrial name of the company The number of All industries Algorithm Industry ranking Total number of listed companies Algorithm company ranking Investment opinion Two-way Media and Services 79 18 3,119 1,391 187,274 W 187,274 W 159,440 W 159,440 W 159,440 W 131,605 W Evaluation 215,109 W 215,109 W~ 187,274 W 364,000 W 43.2131,605 W 131,605 W 103,771 W High price Indication price Range Current stock price Company score 103,771원 131,605원 159,440원 187,274원 215,109원 High price 364,000원 -71% -64% -56% -49% -41% -80% -70% -60% -50% -40% -30% -20% -10% 0.% 0W 50,000W 100,000W 150,000W 200,000W 250,000W 300,000W 350,000W 400,000W Low price Low mid Mid High mid High price Indication price chart (Consolidated) Indication price kakao corp Gap kakao corp
- 2. [Price for scheduled purchasing] Arbitrarily made Algorithm stocks Trading Strategies (consolidated) 035720 Date Period Gap (Indication / stock) Color low price 103,771 W 103,771 W ~ 0 W -71 % 580,822 W 6 Low mid 131,605 W 131,605 W ~ 103,771 W -64 % 518,696 W 4 Mid 159,440 W 159,440 W ~ 131,605 W -56 % 456,571 W 3 High mid 187,274 W 187,274 W ~ 159,440 W -49 % 394,445 W 2 Suggested Purchase Amount 812,434 W Number of stocks purchased 2 Indication price Range Buying / Selling Buying / Selling [Stocks] High price 215,109 W 215,109 W~ ~ 187,274 W -41 % 332,320 W 2 2020-08-06 3 months Current stock price Evaluation Stock price rise probability score Investment opinion Prospective purchase amount 364,000 W High price 42.8 Normal 3,000,000 W 36.7 44.1 53.3 39.6 35.0 34.6 2020.03.13 2020.04.10 2020.05.14 2020.06.11 2020.07.09 2020.08.06 Stock price rise probability score A Sector 46.8 49.4 51.6 49.3 43.8 44.6 42.8B Sector 26.7 38.8 55.0 49.3 26.3 24.6 Total average 2020.05.14 2020.06.11 2020.07.09 2020.08.06 Total of increase rate Total score A Sector 5 % 4 % -5 % -13 % 2 % -3 % 46.3B Sector 31 % 30 % -12 % -88 % -7 % Total average 17 % 17 % -35 % -13 % -1 % 2020.04.10 47 49 52 49 44 45 27 39 55 49 26 25 37 44 53 40 35 35 0 10 20 30 40 50 60 2020.03.13 2020.04.10 2020.05.14 2020.06.11 2020.07.09 2020.08.06 Stock price rise probability score A sector B sector Total average 5% 4% -5% -13% 2% 31% 30% -12% -88% -7% 17% 17% -35% -13% -1% -100% -80% -60% -40% -20% 0% 20% 40% 2020.04.10 2020.05.14 2020.06.11 2020.07.09 2020.08.06 Increase rate of stock price rise A sector B sector Total average kakao corp
- 3. 정보와 완전 정보 결 투자판단 있습니 위배 무단으 숙지하 Compliance notice ① The information provided by The Algorithm Company Analysis Consulting is obtained through reliable data and information and The Algorithm Company Analysis Program (TACAP), but its accuracy or completeness are not guaranteed. Furthermore, it may change over time.Therefore, we are not legally responsible for the results of the data provided by The Algorithm Company Analysis Consulting because of information errors or omissions. ② The Algorithm Company Analysis Consulting and all the information provided on it site are reference materials for investment decisions and the final responsibility of investment is up to users utilizing this information. ③ The Algorithm Company Analysis Consulting and its site do not do anything that violates the related laws such as discretionary transaction. ④ Users can not reallocate and recycle the information provided by The Algorithm Company Analysis Consulting firm let alone the information provided by its Site. ⑤ Be sure to know about application period of this algorithm analysis report in order to improve its accuracy. Tel : 070 - 4667 - 5009 Email : tacac@tacac.co.kr Homepage : tacac.co.kr Blog : tacac.blog.me SERVICES M&A, IPO, RECOVER, CORPORATE RESTRUCTURING, MANAGEMENT OF TECHNOLOGY, BUSINESS STRATEGY, FAMILY BUSINESS Request : http://tacac.co.kr/?page_id=1374 ① Consulting is o The Algorithm accuracy or com change over tim results of the d Consulting bec ② information pr investment dec up ③ do anything th transaction. ④ The Algorithm information pr ⑤ analysis report