naver 035420 Algorithm Investment Report
•
0 likes•54 views

naver 035420 Algorithm Investment Report
![[Price for scheduled purchasing]
Arbitrarily made
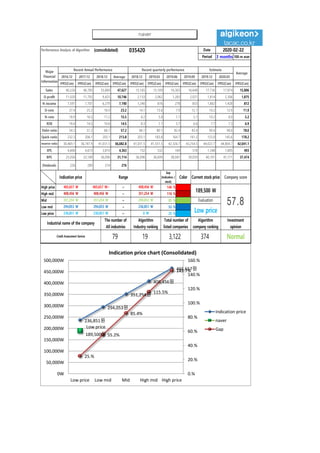
Algorithm stocks Trading Strategies (consolidated) 035420 Date
Period
Gap
(Indication /
stock)
Color
2020-02-22
3 months
Current stock price Evaluation
Stock price rise
probability score
Investment opinion Prospective purchase amount
189,500 W Low price 52.7 Normal 18,000,000 W
Suggested Purchase
Amount 8,928,758 W
Number of stocks
purchased 47
Indication price Range Buying / Selling Buying / Selling [Stocks]
High price 465,657 W 465,657 W~ ~ 408,456 W 146 % -13,011,818 W All selling
High mid 408,456 W 408,456 W ~ 351,254 W 116 % -10,316,629 W All selling
Mid 351,254 W 351,254 W ~ 294,053 W 85 % -7,621,440 W -22
Low mid 294,053 W 294,053 W ~ 236,851 W 55 % -4,926,251 W -17
low price 236,851 W 236,851 W ~ 0 W 25 % -2,231,062 W -9
Stock price rise
probability score
A Sector 55.2 44.9 48.1 48.0 50.7 48.9
52.7B Sector 36.7 30.0 37.1 48.0 20.8 44.6
Total average
2019.09.25 2019.10.25 2019.11.22 2019.12.20 2020.01.22 2020.02.21
45.9 37.5 42.6 52.5 35.8 46.8
-47 % 24 %
2019.10.25 2019.11.22 2019.12.20 2020.01.22 2020.02.21
Total of
increase rate
Total score
A Sector -23 % 7 % -0 % 5 % -4 %
-3 % 47.0B Sector -22 % 19 % 23 % -130 % 53 %
Total average -23 % 12 % 19 %
55
45
48 48
51 49
37
30
37
48
21
4546
37
43
53
36
47
0
10
20
30
40
50
60
2019.09.25 2019.10.25 2019.11.22 2019.12.20 2020.01.22 2020.02.21
Stock price rise probability score
A sector
B sector
Total average
-23%
7% -0% 5% -4%
-22%
19% 23%
-130%
53%
-23%
12% 19%
-47%
24%
-150%
-100%
-50%
0%
50%
100%
2019.10.25 2019.11.22 2019.12.20 2020.01.22 2020.02.21
Increase rate of stock price rise
A sector
B sector
Total average
naver](data:image/gif;base64,R0lGODlhAQABAIAAAAAAAP///yH5BAEAAAAALAAAAAABAAEAAAIBRAA7)
Recommended
Recommended
More Related Content
What's hot
What's hot (20)
Similar to naver 035420 Algorithm Investment Report
Similar to naver 035420 Algorithm Investment Report (20)
More from 알고리즘 기업분석 컨설팅-알기컨,algikeon
More from 알고리즘 기업분석 컨설팅-알기컨,algikeon (20)
Recently uploaded
Recently uploaded (20)
naver 035420 Algorithm Investment Report
- 1. Performance Analysis of Algorithm (consolidated) 035420 Date Period 3 months 100-m won 2016.12 2017.12 2018.12 Average 2018.12 2019.03 2019.06 2019.09 2019.12 2020.03 IFRS(Con) IFRS(Con) IFRS(Con) IFRS(Con) IFRS(Con) IFRS(Con) IFRS(Con) IFRS(Con) IFRS(Con) IFRS(Con) IFRS(Con) Sales 40,226 46,785 55,869 47,627 15,165 15,109 16,303 16,648 17,736 17,874 15,806 O-profit 11,020 11,792 9,425 10,746 2,133 2,062 1,283 2,021 1,814 2,306 1,875 N-income 7,591 7,701 6,279 7,190 1,240 876 278 853 1,802 1,428 812 O-rate 27.4 25.2 16.9 23.2 14.1 13.6 7.9 12.1 10.2 12.9 11.9 N-rate 18.9 16.5 11.2 15.5 8.2 5.8 1.7 5.1 10.2 8.0 5.2 ROE 18.4 14.5 10.6 14.5 8.3 7.1 5.7 6.6 7.7 7.3 6.9 Debt-ratio 54.3 51.2 66.1 57.2 66.1 80.1 82.4 83.4 90.4 98.0 78.0 Quick-ratio 232.3 206.1 203.1 213.8 203.1 183.8 164.7 161.2 153.0 145.6 178.2 reserve-ratio 30,469.1 36,747.9 41,031.5 36,082.8 41,031.5 41,551.5 42,326.7 43,254.5 44,022.7 44,804.7 42,041.1 EPS 4,606 4,673 3,810 4,363 752 532 169 518 1,348 1,005 493 BPS 25,056 32,189 36,096 31,114 36,096 36,699 38,041 39,059 40,101 41,171 37,474 Dividends 226 289 314 276 2020-02-22 Major Financial Information Recent Annual Performance Recent quarterly performance Estimate Average Gap (Indication / stock) Color High price ~ 146 % High mid ~ 116 % Mid ~ 85 % Low mid ~ 55 % Low price ~ 25 % Indication price Range Current stock price Company score 408,456 W 408,456 W 351,254 W 351,254 W 351,254 W 294,053 W Evaluation 465,657 W 465,657 W~ 408,456 W 189,500 W 57.8294,053 W 294,053 W 236,851 W Low price Normal 236,851 W 236,851 W 0 W Industrial name of the company The number of All industries Algorithm Industry ranking Total number of listed companies Algorithm company ranking Investment opinion Credit Assessment Service 79 19 3,122 374 236,851원 294,053원 351,254원 408,456원 465,657원 Low price 189,500원 25.% 55.2% 85.4% 115.5% 145.7% 0.% 20.% 40.% 60.% 80.% 100.% 120.% 140.% 160.% 0W 50,000W 100,000W 150,000W 200,000W 250,000W 300,000W 350,000W 400,000W 450,000W 500,000W Low price Low mid Mid High mid High price Indication price chart (Consolidated) Indication price naver Gap naver
- 2. [Price for scheduled purchasing] Arbitrarily made Algorithm stocks Trading Strategies (consolidated) 035420 Date Period Gap (Indication / stock) Color 2020-02-22 3 months Current stock price Evaluation Stock price rise probability score Investment opinion Prospective purchase amount 189,500 W Low price 52.7 Normal 18,000,000 W Suggested Purchase Amount 8,928,758 W Number of stocks purchased 47 Indication price Range Buying / Selling Buying / Selling [Stocks] High price 465,657 W 465,657 W~ ~ 408,456 W 146 % -13,011,818 W All selling High mid 408,456 W 408,456 W ~ 351,254 W 116 % -10,316,629 W All selling Mid 351,254 W 351,254 W ~ 294,053 W 85 % -7,621,440 W -22 Low mid 294,053 W 294,053 W ~ 236,851 W 55 % -4,926,251 W -17 low price 236,851 W 236,851 W ~ 0 W 25 % -2,231,062 W -9 Stock price rise probability score A Sector 55.2 44.9 48.1 48.0 50.7 48.9 52.7B Sector 36.7 30.0 37.1 48.0 20.8 44.6 Total average 2019.09.25 2019.10.25 2019.11.22 2019.12.20 2020.01.22 2020.02.21 45.9 37.5 42.6 52.5 35.8 46.8 -47 % 24 % 2019.10.25 2019.11.22 2019.12.20 2020.01.22 2020.02.21 Total of increase rate Total score A Sector -23 % 7 % -0 % 5 % -4 % -3 % 47.0B Sector -22 % 19 % 23 % -130 % 53 % Total average -23 % 12 % 19 % 55 45 48 48 51 49 37 30 37 48 21 4546 37 43 53 36 47 0 10 20 30 40 50 60 2019.09.25 2019.10.25 2019.11.22 2019.12.20 2020.01.22 2020.02.21 Stock price rise probability score A sector B sector Total average -23% 7% -0% 5% -4% -22% 19% 23% -130% 53% -23% 12% 19% -47% 24% -150% -100% -50% 0% 50% 100% 2019.10.25 2019.11.22 2019.12.20 2020.01.22 2020.02.21 Increase rate of stock price rise A sector B sector Total average naver
- 3. Compliance notice ① The information provided by The Algorithm Company Analysis Consulting is obtained through reliable data and information and The Algorithm Company Analysis Program (TACAP), but its accuracy or completeness are not guaranteed. Furthermore, it may change over time.Therefore, we are not legally responsible for the results of the data provided by The Algorithm Company Analysis Consulting because of information errors or omissions. ② The Algorithm Company Analysis Consulting and all the information provided on it site are reference materials for investment decisions and the final responsibility of investment is up to users utilizing this information. ③ The Algorithm Company Analysis Consulting and its site do not do anything that violates the related laws such as discretionary transaction. ④ Users can not reallocate and recycle the information provided by The Algorithm Company Analysis Consulting firm let alone the information provided by its Site. ⑤ Be sure to know about application period of this algorithm analysis report in order to improve its accuracy. Tel : 070 - 4667 - 5009 Email : tacac@tacac.co.kr Homepage : tacac.co.kr Blog : tacac.blog.me SERVICES M&A, IPO, RECOVER, CORPORATE RESTRUCTURING, MANAGEMENT OF TECHNOLOGY, BUSINESS STRATEGY, FAMILY BUSINESS Request : http://tacac.co.kr/?page_id=1374 ① Consulting is ob The Algorithm C accuracy or com may change ove for the results o Analysis Consul ② information prov investment decis up ③ do anything tha transaction. ④ by information prov ⑤ analysis report i