Celltrion 068270 Algorithm Investment Report
•
0 likes•45 views

Celltrion 068270 Algorithm Investment Report
![[Price for scheduled purchasing]
Arbitrarily made
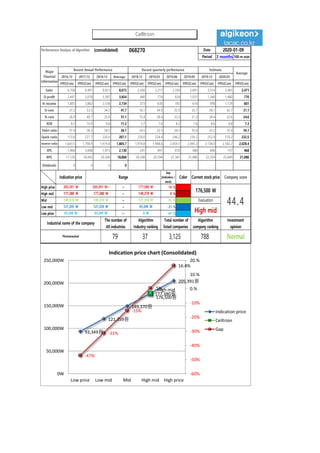
Algorithm stocks Trading Strategies (consolidated) 068270 Date
Period
Gap
(Indication /
stock)
Color
low price 93,349 W 93,349 W ~ 0 W -47 % 329,381 W 4
Low mid 121,359 W 121,359 W ~ 93,349 W -31 % 218,425 W 2
Mid 149,370 W 149,370 W ~ 121,359 W -15 % 107,469 W 1
High mid 177,380 W 177,380 W ~ 149,370 W 0 % -3,487 W -0
Suggested Purchase
Amount 699,156 W
Number of stocks
purchased 4
Indication price Range Buying / Selling Buying / Selling [Stocks]
High price 205,391 W 205,391 W~ ~ 177,380 W 16 % -114,443 W -1
2020-01-09
3 months
Current stock price Evaluation
Stock price rise
probability score
Investment opinion Prospective purchase amount
176,500 W High mid 47.5 Normal 2,000,000 W
41.6 49.8 43.1 45.8 43.6 49.0
2019.08.09 2019.09.09 2019.10.11 2019.11.08 2019.12.06 2020.01.08
Stock price rise
probability score
A Sector 47.7 52.0 48.3 50.4 47.2 54.6
47.5B Sector 35.4 47.5 37.9 50.4 40.0 43.3
Total average
2019.10.11 2019.11.08 2019.12.06 2020.01.08
Total of
increase rate
Total score
A Sector 8 % -8 % 4 % -7 % 14 %
3 % 49.0B Sector 25 % -25 % 25 % -26 % 8 %
Total average 16 % -15 % 6 % -5 % 11 %
2019.09.09
48
52
48 50
47
55
35
48
38
50
40
4342
50
43
46 44
49
0
10
20
30
40
50
60
2019.08.09 2019.09.09 2019.10.11 2019.11.08 2019.12.06 2020.01.08
Stock price rise probability score
A sector
B sector
Total average
8%
-8%
4%
-7%
14%
25%
-25%
25%
-26%
8%
16%
-15%
6%
-5%
11%
-30%
-20%
-10%
0%
10%
20%
30%
2019.09.09 2019.10.11 2019.11.08 2019.12.06 2020.01.08
Increase rate of stock price rise
A sector
B sector
Total average
Celltrion](data:image/gif;base64,R0lGODlhAQABAIAAAAAAAP///yH5BAEAAAAALAAAAAABAAEAAAIBRAA7)
Recommended
Recommended
More Related Content
What's hot
What's hot (20)
Similar to Celltrion 068270 Algorithm Investment Report
Similar to Celltrion 068270 Algorithm Investment Report (20)
More from 알고리즘 기업분석 컨설팅-알기컨,algikeon
More from 알고리즘 기업분석 컨설팅-알기컨,algikeon (20)
Recently uploaded
Recently uploaded (20)
Celltrion 068270 Algorithm Investment Report
- 1. Performance Analysis of Algorithm (consolidated) 068270 Date Period 3 months 100-m won 2016.12 2017.12 2018.12 Average 2018.12 2019.03 2019.06 2019.09 2019.12 2020.03 IFRS(Con) IFRS(Con) IFRS(Con) IFRS(Con) IFRS(Con) IFRS(Con) IFRS(Con) IFRS(Con) IFRS(Con) IFRS(Con) IFRS(Con) Sales 6,706 9,491 9,821 8,673 2,426 2,217 2,350 2,891 3,514 3,465 2,471 O-profit 2,497 5,078 3,387 3,654 440 774 834 1,031 1,340 1,480 770 N-income 1,805 3,862 2,536 2,734 373 630 783 616 998 1,129 601 O-rate 37.2 53.5 34.5 41.7 18.1 34.9 35.5 35.7 38.1 42.7 31.1 N-rate 26.9 40.7 25.8 31.1 15.4 28.4 33.3 21.3 28.4 32.6 24.6 ROE 8.2 15.9 9.6 11.2 5.7 7.6 8.2 7.6 8.6 8.8 7.3 Debt-ratio 37.4 36.3 34.5 36.1 34.5 32.5 34.3 35.0 35.2 35.4 34.1 Quick-ratio 173.6 227.7 220.0 207.1 220.0 224.4 246.2 239.2 252.9 270.2 232.5 reserve-ratio 1,643.5 1,798.9 1,974.8 1,805.7 1,974.8 1,984.6 2,059.1 2,095.2 2,138.0 2,182.2 2,028.4 EPS 1,406 3,008 1,975 2,130 291 491 610 480 896 737 468 BPS 17,129 18,943 20,508 18,860 20,508 20,594 21,361 21,880 22,359 22,849 21,086 Dividends 0 0 0 0 Major Financial Information Recent Annual Performance Recent quarterly performance Estimate Average 2020-01-09 Gap (Indication / stock) Color High price ~ 16 % High mid ~ 0 % Mid ~ -15 % Low mid ~ -31 % Low price ~ -47 % Normal 93,349 W 93,349 W 0 W Industrial name of the company The number of All industries Algorithm Industry ranking Total number of listed companies Algorithm company ranking Investment opinion Pharmaceutical 79 37 3,125 788 177,380 W 177,380 W 149,370 W 149,370 W 149,370 W 121,359 W Evaluation 205,391 W 205,391 W~ 177,380 W 176,500 W 44.4121,359 W 121,359 W 93,349 W High mid Indication price Range Current stock price Company score 93,349원 121,359원 149,370원 177,380원 205,391원 High mid 176,500원 -47% -31% -15% .5% 16.4% -60% -50% -40% -30% -20% -10% 0.% 10.% 20.% 0W 50,000W 100,000W 150,000W 200,000W 250,000W Low price Low mid Mid High mid High price Indication price chart (Consolidated) Indication price Celltrion Gap Celltrion
- 2. [Price for scheduled purchasing] Arbitrarily made Algorithm stocks Trading Strategies (consolidated) 068270 Date Period Gap (Indication / stock) Color low price 93,349 W 93,349 W ~ 0 W -47 % 329,381 W 4 Low mid 121,359 W 121,359 W ~ 93,349 W -31 % 218,425 W 2 Mid 149,370 W 149,370 W ~ 121,359 W -15 % 107,469 W 1 High mid 177,380 W 177,380 W ~ 149,370 W 0 % -3,487 W -0 Suggested Purchase Amount 699,156 W Number of stocks purchased 4 Indication price Range Buying / Selling Buying / Selling [Stocks] High price 205,391 W 205,391 W~ ~ 177,380 W 16 % -114,443 W -1 2020-01-09 3 months Current stock price Evaluation Stock price rise probability score Investment opinion Prospective purchase amount 176,500 W High mid 47.5 Normal 2,000,000 W 41.6 49.8 43.1 45.8 43.6 49.0 2019.08.09 2019.09.09 2019.10.11 2019.11.08 2019.12.06 2020.01.08 Stock price rise probability score A Sector 47.7 52.0 48.3 50.4 47.2 54.6 47.5B Sector 35.4 47.5 37.9 50.4 40.0 43.3 Total average 2019.10.11 2019.11.08 2019.12.06 2020.01.08 Total of increase rate Total score A Sector 8 % -8 % 4 % -7 % 14 % 3 % 49.0B Sector 25 % -25 % 25 % -26 % 8 % Total average 16 % -15 % 6 % -5 % 11 % 2019.09.09 48 52 48 50 47 55 35 48 38 50 40 4342 50 43 46 44 49 0 10 20 30 40 50 60 2019.08.09 2019.09.09 2019.10.11 2019.11.08 2019.12.06 2020.01.08 Stock price rise probability score A sector B sector Total average 8% -8% 4% -7% 14% 25% -25% 25% -26% 8% 16% -15% 6% -5% 11% -30% -20% -10% 0% 10% 20% 30% 2019.09.09 2019.10.11 2019.11.08 2019.12.06 2020.01.08 Increase rate of stock price rise A sector B sector Total average Celltrion
- 3. Compliance notice ① The information provided by The Algorithm Company Analysis Consulting is obtained through reliable data and information and The Algorithm Company Analysis Program (TACAP), but its accuracy or completeness are not guaranteed. Furthermore, it may change over time.Therefore, we are not legally responsible for the results of the data provided by The Algorithm Company Analysis Consulting because of information errors or omissions. ② The Algorithm Company Analysis Consulting and all the information provided on it site are reference materials for investment decisions and the final responsibility of investment is up to users utilizing this information. ③ The Algorithm Company Analysis Consulting and its site do not do anything that violates the related laws such as discretionary transaction. ④ Users can not reallocate and recycle the information provided by The Algorithm Company Analysis Consulting firm let alone the information provided by its Site. ⑤ Be sure to know about application period of this algorithm analysis report in order to improve its accuracy. Tel : 070 - 4667 - 5009 Email : tacac@tacac.co.kr Homepage : tacac.co.kr Blog : tacac.blog.me SERVICES M&A, IPO, RECOVER, CORPORATE RESTRUCTURING, MANAGEMENT OF TECHNOLOGY, BUSINESS STRATEGY, FAMILY BUSINESS Request : http://tacac.co.kr/?page_id=1374 ① Consulting is ob The Algorithm C accuracy or com may change ove for the results o Analysis Consul ② information prov investment decis up ③ do anything tha transaction. ④ by information prov ⑤ analysis report i